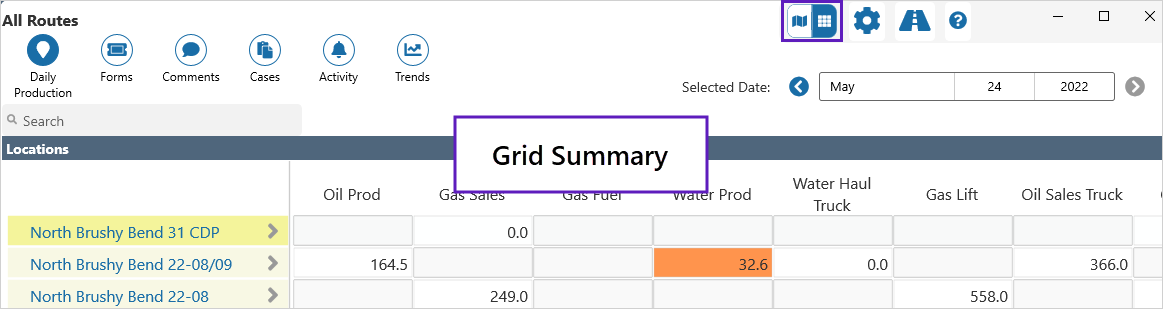
The Grid Summary view is one of Field Operator's three main views, and displays location summary data.
You can view the history of what is happening at a location, with up to three months of historical data available to view.
You can also navigate to the Location Detail view to enter data, or to look at what is happening at a location in more detail.
Click on the View Mode ![]() icon to toggle between the Map and Grid Summary.
icon to toggle between the Map and Grid Summary.
The main features of the Grid Summary view are explained below.
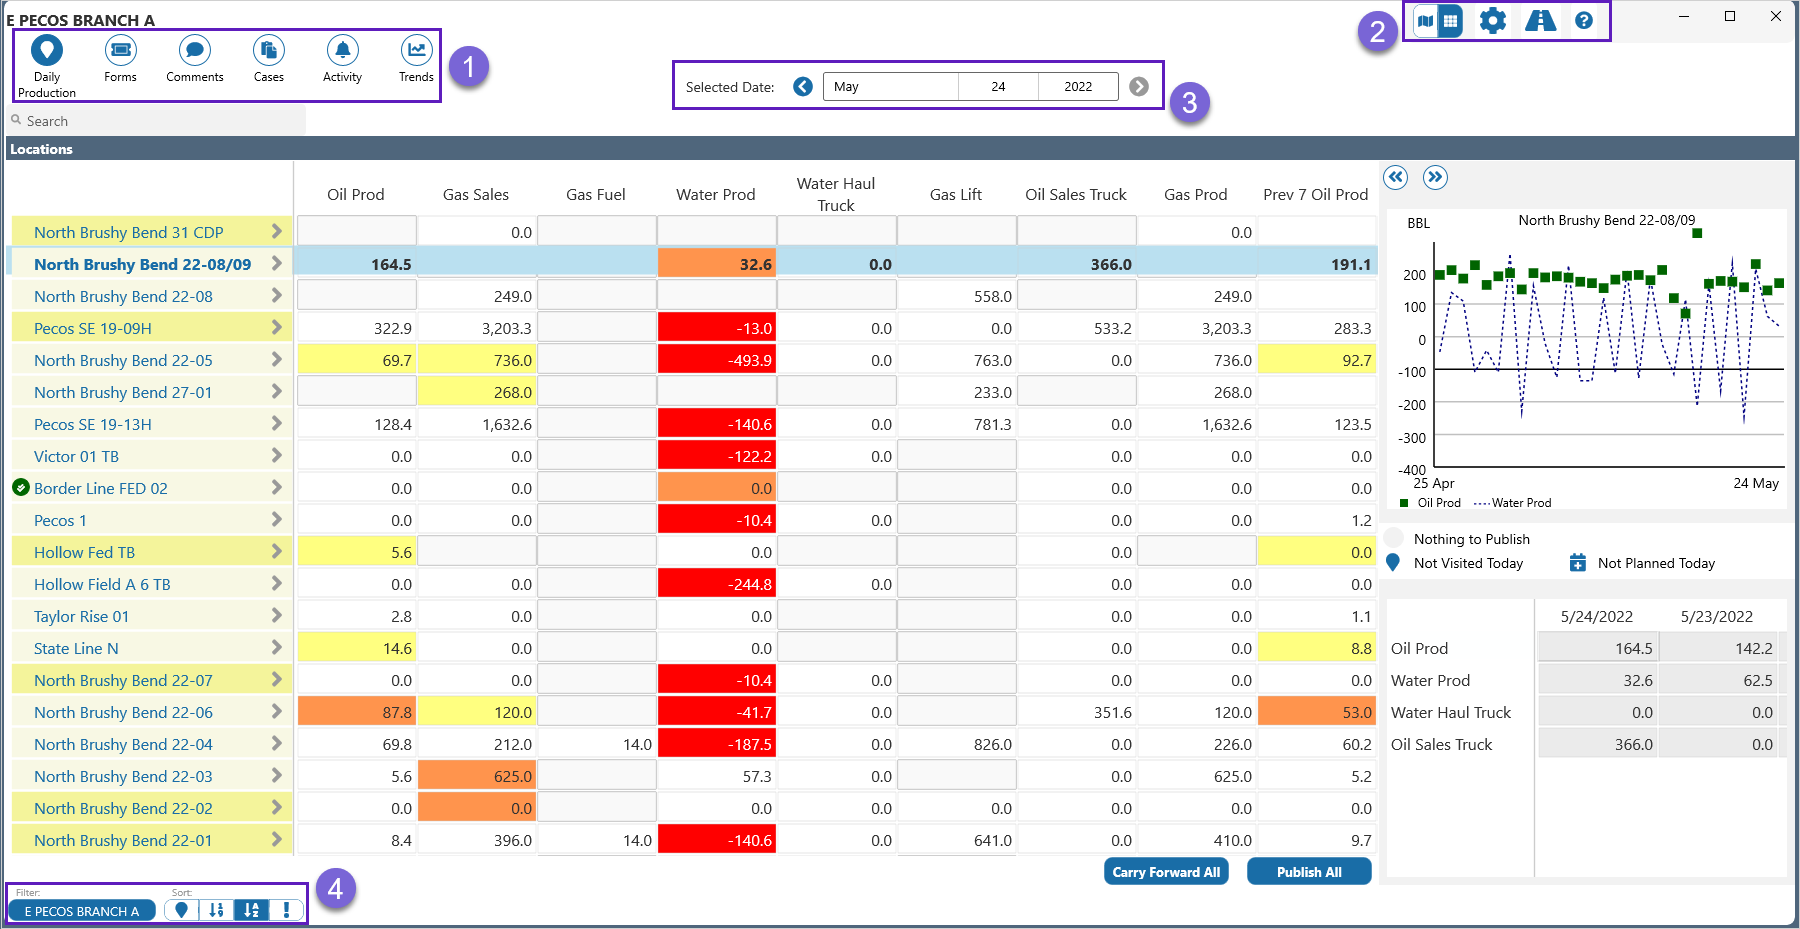
| 1. Navigation Ribbon | This is the main way to access many of the Field Operator options. In the Grid Summary, the ribbon contains the Daily Production (Locations), Forms, Comments, Cases, Activity, and Trends buttons. |
| 2. Toolbar | The Toolbar is found at the top right side of each screen. Use it to access View Mode, Settings, Journey Planner and Help options. |
| 3. Date Selection | Choose which day's production figures you would like to look at. Available when Daily Production is selected in the ribbon. |
| 4. Route Selection | The Filter and Sort functions enable you to select, and organize saved routes. |
The summary data displayed in the Grid Summary reflects the current selection in the Ribbon.
With locations ![]() selected in the Ribbon, Grid Summary view displays daily production totals for the locations on the selected route, and for the route.
selected in the Ribbon, Grid Summary view displays daily production totals for the locations on the selected route, and for the route.
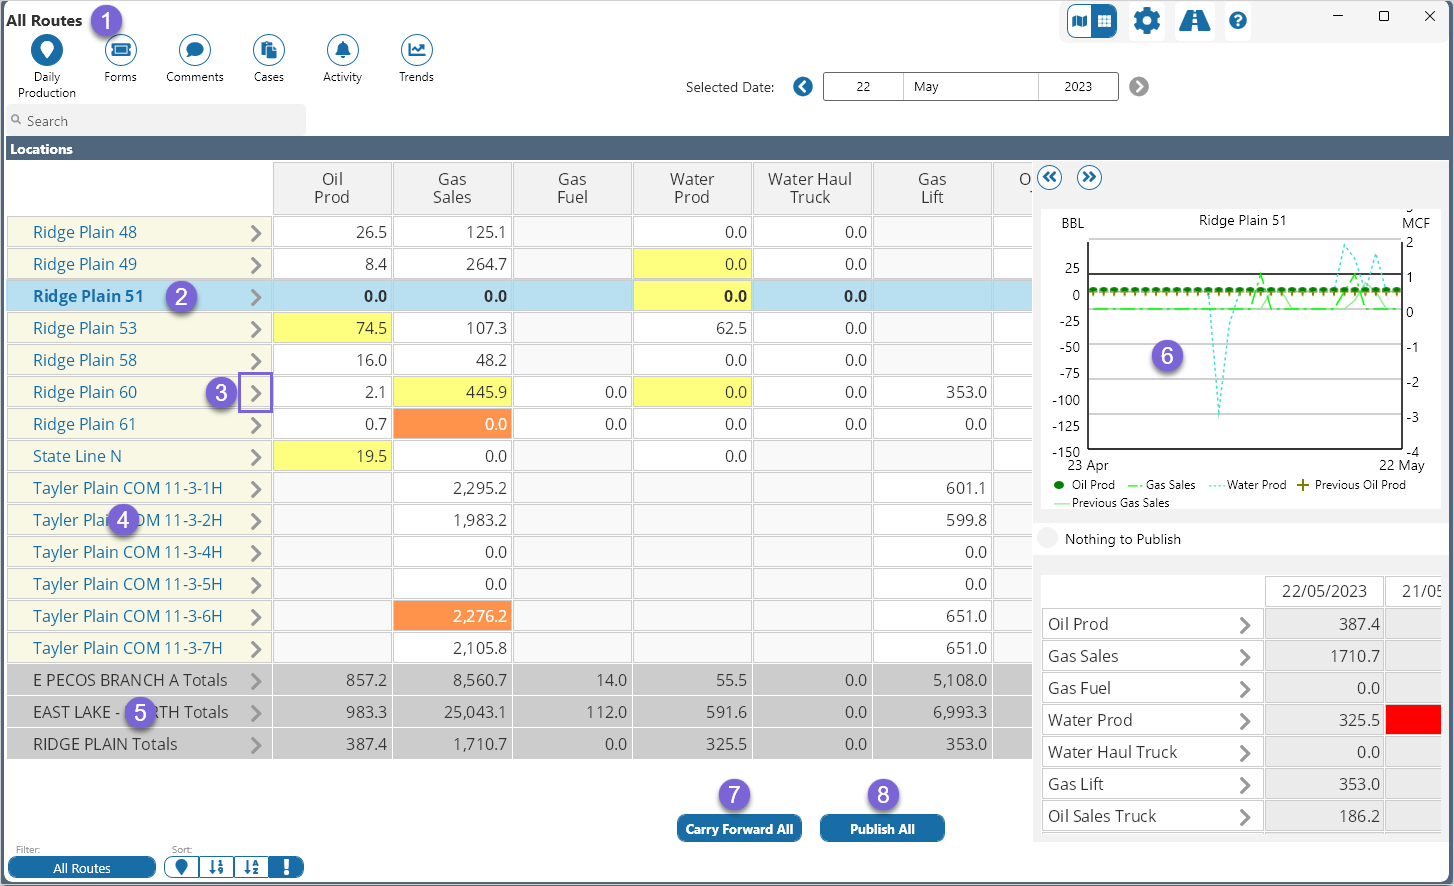
| 1. | Route | The name of the currently selected route if one is selected. |
| 2. | Location | Selected location is in bold text. |
| 3. | Detail | Click on the Detail |
| 4. | Locations | The list of locations in the currently selected route/s. |
| 5. | Route | The currently selected route/s and their totals are displayed at the bottom of the list with a grey background. |
| 6. | Graph | Daily totals graph for the location or route. |
| 7. | Carry Forward All | Copy yesterday's readings forward to today. |
| 8. | Sync Status / Publish All |
Sync Status: Open the Sync Status screen. This is set to Sync Status when Manual Sync Mode is selected in Set Preferences. Publish All: Publish the readings from all locations. This is set to Publish All when Automatic Sync Mode is selected in Set Preferences. |
A graph of daily production totals for the last month, for the selected location or route, can be displayed on the right side of the screen.
The graph is only displayed when a location or route has been selected in the list on the left side of the screen.
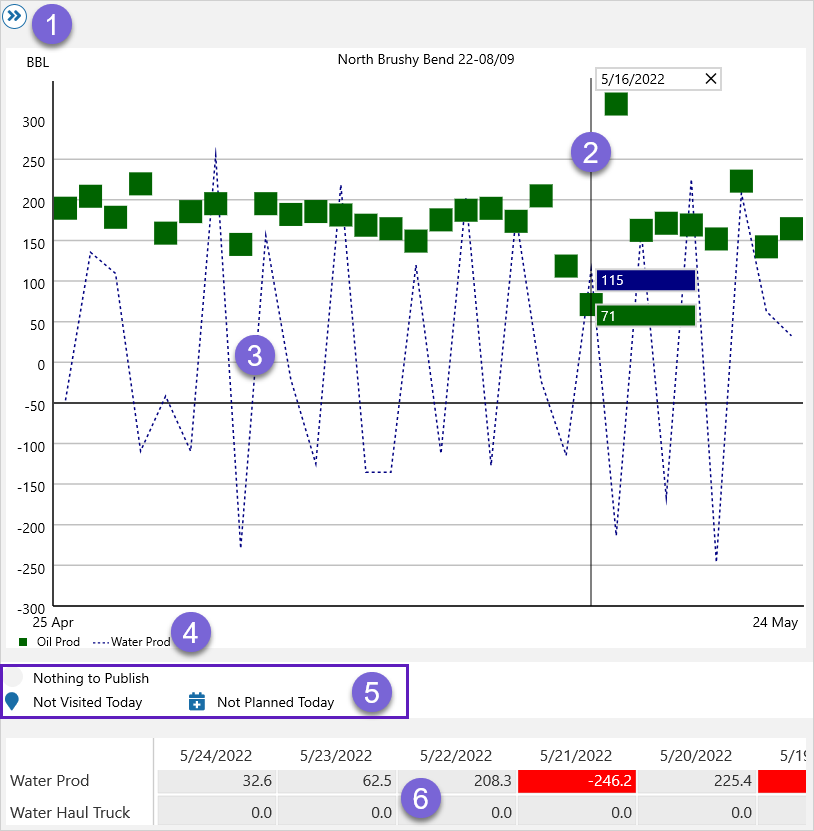
| 1. | Display | Use the left and right chevrons to view the large graph, half-sized graph, or no graph. |
| 2. | Hairline | The hairline displays the exact y-axis value, at a particular point in time. |
| 3. | Graph | Line graph of the daily production totals for the month. |
| 4. | Legend | Click on a label to hide/display the data on the graph. |
| 5. | Status | Publish, visit, and plan status icons. |
| 6. | Totals | Daily totals for the month. |
Release History
- Grid Summary (4.10):
- Route Level Graph
- Grid Summary (4.7)
- Grid Summary (4.6)
- Grid View (4.4)