ON THIS PAGE:
![]()
P2 Explorer 4.4 reinvents P2 Explorer into a prime data visualization tool. It uses new technologies to support cross-browser compatibility and new, sleeker visualizations. Content is key, allowing you to zoom in on and diagnose problem areas, so they can be addressed quickly and effectively.
In P2 Explorer 4.4, elements on a page can interact with other elements on the same page to drive dynamic, information-rich displays, while cross-referencing of data enables further comparison and analysis of related information. An approvals process also allows anyone to submit their own displays for publishing to a wider audience within the organisation.
What sets this version apart from previous releases is the focus on usability. The new data selector makes data-driven pages easier to design, and a set of predefined styles for selected components significantly improves the ability to customise displays.
New Data Selector
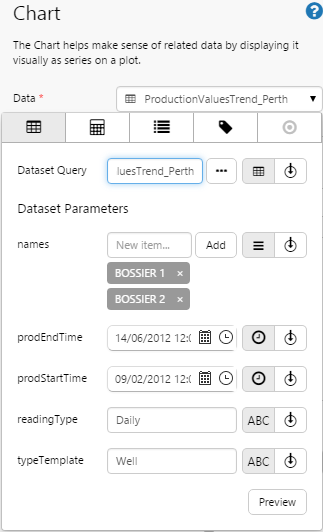
P2 Explorer 4.4 introduces a new, simpler, unified way of adding data to your page with the new Data Selector. This integrates the data selection process into the editor for each component, making it easier to add all types of data, including: datasets, calculations, entities, tags, and fixed values.
| Data Label configured to use data from an entity: | Chart configured to use data from a dataset: |
 |
 |
| Data Label configured to use data from a tag: | Data label configured to use data from an ad hoc calculation: |
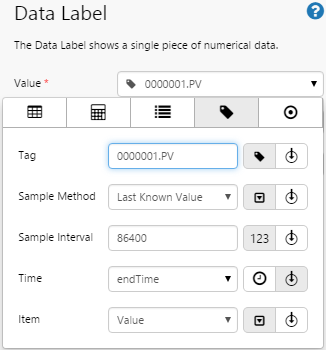 |
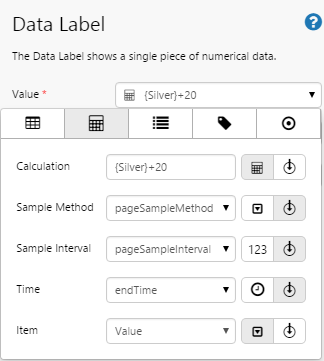 |
Styling
P2 Explorer 4.4 now allows you to apply predefined styles to some components, where appropriate. For example, Text Labels now come with 5 pre-defined styles to bring context to your pages.
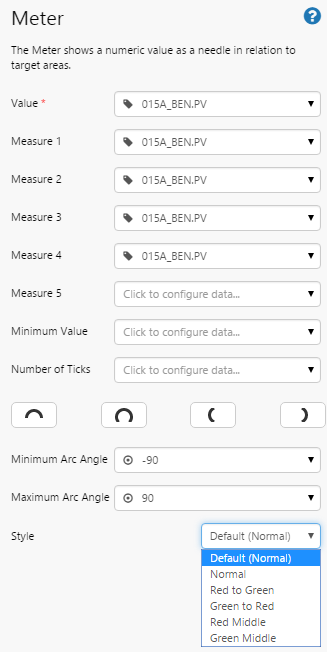
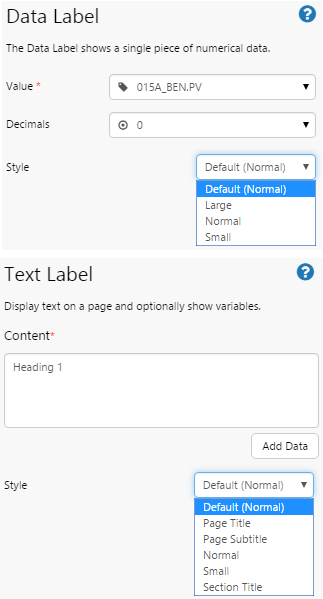
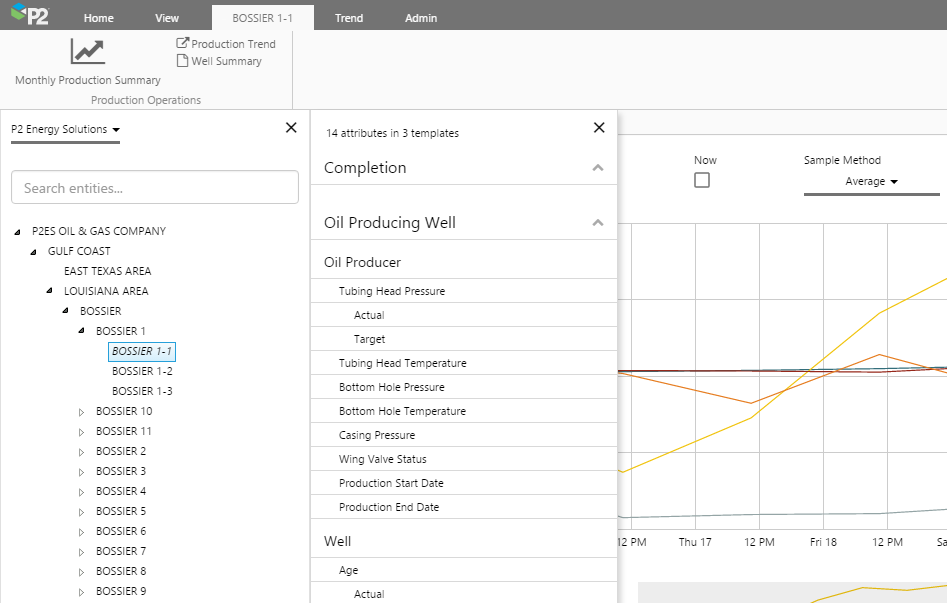
Table of Contents
P2 Explorer 4.4 reinvents the Table of Contents to make it accessible via the ribbon. When you click an entity in the hierarchy, the Table of Contents automatically opens a new tab with the entity’s name and the links that have been assigned to its primary template. Holding the Ctrl key (CTRL+click) while clicking an entity in the Hierarchy Navigator will open the default link (similarly, CTRL+click from the Tags Navigator opens the point details page for that tag).
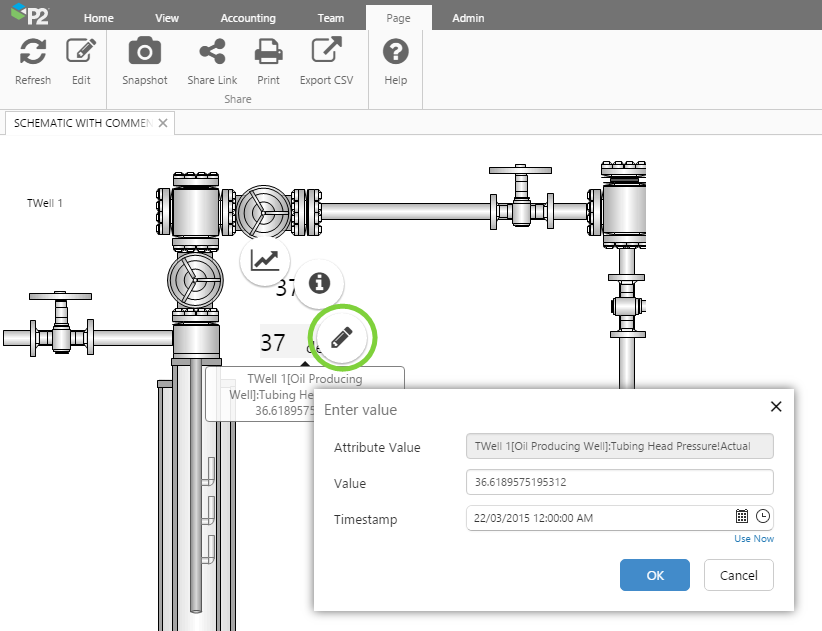
Write Data Support
P2 Explorer 4.4 now supports writing to a datasource, for some tags and attributes. When you click a tag or attribute on a page, you will now see a pencil icon for all tags or attributes that support writing of data back to the data source.
You can change the value for the current time or a date/time in the past.
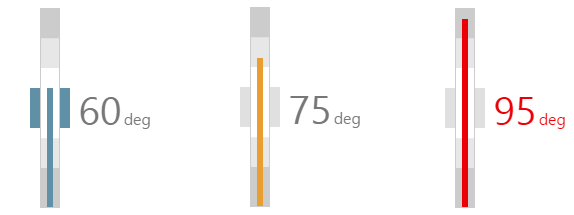
Process Control Shapes - Level Meter
P2 Explorer 4.4 introduces the first of our brand new process control shapes. The first shape is the Level Meter, designed to display a single point of numeric data with configurable alarm thresholds.
These shapes are designed to identify abnormalities in operational process, and draw attention to them when they occur. They follow best practice in data visualisation, with simple shapes and selective use of colour to direct the operator’s attention to critical information.
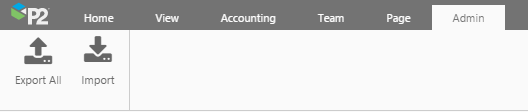
Import/Export
Explorer release 4.4 introduces a new Admin tab in the ribbon, with Import/Export functionality. Administrators are now able to export all pages and trends, useful for archival, backup, and migration purposes.
The export compiles the artefacts of all pages, trends, and cross references, into a .zip file for download. Private workspaces, private pages, and private trends cannot be exported.
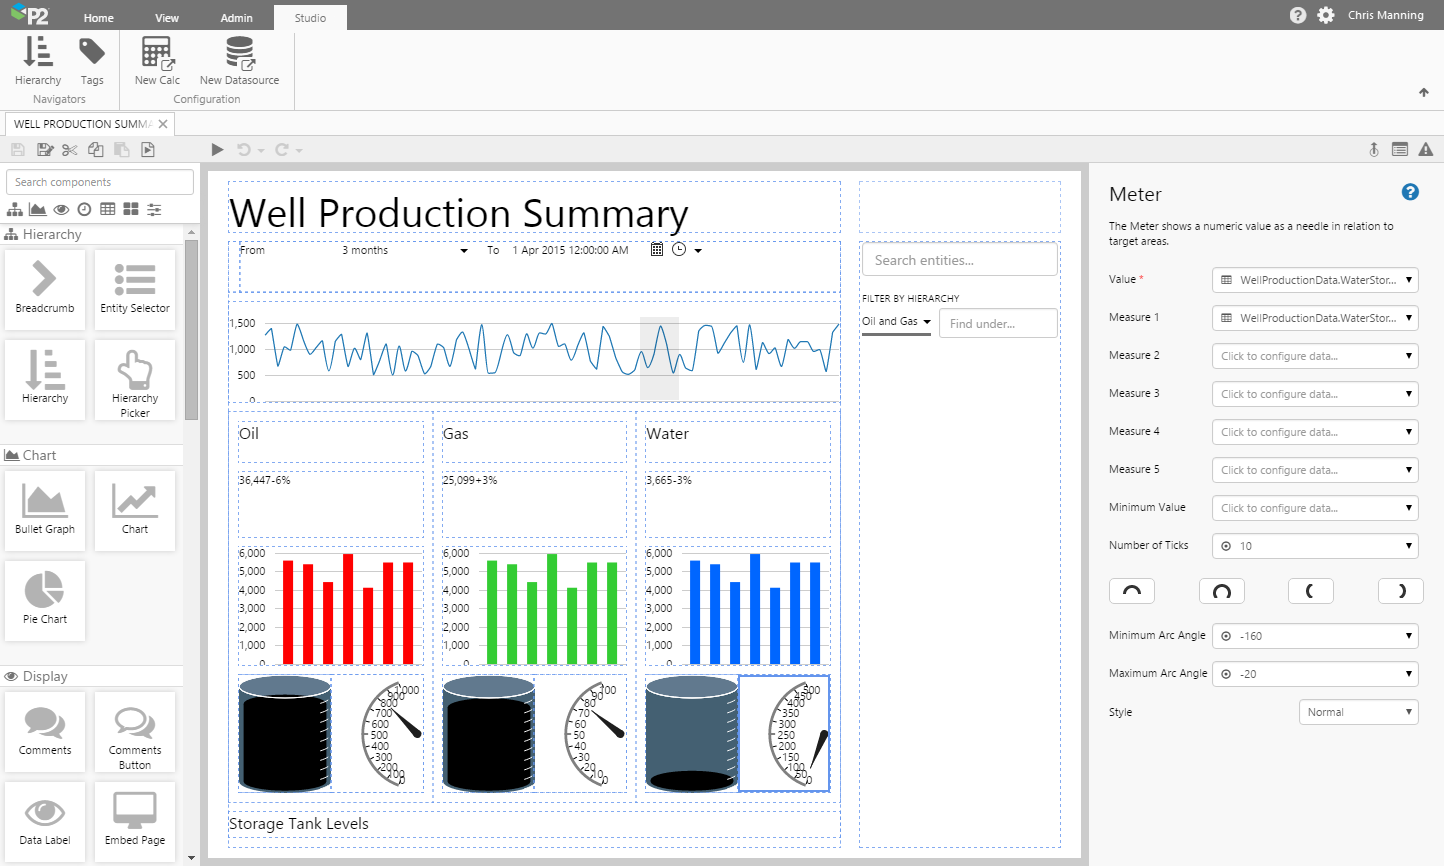
Explorer Studio
Explorer Studio is an easy-to-use page design tool, which allows you to create and edit Explorer pages with ease. As you build a page, Explorer Studio automatically updates the values live on the canvas, showing you in real-time what your page looks like, complete with real data.
Release 4.4.0 improves the usability of Explorer Studio by increasing the size of the canvas and improving the workflow of creating a data-driven page via the new data selector, column drop-downs, and parameter defaults.
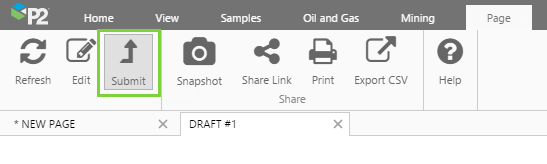
Private Workspaces and Publishing
Release 4.3.2 of P2 Explorer introduced Private Workspaces and a publishing workflow. When first saving a page, pages are saved to My Workspace, which is a private workspace for the logged in user.
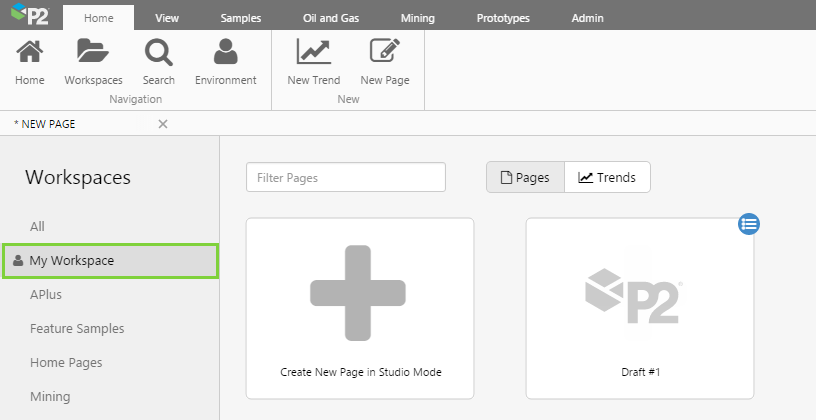
During editing, a page designer may submit the page for publishing to another workspace. A user with appropriate privileges will then be able to review and approve the page.
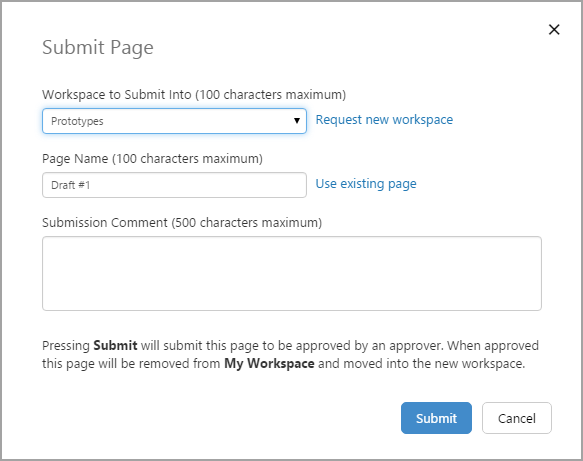
The creation of public workspaces is locked down to users with the Application Role of ‘Explorer Workspace Administrator’. Users who need to create non-private workspaces will need to be assigned to this role in P2 Security.
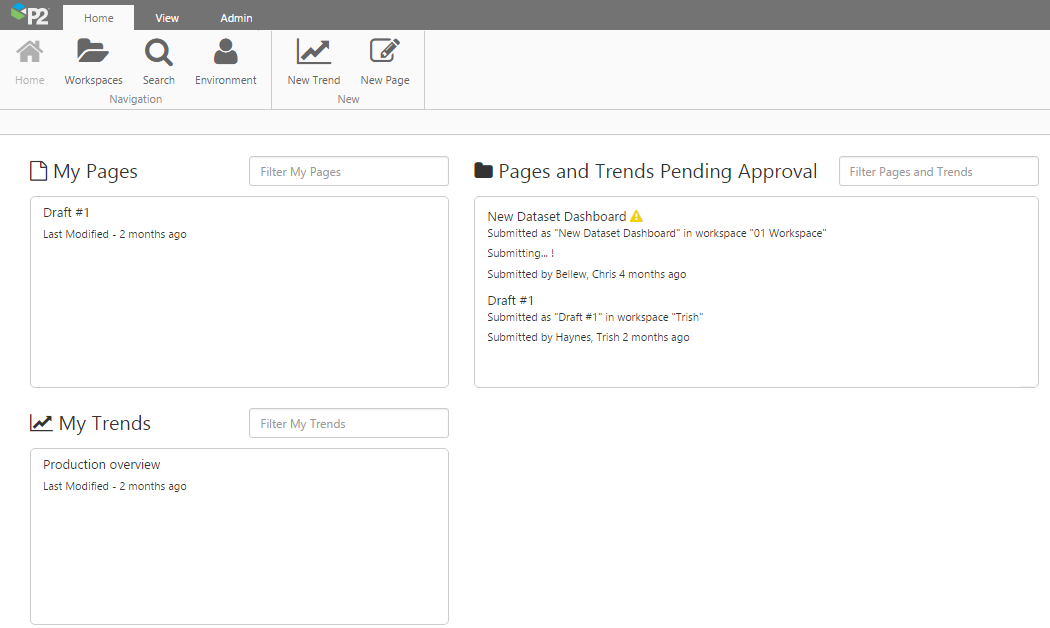
My Environment
Explorer release 4.3.2 introduced My Environment, which shows the logged in user the pages and trends in their private workspace. It also shows pages and trends that have been submitted for approval. If the logged in user has approval privileges, they will be able to approve pages from here.
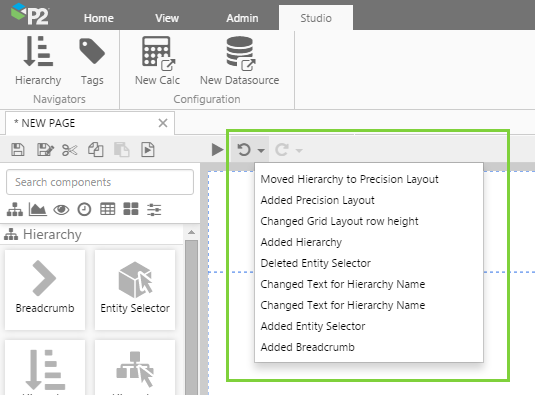
Undo/Redo
Release 4.3.2 of P2 Explorer introduced the undo/redo function in Explorer Studio. When designing a page, familiar undo and redo buttons appear above the canvas. You can undo/redo your last action, or click the down-arrow to undo/redo several actions.
Ribbon
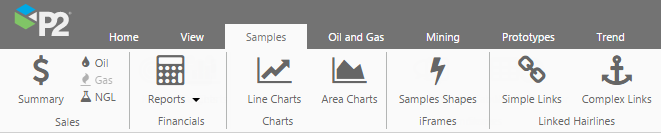
Release 4.3.1 of P2 Explorer introduced the now-familiar ribbon navigation system, resulting in a cleaner, more usable interface.
- The Home tab provides the basic functionality for creating new pages and trends, navigating workspaces, opening My Environment, or searching pages and trends.
- The View tab is the heart of the asset model in P2 Explorer, providing access to the global hierarchy and list of tags.
- The Page tab provides access to functions specific to working with Explorer pages.
- The Trend tab (visible when a trend is open) provides access to all functions specific to working with Explorer trends.
Enhancements to the ribbon continue to evolve at a rapid pace, with the following additions in release 4.4:
- Admin tab
- Table of Contents
Collapsing the Ribbon
You’ll notice a little arrow in the lower right corner of the ribbon. This allows users to collapse the ribbon so that only the tabs are visible. To expand the ribbon, simply click one of the tabs.
Customisation
The ribbon can also be customised, enabling advanced users to add their own tabs and buttons. Note that the default tabs (Home, View, Page, Trend, Admin) cannot be customised.
Diagnostic Trend
The diagnostic trend was one of the most popular features of the earlier versions of P2 Explorer. It provides a full page trend with powerful diagnostic capabilities, such as live addition of tags and attributes, live ad-hoc calculations, hairlines, different sampling, autorange traces, and comments.
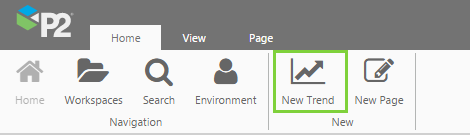
New blank trends can be opened quickly via the quick launch button on the Home tab, and can be shared and saved.
Some of the most popular features include:
- Auto-refresh to ‘Now’: Specify the refresh rate of the page data when you set the time to ‘Now’.
- ‘View’ ribbon group: Show or hide the trend controls (e.g. time range), the range selector (below the trace) and the trace table.
- Trace Table: The trend’s trace table allows you to group tags/attributes on the left and right axes. You can also change the colour and style of the trace.
- Hairlines: The trend allows you to add single, dual, or multiple (up to 5) hairlines.
- Comments: View all comments for an entity, or add new comments.
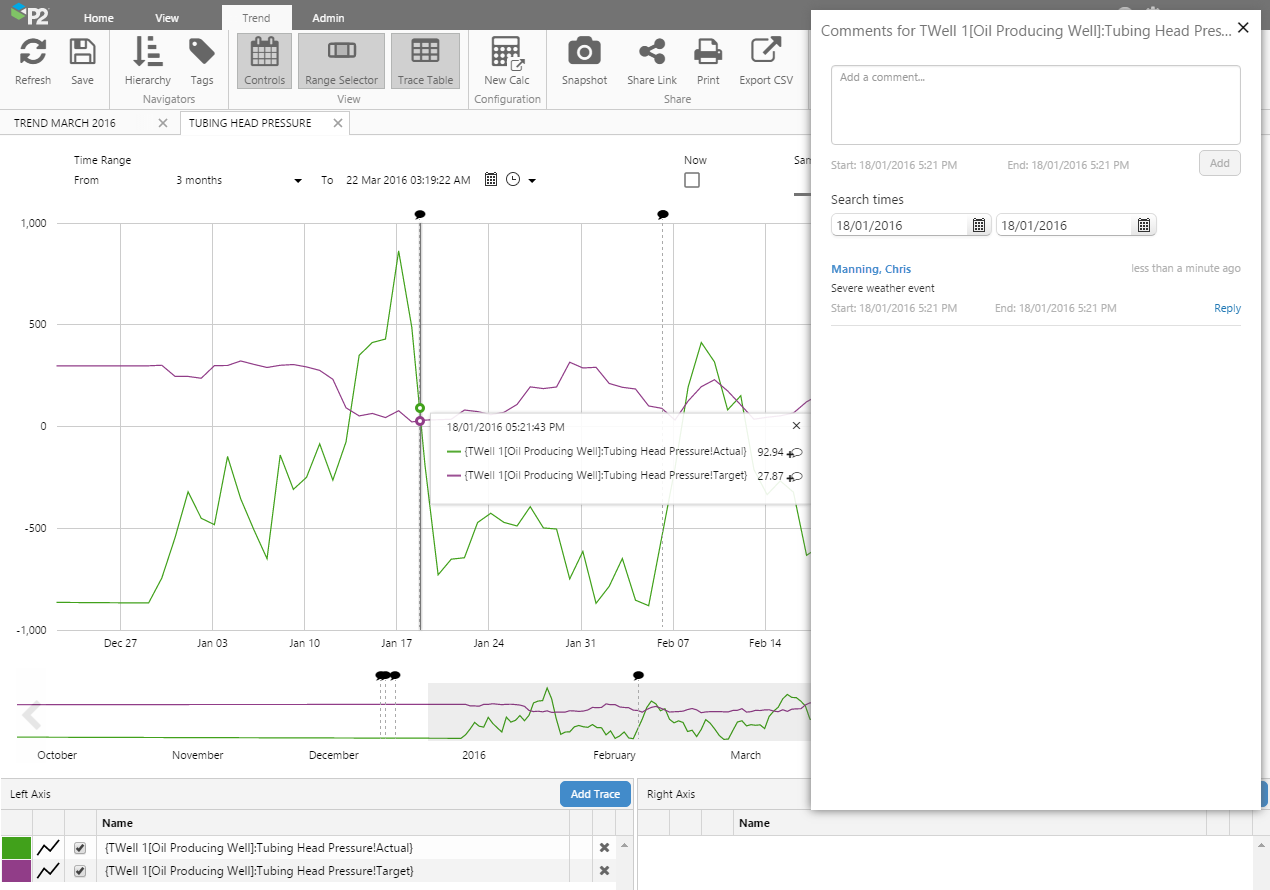
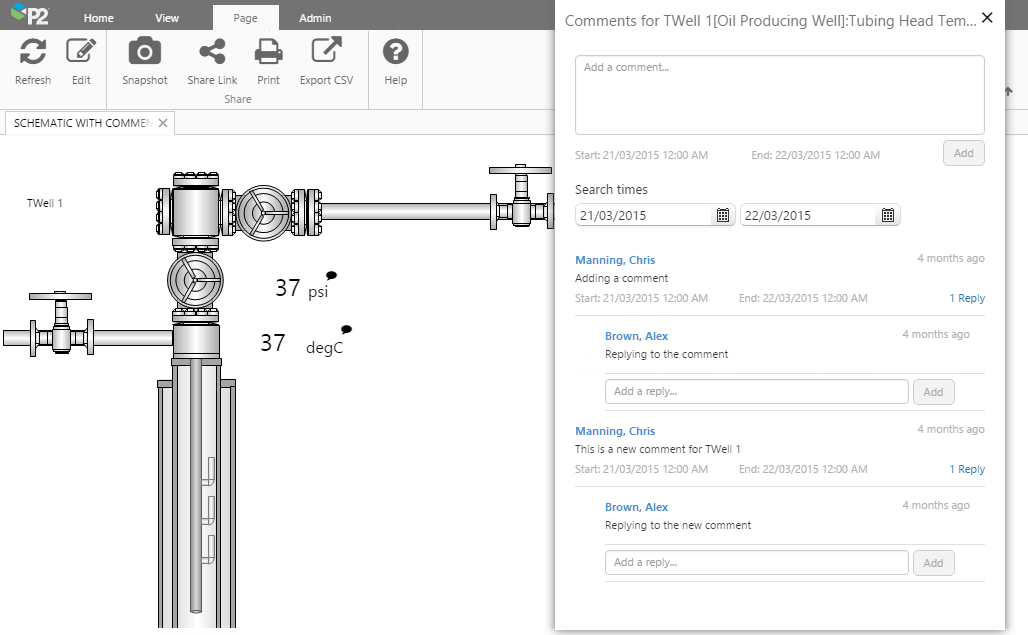
Comments
Explorer harnesses the power of P2 Server’s comments functionality to bring you threaded comments within a page or trend. When comments have been added to a page or trend, a black comments icon appears. You can click this icon to open the comments box.
The comments box allows you to read the comments for an entity, reply to comments, or add new comments. You can also search different time ranges to find further comments of the entity.
Previous Releases