ON THIS PAGE:
- Dual Hairline Statistics on Trend’s Trace Table
- Editing a Calculation from the Trend
- Trend Trace Table Splitter
- Trend’s Export to CSV Format
- Data Error Handling
- Components Showing Digital States
- Two-Dimensional Tank Shape
- Performance Curve Improvements
- Point Detail Changes
- Simple Line Changes
- Data Label Tooltip Changes
- Internal Templates
- Delete Displays Changes
- Performance Enhancements
- Previous Releases
![]()
P2 Explorer 4.5 addresses the need for users to build their own Explorer pages and trends. With the addition of two critical components, the Performance Curve and the Embedded Trend, Studio’s Toolbox has a comprehensive set of controls, enabling you to create the pages that you need, in order to optimise the way you display your data.
Explorer 4.5 offers a more usable Design Mode, and a Display Mode that makes it simpler for users to navigate through the displays, and easier to understand data and trends. Navigation has been streamlined to give a better user experience, allowing users to link to pages, trends or related information on external URLs through hyperlinks or drill-down charts on pages, as well as view a trend or point details of data displayed on pages. Workspaces are easier to work with than before, and the ribbon tabs have been consolidated.
Patch Release 4.5.3 has several new features, including dual hairline statistics, editing a calculation from the trend, and data error handling. There are also several enhancements to existing components, most notably the performance curve. Several issues raised against earlier releases have been resolved in this release.
Dual Hairline Statistics on Trend’s Trace Table
The Trend’s Trace Table has had a change to its Value column. In previous versions of Explorer, the Value column displayed the values for the respective items in the trace window. If the trend had hairlines, then this was the value from the latest hairline that was added or moved; otherwise, it was the value from the end-time of the selected time range for the trend.
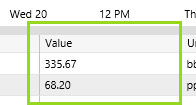
In this version of Explorer, there is still a Value column for the None, Single, or Multiple hairline modes. However, this column changes to a drop-down list of Dual Hairline Statistics options, if the trend is in Dual hairline mode, and if two hairlines are selected.
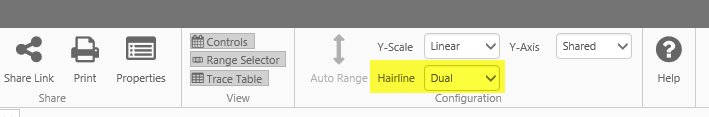
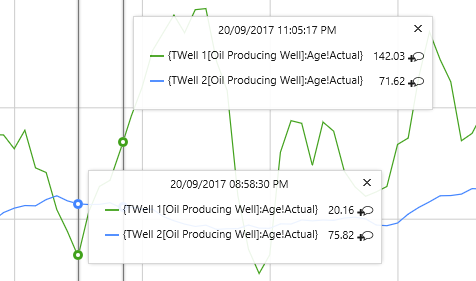
To enable the feature, you need to select two hairlines:
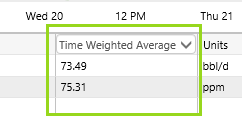
The available options for Dual Hairline Statistics are:
| Time Weighted Average | The time weighted average calculated from the data between the two hairline positions |
| Value Difference (previously shown in the Hairline Information Panel) |
The absolute value difference calculated from the values at the two hairline positions |
| Time Difference | The time difference between the two hairline positions |
| Standard Deviation | The standard deviation calculated from the data between the two hairline positions |
| Min | The minimum value in the data range defined by the two hairlines |
| Max | The maximum value in the data range defined by the two hairlines |
Note: The values in the trace table are calculated using the last known value before each hairline position, whereas the hairline information panel shows the interpolated value at the hairline position.
Editing a Calculation from the Trend
In this version of Explorer, you can now edit a calculation or its description from the trend, where previously you could only save a new calculation.
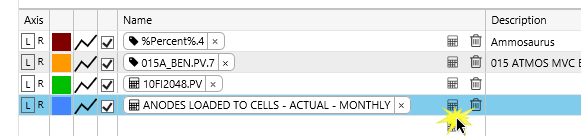
To edit a calculation from the trend, or save to a new calculation, click the corresponding calculator icon in the trace table.
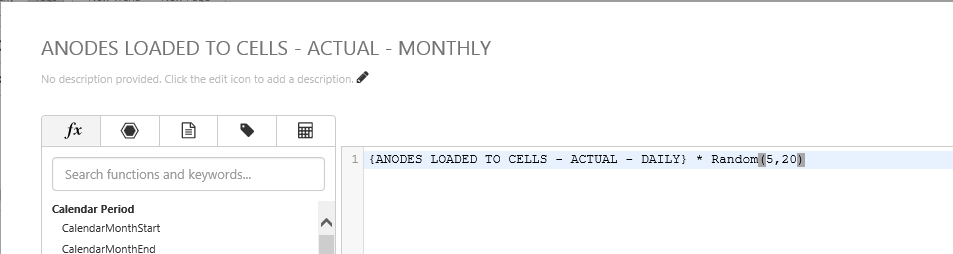
The Calculation Editor opens, to show the calculation.
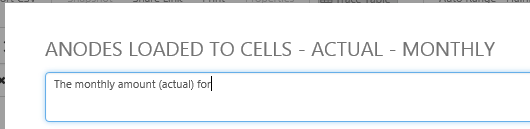
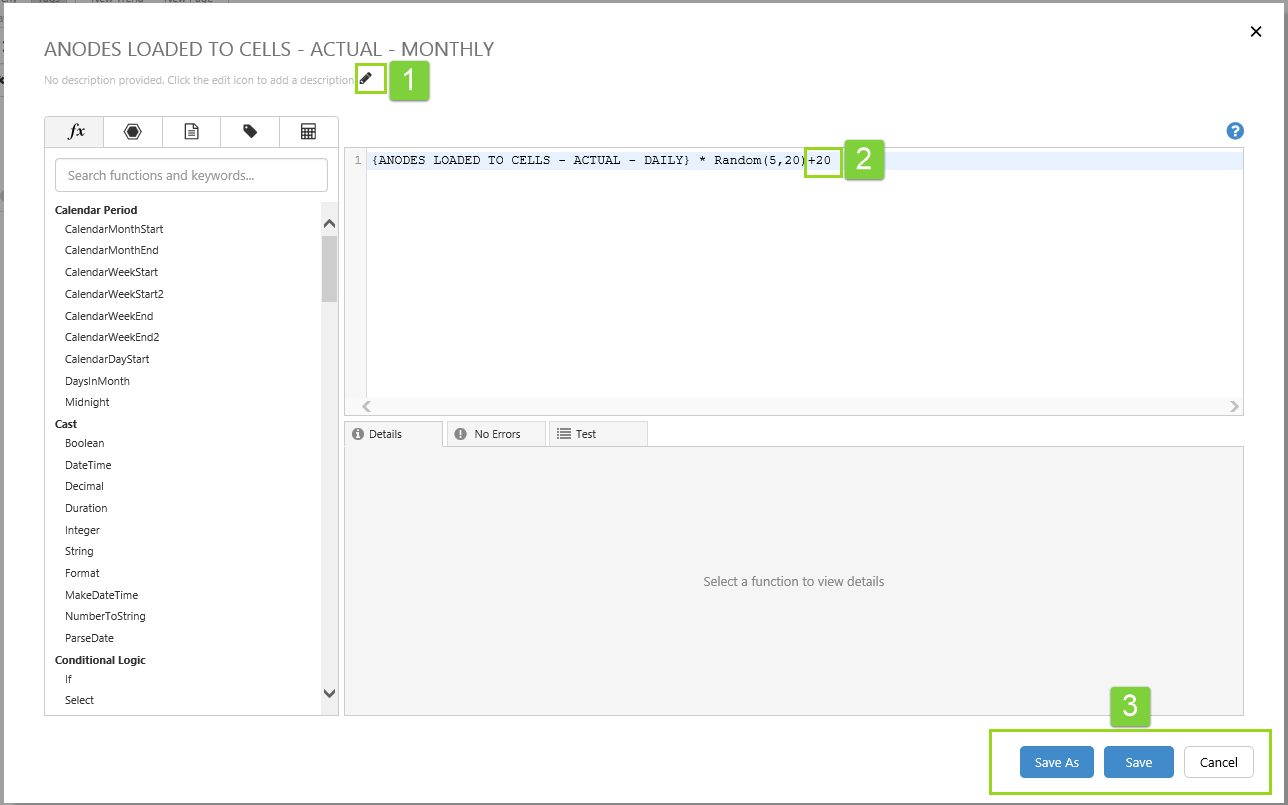
- To edit the calculation’s description, click the pencil icon next to the description, then update the contents of the description edit box which appears below the calculation name.
- Edit the calculation expression in the expression edit box.
- If you edit the calculation or its description, you have the option to save the changes to the existing calculation (click Save), save the changes to a new calculation (click Save As), or click Cancel to exit the calculation editor.
If you cancel, and there are unsaved changes, a confirmation dialog gives you an opportunity to still save the change.
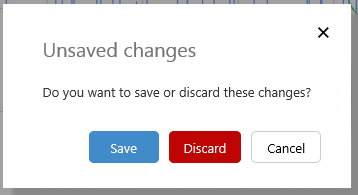
Click Save to save your changes, Discard to discard changes, or Cancel to return to the calculation editor, which still has your unsaved changes.
You can save the unchanged calculation to a new calculation, by clicking the Save As button. This opens a dialog for the new calculation’s Name and Description.
Trend Trace Table Splitter
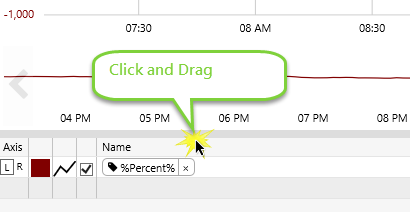
In the Trend, you can now manually adjust the height of the Trace Table. Click the splitter at the top of the trace table, then drag it up or down to increase/decrease the trace table height.
Trend’s Export to CSV Format
The Export CSV function for a trend has changed so that the spreadsheet no longer shows columns for data errors or data confidence.
The data timestamps are now in a format that Microsoft Excel recognises, whereas previously they were exported in GMT. This feature addresses customer requests SF371506 and SF373708.
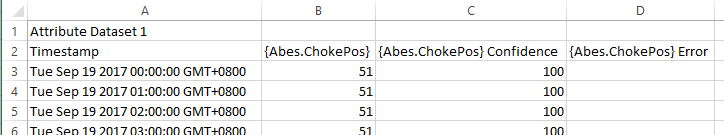
Example of an exported trend, in version 4.5.2
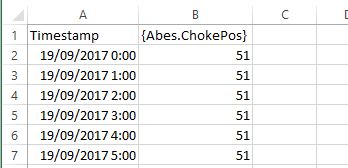
The same exported trend, in version 4.5.3
Data Error Handling
Explorer now shows data errors in design mode and in display mode, and also in a tag or attribute value’s Point Detail page.
For example, if there is a data request for too many data points (exceeding a configured limit), an error is returned. Another example is a data error that is returned when a page component references a data item that does not exist (such as an entity that is not defined in the referenced hierarchy).
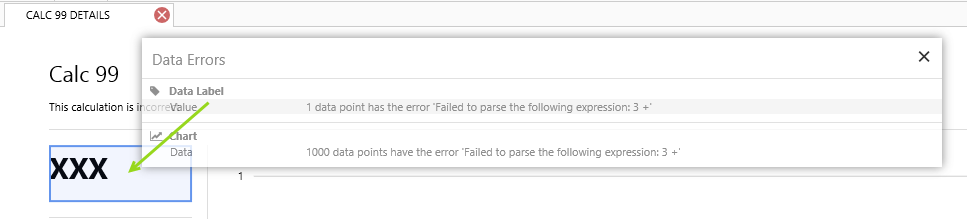
In version 4.5.3, Explorer helps you to identify the data errors and where they are originating within a page, by displaying a list of error items.
Open the Data Errors window by clicking the new Data Errors button on the Explorer ribbon. The button is only enabled when there are data errors on the page.
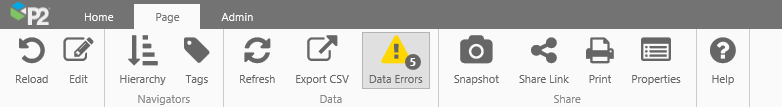
If you are in Display Mode, click the Data Errors button on the Page ribbon tab:
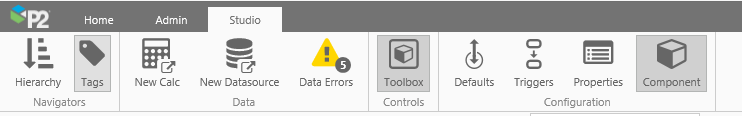
If you are in Design Mode, click the Data Errors button on the Studio ribbon tab:
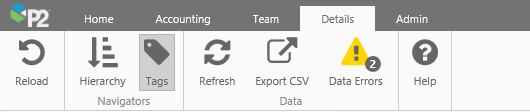
In Point Details, click the Data Errors button on the Details ribbon tab:
Each error item in the Data Errors window contains the name of the component (e.g. Data Label), the property that is experiencing the error (e.g. Value), and a brief description of the error.
Hover over an error item in the Data Errors list; the component that has that particular error is boxed in blue, on the Explorer page behind the Data Errors window.
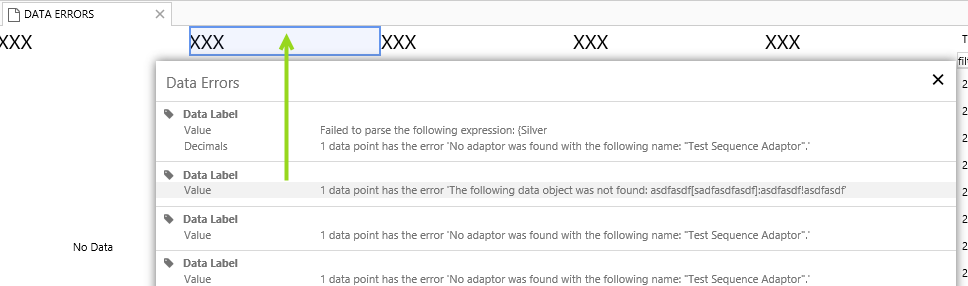
Locating a data error in an Explorer page
Locating a data error on a Point Details page
Components Showing Digital States
Digital State Sets can be defined in Server and then applied to tags and calculations.
Here are some examples of digital state sets:
| Digital State 1 | Digital State 2 | Digital State 3 | |||||
| Name | Value | Name | Value | Name | Value | ||
| Off | 0 | Off | 0 | Off | 0 | ||
| On | 1 | On | 1 | On | 1 | ||
| Open | 2 | Fail | 2 | ||||
| Closed | 3 | ||||||
In this release of Explorer, tags or calculations that are assigned a Digital State Set will display the string value (Name) from the Digital State Set in place of the corresponding digital value (Value) from that State Set, when used in any of the following of Explorer’s page components:
- Data Label
- Text Label
- Status Tile
- Data Table
- Table Layout
For example, a data label’s value is a calculation that has the Digital State 3 digital state assigned. When the calculation returns the value 0, the data label displays ‘Off’. When the calculation returns the value 1, the data label displays ‘On’, and when the calculation returns the value 2, the data label displays the value ‘Fail’. For any other value, the data label displays that value, as there is no matching name in this digital state set.
Two-Dimensional Tank Shape
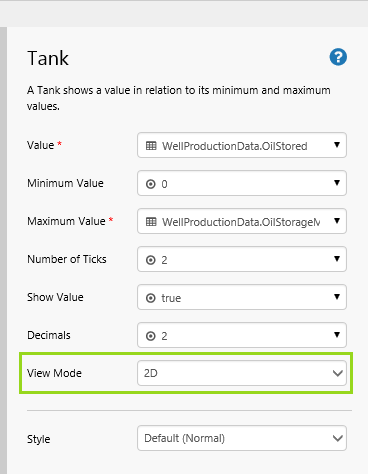
The Tank shape now has a 2D option. When you add a new Tank shape to a page, its default View Mode is 2D. Existing pages with tanks will continue to show these in the original 3D View Mode.
In Studio, you can switch between modes by selecting from the View Mode drop-down list in the Tank’s property editor.
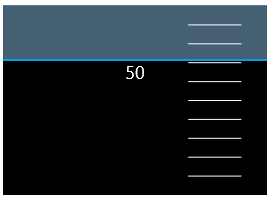 |
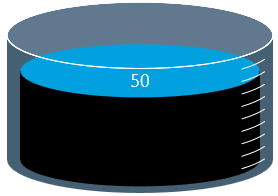 |
| A 2D tank | The same tank, in 3D view mode |
Performance Curve Improvements
The performance curve has had several improvements, making it easier to configure in Studio, and also easier to interpret in Display Mode.
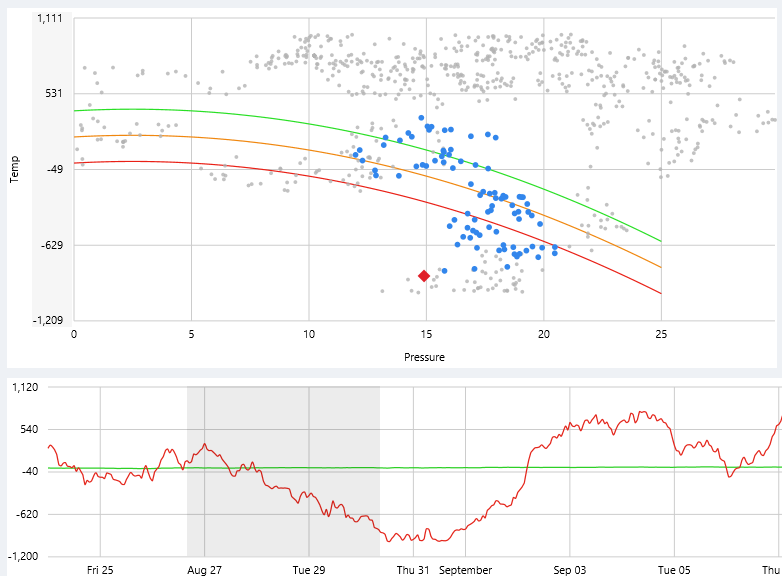
Using the range selector to select a highlight area. Blue highlighted dots are slightly larger than the grey un-highlighted dots. The performance curve also has labels for the Axes.
Improvements to Data Displays
It is now easier to see data on the performance curve. Highlighted dots are a uniform size, now only slightly larger than the un-highlighted dots so that these are not hidden, and the last point of data relative to the end time of the selected highlight range is depicted by a diamond shape.
Highlighted dots are in a different colour to un-highlighted dots, and a separate colour is used for the diamond shape.
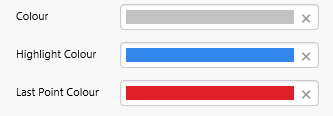
Defaults for Data Appearance
The regular dot size default is 2, and can be configured by adjusting the Radius property.
Colour and Highlight Colour now come with a default colour, and there is a new colour, Last Point Colour, which also has a default and is used for colouring the diamond shape.
X Axis and Y Axis Labels
The X Axis and Y Axis can be named. Each axis now has its own section in the property editor in Studio, for setting the Label, as well as the Min and Max values for that axis (X-Min, X-Max, Y-Min and Y- Max were previously in the main Data section of the editor).
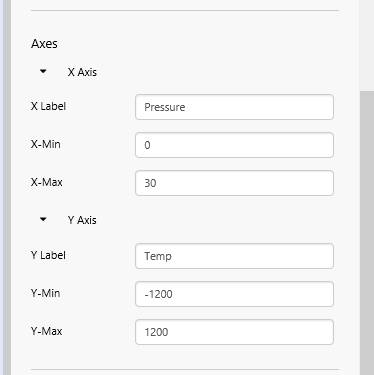
Setting the X Axis and Y Axis properties
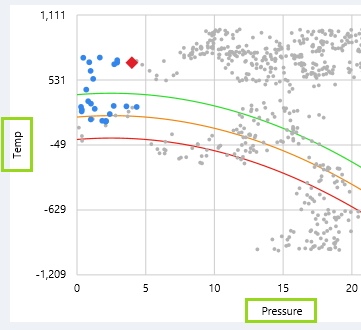
X Label and Y Label
Performance Curve’s Default Data type
In Studio, when defining data for the performance curve, you will notice that the Data selector defaults to Tag data in this version.
Point Detail Changes
When a user opens the Point Details page from a page control, its end time defaults to Now, with a one week duration, whereas previously it would open with the start and end times of the page it was opened from.
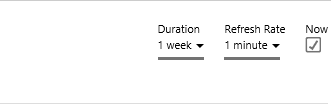
Default period on a Point Detail
The sample interval that is used in the trend now adapts automatically to suit the selected duration, providing a better resolution of the trend. For example, a 2 years duration might use a 12 hours sample interval, while a 30 minutes duration might use a 10 seconds sample interval.
Note that the sample interval cannot be manually set, nor is it shown in the Point Details page.
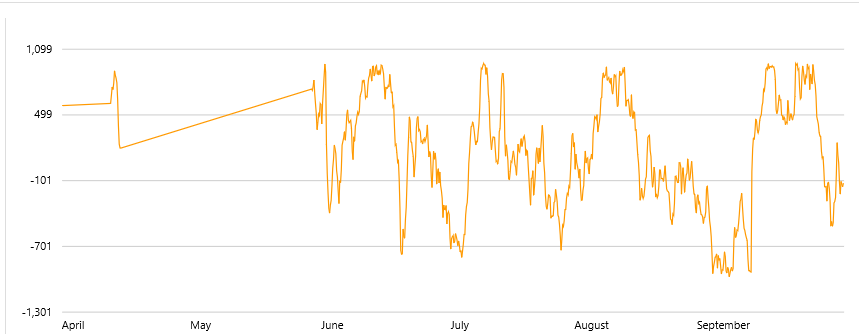
A Point Details trend, with a duration of 6 months
Simple Line Changes
The Simple Line component‘s style has a new property, called Line Style. When defining a style for the Simple Line, Style Administrators can choose from Solid, Dashed, or Dotted. Previously, all lines could only be solid.
In Studio, page designers can choose a style for their simple line, but also have the option to override the Line Style.
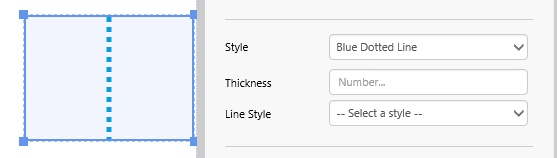
A Simple Line component, configured to use a dotted Line Style
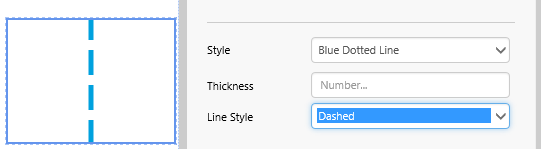
The same Simple Line component, with a Dashed Line Style overriding the style’s Dotted line style
Data Label Tooltip Changes
The Data Label tooltip formerly showed the data label’s definition (for example tag name or attribute value name), as well as its value.
In this release, the value is only shown in the data label itself.
The tooltip shows the data label’s data definition which could be a tag name, a fully qualified attribute name, an ad hoc calculation, or a dataset query name with value column name.
Data labels for tags and attributes show units (where available), as well the description.
Examples of data labels, using different types of data:
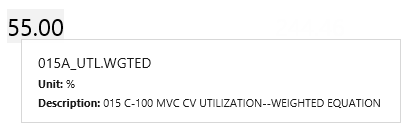
Tag: Data Label with tooltip showing name, units and description
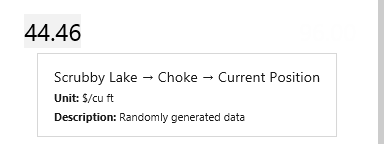
Attribute value: Data Label with tooltip showing fully-qualified name, units and description
Internal Templates
Templates marked as not visible (Internal) in P2 Server are no longer visible in the Attributes Panel for an entity in Explorer’s hierarchy navigator.
In addition, the internal templates do not appear in the auto-complete in a Trend’s Trace Table, or in the auto-complete for a Studio page component’s Attribute data definition.
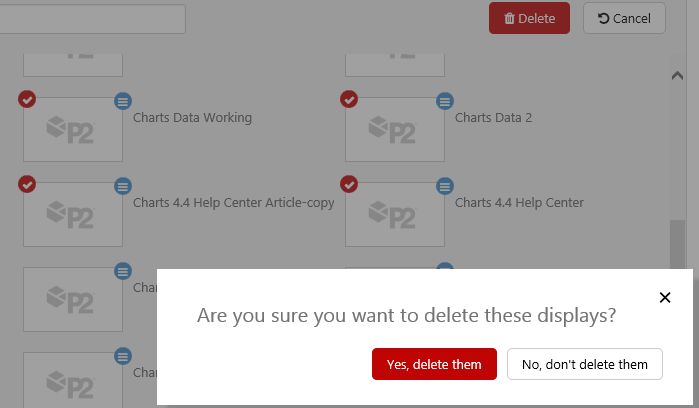
Delete Displays Changes
Users with permissions to edit a workspace can delete trends and pages from that workspace.
The Delete Displays confirmation message is simpler to read now, and selected displays are no longer listed, but remain selected in the background until the confirmation dialog closes.
Performance Enhancements
Further work has been done in this release, to help improve Explorer’s performance. This includes:
- In the trend, limiting traces to a maximum of 20. When a user attempts to add the 21st tag, attribute value, or calculation, they are prompted to first remove trace items from the trend before adding new ones.
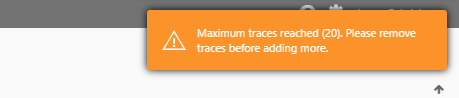
Note that an existing trends with more than 20 traces will keep all of its traces.
- In the trend, data is no longer fetched for the Range Selector, when it is hidden.
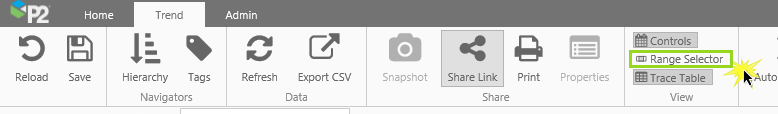
Click Range Selector in the Trend ribbon tab, to hide the Range Selector
- P2 Server now declines data fetches to protect the system, where the calculated or estimated number of fetches is too high. The default limit is 15 000 points per tag, per fetch. A data error appears in Explorer when a data fetch is declined.
Previous Releases
For a complete list of P2 Explorer release notes, see Explorer Releases.