ON THIS PAGE:
- How do I open a trend?
- How many traces can I can add?
- Can I drag and drop multiple items?
- How do I maximise my trace window?
- Can I see the raw points within the selected range?
- If I have an Explorer trend open, with the Now option checked, how often will the trend refresh?
- How can I see comments?
- What does an error look like?
- How do I create a templated trend?
- Can I create a calculation?
- Are there any keyboard shortcuts?
- How do I export a trend to CSV?
- How do I save a trend?
- Can I store information about the trend?
- Can I zoom into an area of the trace window?
- Can I view tag or attribute details from a trend?
An Explorer trend displays a time range of time-series data, such as tags, attributes, and calculations as a chart, with each tag or attribute displayed as a separate trace.
How do I open a trend?
Some trends are already configured, while others are new, blank trends. There are several ways to open a trend:
- Click the New Trend button on the Home ribbon tab (see Explorer Ribbon).
- Open a new or existing trend by clicking on a specially configured Hyperlink, Hotspot or Status Tile on a page.
- Open an existing trend from any of the Workspaces, using the Trends tab (see Explorer Workspaces Tour).
- Open a trend from a URL (see Link to a Trend via a URL).
- Open a trend from a Point Details page (see Point Details).
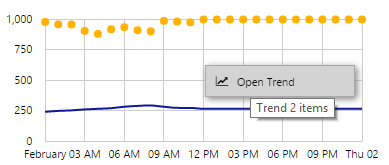
- To trend an attribute value or tag that is already on a page, right-click on the page control, such as a level meter or a data label, and select the Open Trend option from the menu.
- To trend several series (for tags, attribute values, or calculations) from a chart or an embedded trend, right-click the chart and select Open Trend from the menu.
How many traces can I can add?
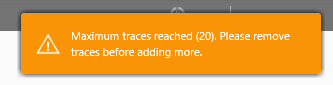
You can add up to 20 traces to a trend. When you attempt to add the 21st tag, attribute value, or calculation, you are prompted to first remove trace items from the trend before adding new ones.
Here are some tips on managing several traces on a trend:
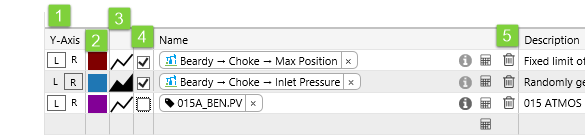
[1] Axis: Make use of the two Y axes (Left Axis and Right Axis), by grouping trace lines belonging to similar items or those that are within a similar range into either the Left Y-Axis (L) or the Right Y-Axis (R)
[2] Colour: You can change the colour of a trace to make it stand out, or make it more opaque. To change the trace colour, click to open the colour wheel, then select a colour or choose a custom colour where you can also set the opacity.
[3] Style: To change the trace style, click to open the style wheel, then select from Line, Area, Dot, Step Before, and Step After.
[4] Visibility: You can hide a trace, by deselecting the check box to the left of the trace name.
[5] Remove: Click the trash ![]() icon to remove the trace from the trend.
icon to remove the trace from the trend.
Can I drag and drop multiple items?
Each item needs to be individually added to a trend. You can either drag an item directly onto the Trace Window, or you can add it to the Trace Table. This is what you can add to a trend:
- Tags: These can be dragged in from the Tags Navigator, or manually added to the Trace Table.
- Attributes: These can be dragged in from the Hierarchy Navigator, or manually added to the Trace Table.
How do I maximise my trace window?
You can maximise the Trace Window by toggling off the following buttons:
- Analysis: Hides the Analysis panel on the left.
- Range Selector: Hides the Range Selector below the Trace Window (this is hidden by default).
- Controls: Hides the dates ranges, sample method, and sample interval options.
- Trace Table: Hides the Trace Table at the bottom of the window.
- Info: Hides the Info zone on the right.

Can I see the raw points within the selected range?
Yes, if you select the Raw Sample Method. Because each data point is returned, you should limit the trend time range, using the Trend Controls, so as not to compromise performance.
If I have an Explorer trend open, with the Now option checked, how often will the trend refresh?
When you select Now, the trend end time is the current time. This refreshes at the Sample Interval rate (with 30 seconds as the lowest refresh rate). You can also click the Refresh button on the ribbon for an immediate refresh.
How can I see comments?
To see all comments for a particular tag or attribute value on a trend, you can click on the trend to view a hairline, and then click on the Add Comment ![]() icon in the tag or attribute value's hairline info box. The Comments panel opens, and you can change the dates in this, to search for comments. Any comments within that period will appear in the Comments Panel.
icon in the tag or attribute value's hairline info box. The Comments panel opens, and you can change the dates in this, to search for comments. Any comments within that period will appear in the Comments Panel.
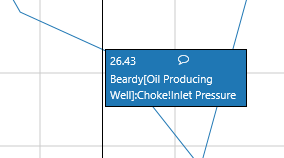 Comment Icon on an attribute value's Information Box, on a hairline
If a comment exists within the trace period, for one of the trace items, this is marked by a comment marker ![]() which you can click to view the comment. The comment marker matches the trace colour.
which you can click to view the comment. The comment marker matches the trace colour.
Comment Marker
What does an error look like?
Trace items with an error show an error icon in the notifications column.
![]()
Hover over the error icon to view the error message.
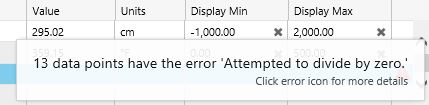
Some examples of data errors that could affect a trend:
- No data for this timestamp
- Historian returned an error data point
- Calculation error for this data point
- Low confidence value falls below a threshold specified in P2 Server
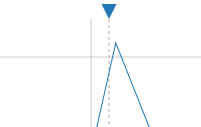
Note: Explorer will only draw a line trace if there are at least 2 valid data points to draw a line between.
How do I create a templated trend?
A templated trend allows you to use the Hierarchy Navigator to change the entity for an attribute displayed in the trend. You can create a templated trend by using the entity keyword in place of an entity name, when specifying an attribute for a trace. E.g. {entity[Water Injection Well]:Injection Rate!Actual}
Can I create a calculation?
Yes, you can create a calculation by saving a calculation from the calculation editor. Note that this requires Calculations Edit privileges in Security.
Are there any keyboard shortcuts?
Yes. When you have focus in the trace table, you can use any of these keyboard shortcuts:
- Arrow Keys: Use the up and down arrows to select a new item in the trace window. If you are editing the Display Min or Display Max of a trace item, use the up and down arrows to increase/decrease by 1.
- Delete Key: Remove the selected trace from the trend.
- Esc Key: Cancel out of whatever you are editing.
- Spacebar: Toggle between showing and hiding the selected trace item.
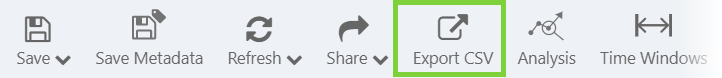
How do I export a trend to CSV?
In the toolbar above the trace window, click the Export CSV button to export the data. Data errors are not included in the export.
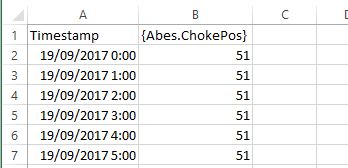
Time range, sample method, and sample interval all determine what data is fetched. This is the data that is then exported. So if, for example, the Adaptive Raw sample method is selected, the trend will only export the rendered data, not all of the raw data.
Here is an example of an exported trend's .csv file:
Save As
How do I save a trend?
There are two buttons on the Trend ribbon for saving trends.
- The Save button has 2 options available in a drop-down list: Save is used to save to the current trend name and workspace. Save As is used for saving the trend to a specified name and workspace.
- The Save Metadata button is only active if you have added Tag data to the trend. If you have appropriate privileges, clicking this button allows you to save changes to the description, units, min, and max values for the tag.
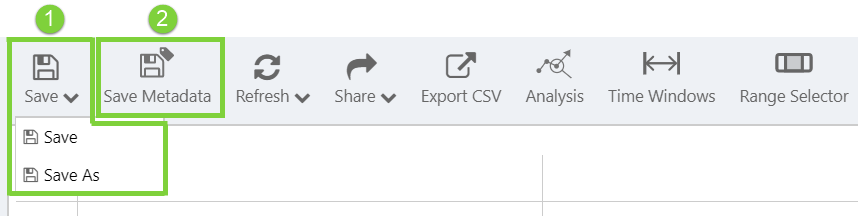
Notes: (1) There is no confirmation dialog for the Save buttons. (2) Versions prior to 4.5.4 only have the Save button. (3) The Save Metadata button was introduced in version 4.9.
Can I store information about the trend?
Yes, in version 4.6 and later you can store the information for any trend, in the Knowledge Management section of the trend's Display Information.
Open the Display Information panel by clicking the Info button on the trend toolbar. For unsaved trends, this button is disabled

Can I zoom into an area of the trace window?
Yes, the Zoom feature is available in version 4.6 and later.
Can I view tag or attribute details from a trend?
Yes, in version 4.6 and later the trace table has an info button for each tag and attribute value, which you can click to open the Point Details page for that item.