Overview
The embedded trend component includes most of the functionality of the Explorer Trend. It is used when a trend is needed on an Explorer page, and can be opened as a full page trend if access to all of the trend features is required.
Using the embedded trend component saves on browser resources and offers an integrated experience with the rest of the Explorer page, compared to embedding an Explorer trend on the page.
Traces can be added to an embedded trend in the configuration and in the display mode, but can only be saved as part of the trend when added in the configuration.
Quick Start
You can add an embedded trend to a page with no configuration whatsoever - simply drag and drop it onto the canvas and save the page.
Configuration
The default configuration can be customized to suit your application.
| 1. |
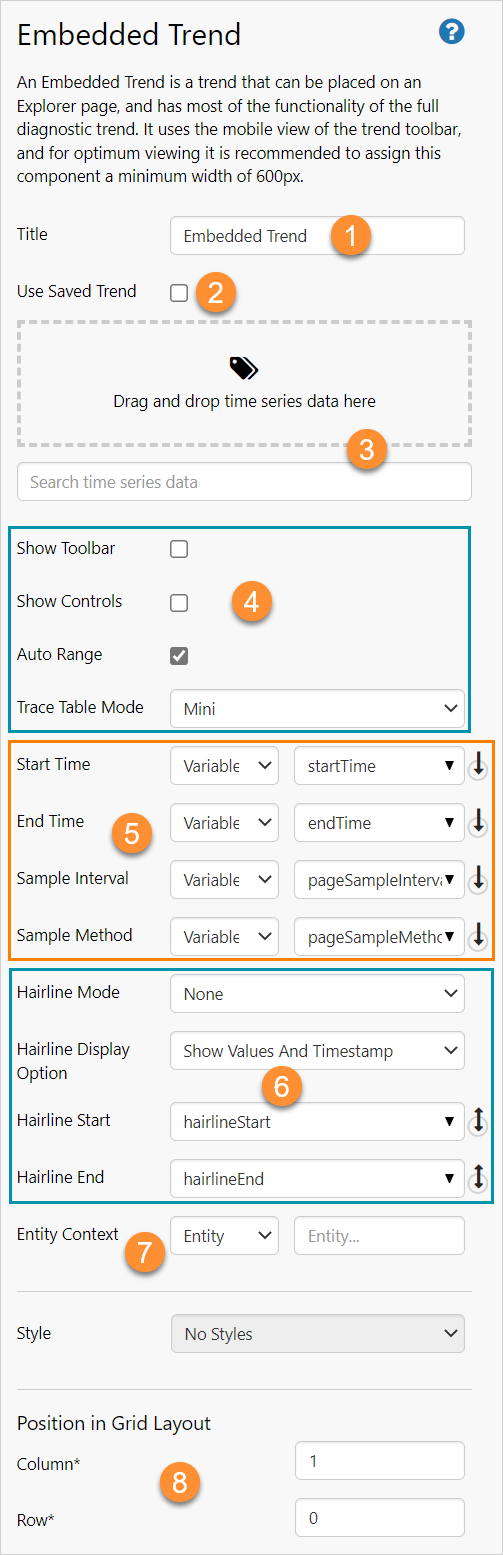
Embedded Trend Title Add an optional title to the trend. |
 |
|
| 2. |
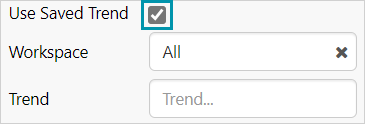
Saved Explorer Trends Select Use Saved Trend to embed a saved full page trend onto the page.
Note: Embedding a saved trend uses more browser resources and reduces performance and page integration options. |
|
|
| 3. |
Trend Data Data can be added to an embedded trend in Design Mode and Display Mode. Either drag and drop tags and attributes from from the Tags or Hierarchy Navigators, or search for data in the Search box. |
|
|
| 4. |
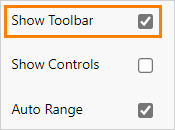
Trend Appearance Set Toolbar, Controls, Auto Range and Trace Table display options. If Auto Range is selected in the configuration, it is automatically applied to each trace that is added to the chart. This applies to traces added in the configuration and in display mode. The Toolbar, Controls and Trace Table display options can also be selected in display mode. |
|
|
| 5. |
Data Sampling Start Time: The start of the trend range. The default value is the page default for startTime. |
|
|
| 6. |
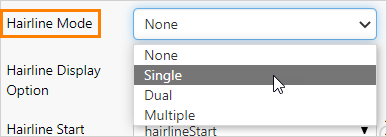
Hairline Mode: The number of hairlines allowable on the embedded trend (Single, Dual, Multiple or None). The default is None. |
|
|
| 7. |
Entity Context Set the Entity Context if you have an ad hoc calculation as part of the embedded trend data. selectedEntity will update for the selected entity on the Hierarchy Navigator, if you open the page from the entity's Table of Contents ribbon tab. |
|
|
| 8. | The top left cell of a page is specified as Column 0, Row 0. |
Embed a Templated Trend
To use a Templated Trend as the Saved Trend:
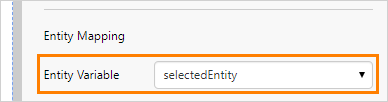
1. Set the Entity Context in the embedded trend configuration to Variable and choose a variable
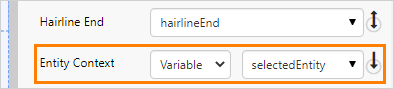
2. In Page Properties under Entity Mapping, select the same variable as above
Tutorial
If you're unfamiliar with the process of building pages, read the article Building an Explorer Page.
In this tutorial, we'll add an embedded trend to a page in Studio, add a trace from a navigator, and configure the trend to show the toolbar, and to have the option of adding a hairline.
Step 1. Prepare a Studio Page
To start, click the New Page button on the Home tab of the ribbon. Choose the Grid layout.

Step 2. Add an Embedded Trend
Drag and drop the Embedded Trend component onto a grid cell. The Embedded Trend is in the Chart ![]() group.
group.
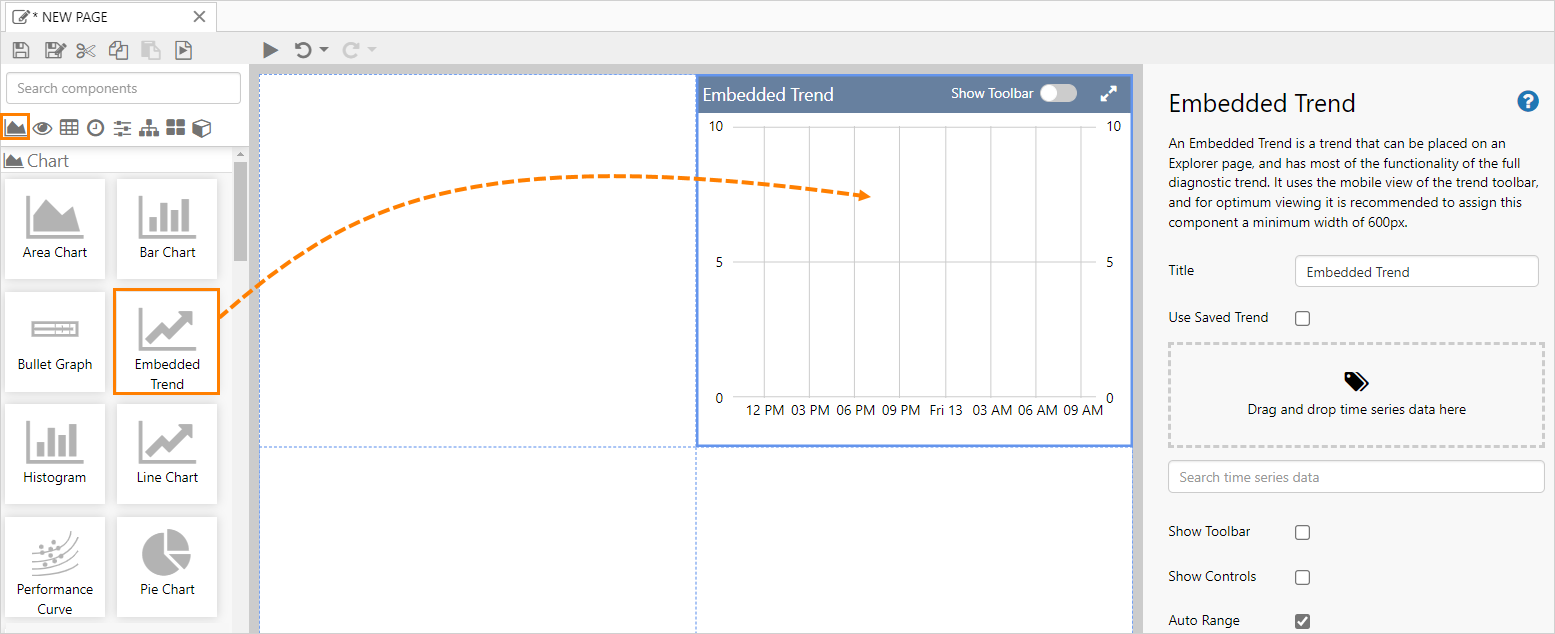
The page can now be saved and used with the default values and configuration.
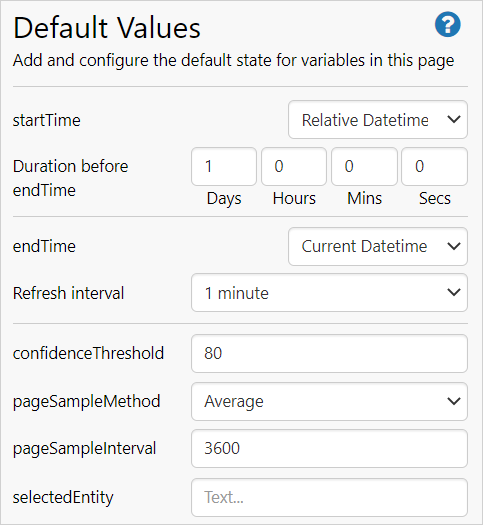
Default values:
Step 3. Configure the Embedded Trend
To add a trace to the trend from a navigator:
1. Click Hierarchy on the shortcut menu to open the Hierarchy Navigator.
2. Select a hierarchy and an entity.
3. Open the Attributes Panel and click on the required attribute.
4. Drag and drop the attribute value onto the data panel and close the hierarchy navigator.
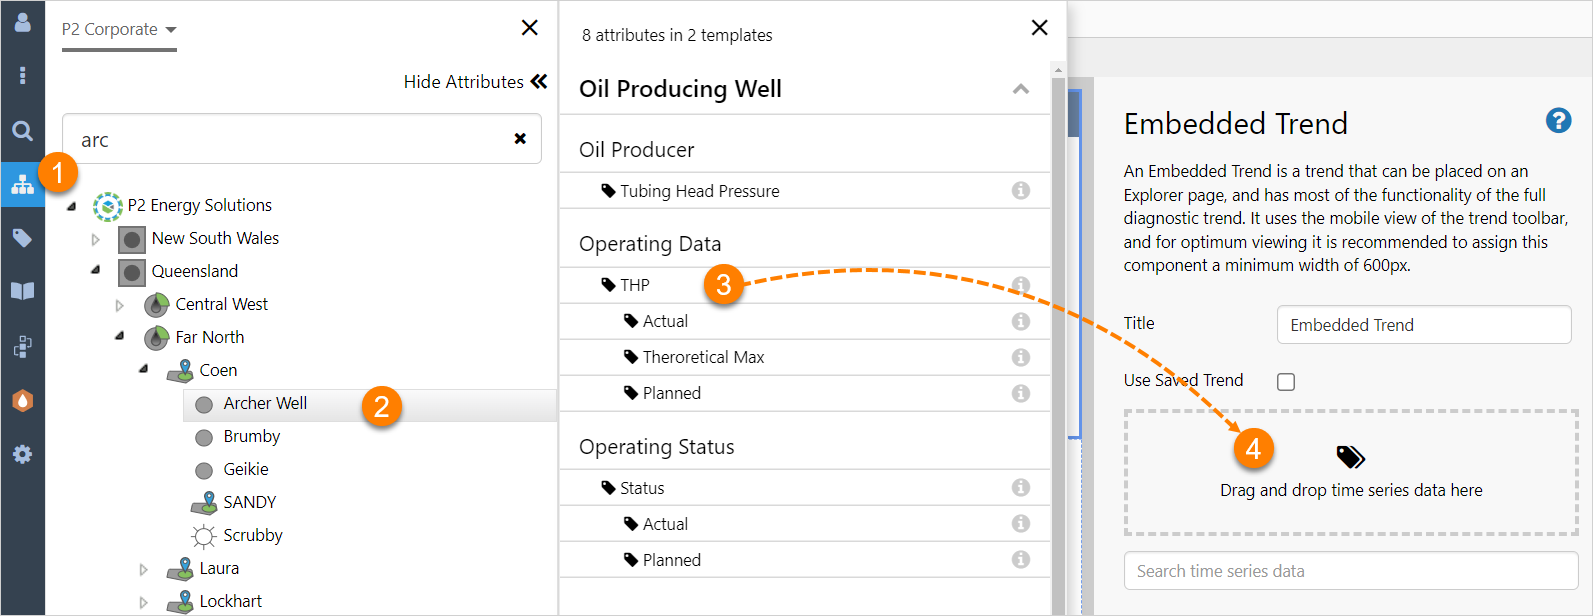
Follow the same steps using the Tags Navigator, to add a tag to an embedded trend.
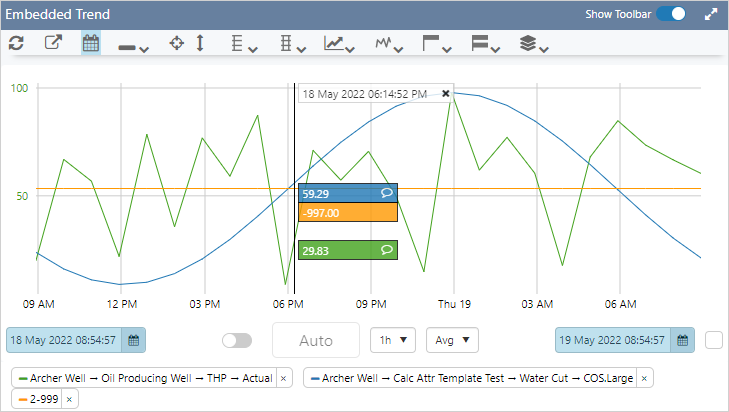
Select Show Toolbar to in the configuration to display the toolbar.
Open the Hairline Mode dropdown menu and select Single to enable the ablility to add a single hairline to the trend.
Step 5. All done!
Congratulations! You now have an Embedded Trend showing an attribute value and the Toolbar, and to which you can add a hairline.
- Click the preview
 button on the Studio toolbar to see what your page will look like in display mode.
 - Select different options from the Toolbar and observe the changes in the embedded trend.
- Click on the trend to see a hairline.
![]() Remember to save your page!
Remember to save your page!
Release History
- Embedded Trend 4.10.2 (this release)
- More of the full page trend functionality included
- Mini trace table option
- Toggle toolbar display
- Embedded Trend 4.6.2
- Embedded Trend 4.5.5
- Embedded Trend 4.5.4