This article applies to version 4.4.2 of P2 Explorer. For the latest, see Data Selector.
Overview
Many of the Explorer components are used for displaying data. For example, the data label, charts, the dataset table, target bars, meters.
Component data needs to be defined during design time, in Explorer Studio.
This article explains how to select and define data, using the data selector editor.
Data Selector Features
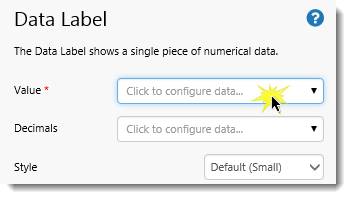
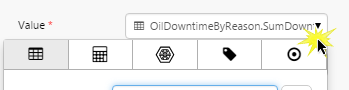
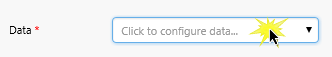
To open the data selector, click the drop-down list on a component property that shows the text "Click to configure data...", for example the Value property on the properties panel of the Data Label component.
Click the Drop-Down List "Click to configure data"
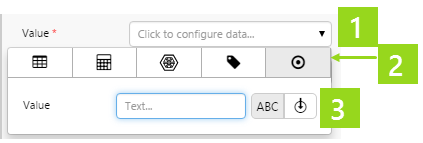
The data selector opens as a separate panel below the property. The contents of this panel may vary, according to the type of data to configure (the data category) and how that data is to be returned (as a list, a set, or as a single data point).
1. Value:
This is the component property which uses the configured data. The name varies between different component properties.
2. Data Category:
Click to select one of the data categories.
3. Configure Data:
Configure data for the selected data category.
A Component's Data
Depending on the data component, data can be defined for more than one of the properties.
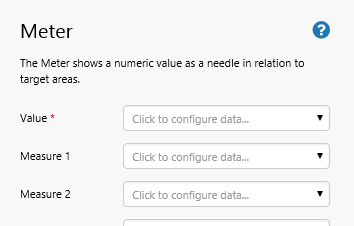
For example, a Meter component has Value data (the value measured on the meter) as well as a whole series of Measures, a Minimum Value and number of Ticks.
Some of the properties on a Meter component
Another example is the Data Label component, which has Value data (a numerical value that is displayed on the label in run-time), as well as Decimals, for formatting the data.
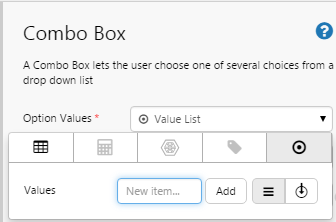
Categories are unavailable for components that can't use them. For example, the Combo Box component only has the dataset Dataset and Value categories available:
Setting a Variable
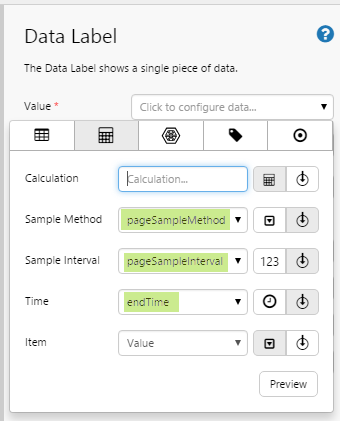
When configuring data for a component, you will find that most of the properties have a Variable option.
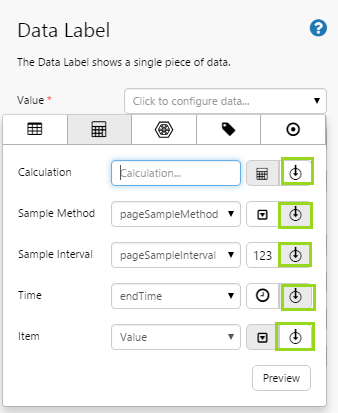
For example, when you configure a new data label to use an ad hoc calculation, all of the calculation properties variable options, as shown below.
To use a variable, click the variable button, then select a variable from the drop-down list or type in a variable name, ensuring the variable suits the property. For example, when you configure Sample Method to use a variable, that variable should be configured to have legitimate sample methods (Last Known Value, Average, Linear Interpolate and Raw).
Note that only variables of the correct type are available in the drop-down list (for example, where the property expects text, only text variables are available).
Example
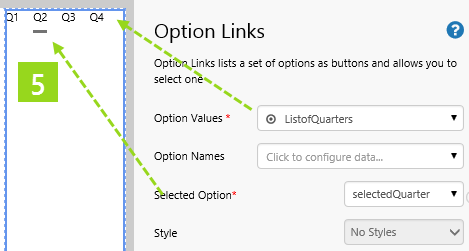
The following example illustrates how you can select a List variable for an Option Links' Option Values, and Text variable for its Selected Option.
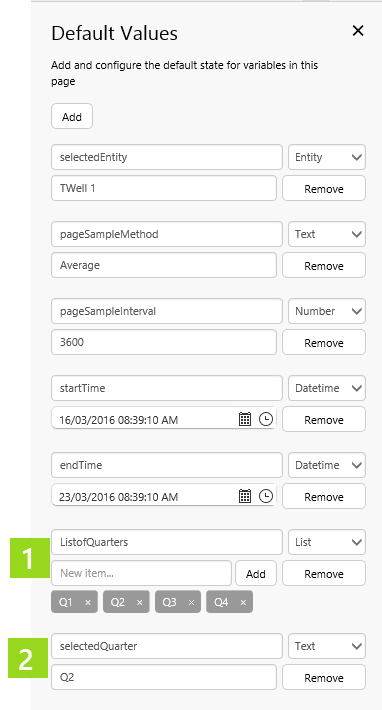
1. List variable added to Default Values: Variable Name: ListofQuarters; Comma separated text values: Q1, Q2, Q3, Q4.
2. Text variable added to Default Values: Variable Name: selectedQuarter; text value: Q2.
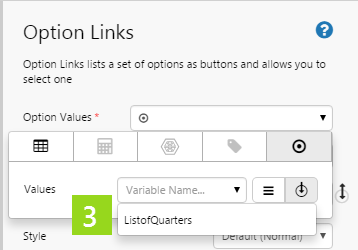
3. List variable assigned to Option Links: Variable ListofQuarters is selected for the Option Links' Option Values.
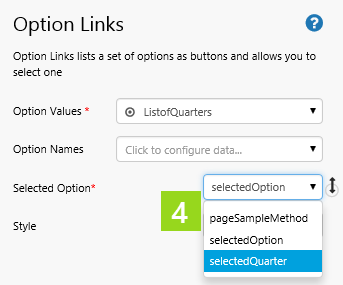
4. Text variable assigned to Option Links: Variable selectedQuarter is selected for the Option Links' Selected Option.
5. The Option Links: Showing Option Values (ListofQuarters) in the Option Links buttons, with Selected Option (selectedQuarter) underlined.
Page Defaults
When you assign data to a component's property, you will find that very often the page default has already been assigned.
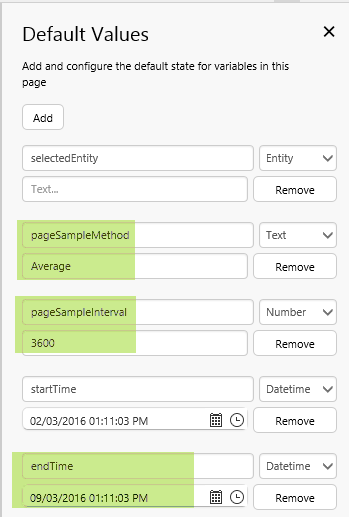
For example, when you configure a new data label to use an ad hoc calculation, some of the calculation properties come with page defaults, as shown below:
The page defaults are added to the Default Values for a new Studio page
You can view or update the page defaults on the Default Values panel.
Selecting and Configuring your Data
Explorer’s Data Selector is used to collect data for properties of components, such as the Data for a Data Table, or the Option Values used by a Combo Box.
Skip to the section that's relevant for the data you want to use:
Dataset: Using Dataset Data (for tabular data returned from a dataset datasource).
Attribute: Using Attribute Data (A piece of data describing a specific characteristic of an entity).
Tag: Using Tag Data (A piece of data or a calculation. This can also be referenced by an attribute).
Value: Using Value Data (A fixed or variable numerical value, defined in Studio).
Watch the video below to see how the dataset query is selected for a Data Table component.
The video below shows how data is selected for a combo box. First we use a dataset column, and next we use values. Note that only the currently selected data category is saved when the page is saved.
Using Dataset Data
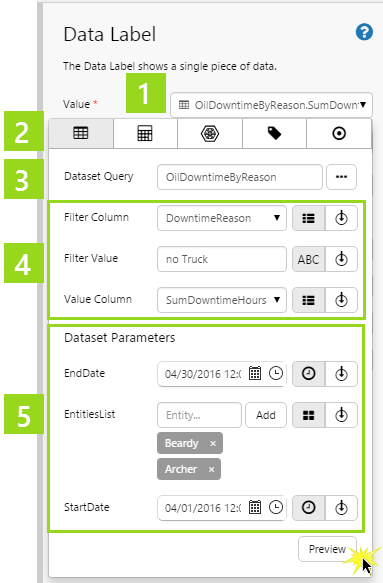
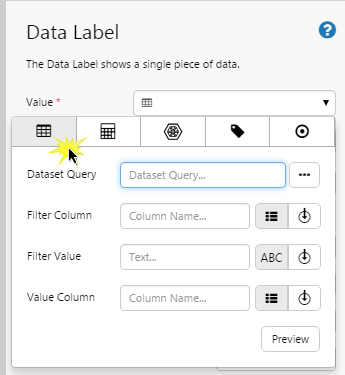
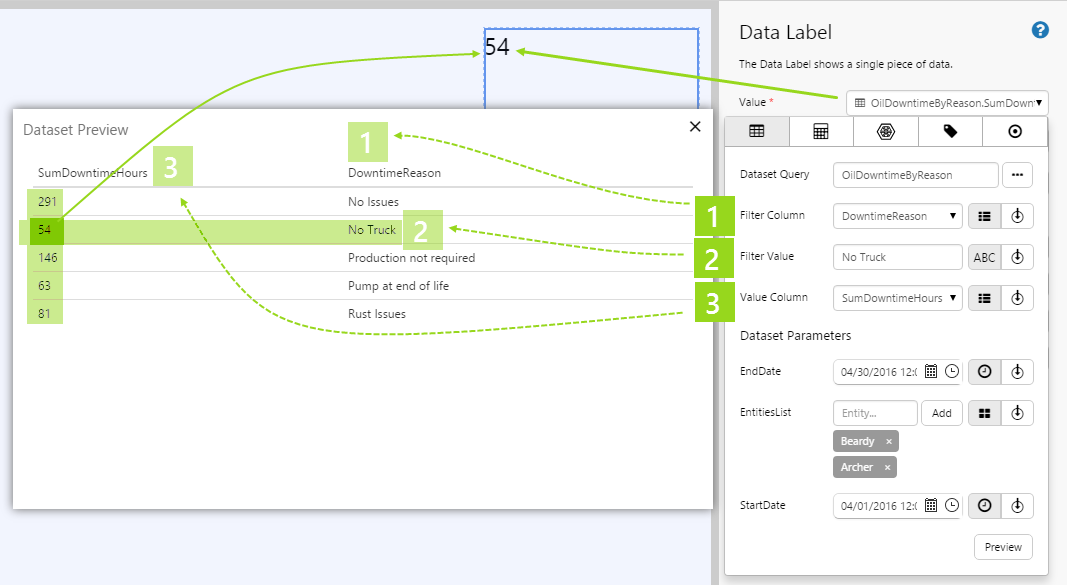
Below is an example of the dataset configuration for a data label's Value property which requires a single numerical value.
1. Component Property:
This is the property that uses the data. In the example used, it is the Value, used for a Data Label.
2. Data Categories:
The selected category is highlighted, with details shown in the panel below the categories tab.
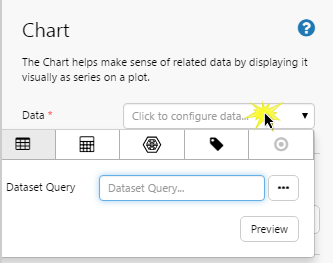
3. Dataset Query:
The dataset query used to source a list of data for this component’s property.
4. Filter Column, Filter Value and Value Column:
Property components that require a single list of data (such as the Data Label's Value property) use these three columns collectively, to specify a single point of data from the result set. Not all property components require this sort of filtering.
Variation (1): Property components that require a single point of data (such as the Option Links's Option Values property) only use the Value Column.
Variation (2): Property components that require the full set of data (such as the Chart's Data property) do not use these three columns.
5. Dataset Parameters:
Not all queries have dataset parameters, and if they do these will vary depending on the query. These values need to be filled in before you can preview data.
Note: Click Preview to see what columns and values are returned by the query. This is helpful for setting up filtering.
How to Select Dataset Data
This example uses a Data Label. Some of the components' properties (such as the Chart's Data) require fewer or no filter details.
Step 1. Click the drop-down list next to the Value property to open the Data Selector.
The Data Selector editor opens, for the Value property.
In this example, we select the OilDowntimeByReason dataset from the Oil and Gas Data datasource.
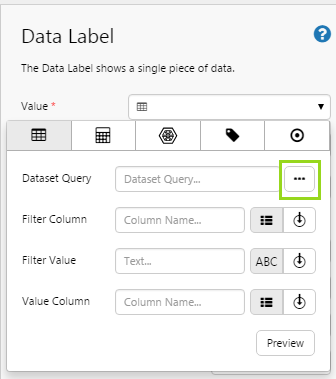
Browse for a Dataset Query
Or
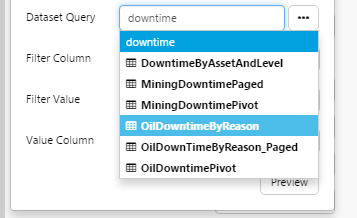
Type in a Dataset Query Name
To browse for a dataset query, click the ellipsis button next to the Dataset Query edit box.
Alternatively, type part of the dataset query name into the Dataset Query edit box, and select a dataset query from the list filtered list.
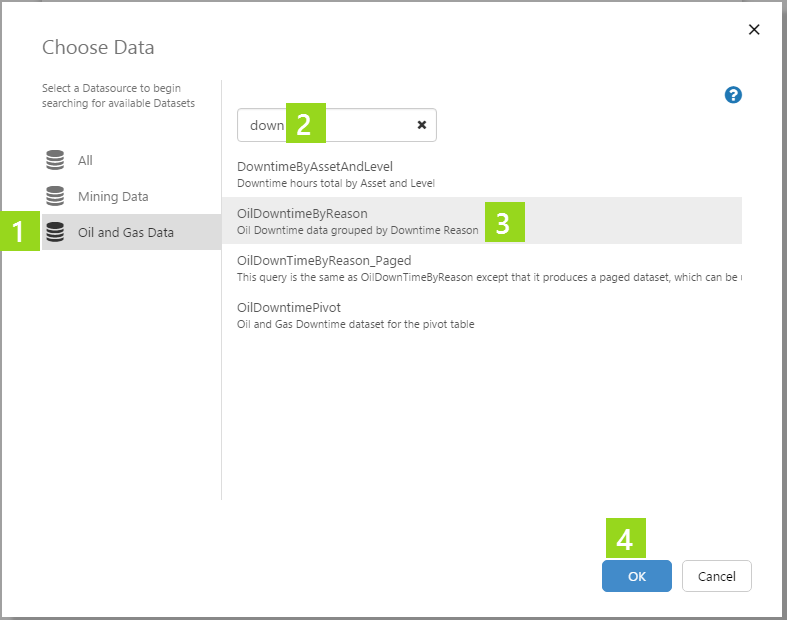
The Choose Data window opens, with a list of every dataset query available to this installation of Explorer. Use the search options to locate the one you want. If a dataset has a description, this is listed below the name.
The selected name appears in the Dataset Query edit box.
1. Click on one of the available datasources (listed on the left panel) to filter the available datasets (Oil and Gas Data, in this example).
2. Type part of the dataset query name in the Search box, or scroll down the list, to locate the dataset you are searching for (OilDowntimeByReason, in this example).
3. Click on the dataset query, in the right panel.
4. Click OK.
The selected name appears in the Dataset Query edit box.
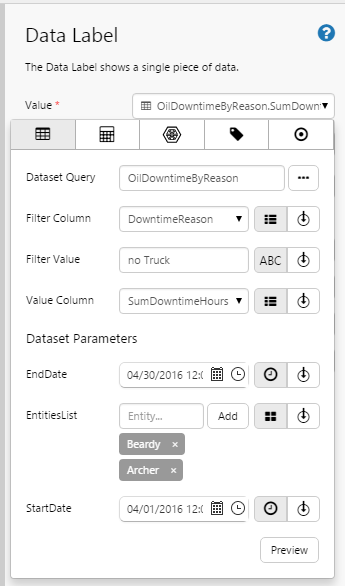
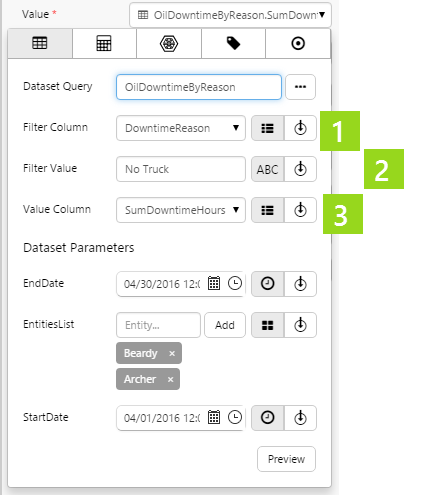
Step 3 b) Set Filter Column, Filter Value and Value Column, where applicable.
1. In the Filter Column text box select a column name from the dataset result set, as shown in the preview data (or set a variable).
2. In the Filter Value text box, type a value from the dataset result set (as shown in the preview data), matching one of the values from the filter column (or set a variable).
3. In the Value Column text box, select a column name from the dataset result set (or set a variable).
Note how the Filter Column and Value Column are assigned actual column names, as shown in the preview data. Filter Value uses an actual value: ‘No Truck', from the ‘DowntimeReason' column.
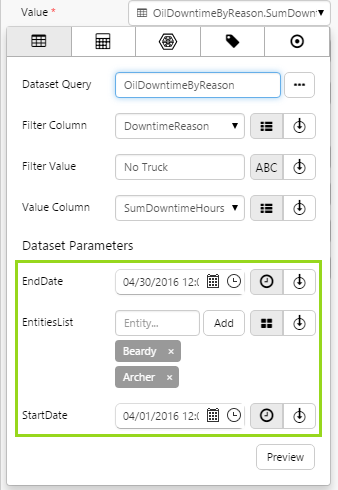
Step 3 c) If there are Dataset Parameters, type a value in each one’s corresponding text box (or set a variable).
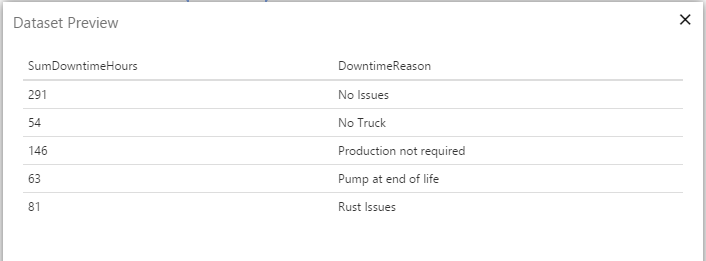
Step 3 d) Click Preview to view the dataset results. This is useful if you want to see column names and values, for Filtering.
The Dataset Preview window opens, displaying the result set for the selected query dataset and parameters.
The Data Label Value property is configured, and the resulting data is displayed in the Data Label component.
The screenshot below shows how filtering is used to locate a single data point.
Step 4. Click the configured drop-down list, to close it.
Using Ad hoc Calculation Data
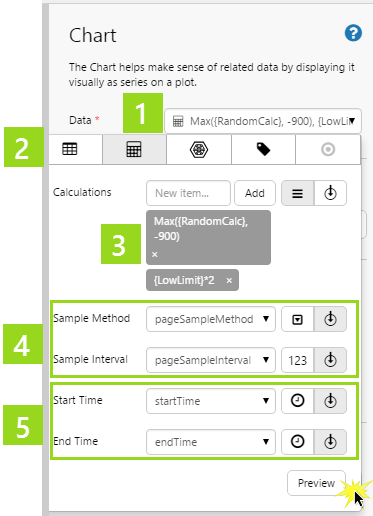
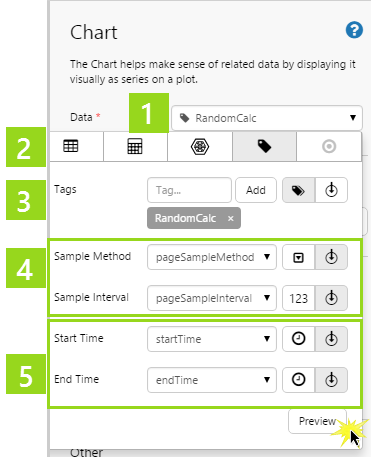
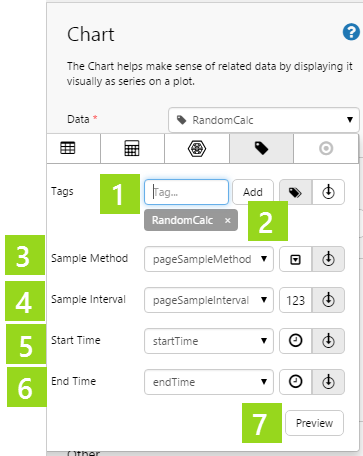
Below is an example of what a property’s ad hoc calculation configuration looks like.
1. Component Property:
This is the property that uses the data. In the example used, the data from two calculations using tags is available for the chart.
2. Data Categories:
The selected category is highlighted, with details shown in the panel below the categories tab.
3. Calculations:
Each calculation sources a range of data (for the selected time range, defined by Start Time and End Time) for this component’s property.
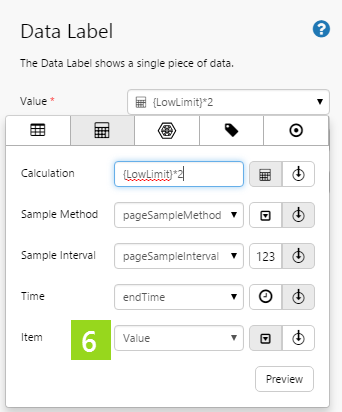
Variation: For component properties where only a single point of data is used (such as the Data Label's Value), you can only enter a single calculation, and this is for a single point in time.
4. Sample Method and Sample Interval:
Sample Method and Sample Interval are used to define the method (e.g. Average) and the interval (e.g. 3600 - measured in seconds) that tag and/or attribute data within any calculations is collected for this component.
5. Start Time and End Time:
These times specify the request interval for data (tags or attributes) that form part of the calculations.
Variation: For component properties where only a single point of data is used (such as the Data Label's Value), you can only enter a single time: Time.
6. Item:
Variation: For component properties where only a single point of data is used (such as the Data Label's Value), select an Item.
The default is Value - where values of any tags or attributes are used in the calculation. You can also select Confidence from the drop-down list. Confidence is a measure (1 - 100) of the data's accuracy.
Note: Click Preview to see the calculation results in a table.
How to Select Ad hoc Calculation Data
This example uses a Chart component.
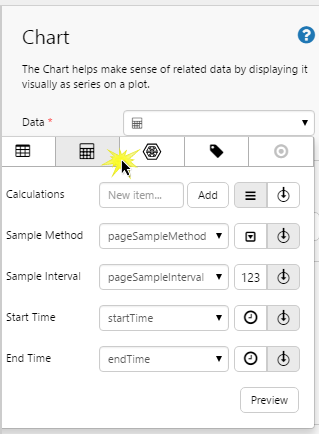
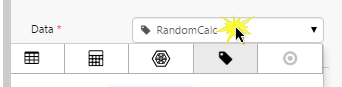
Step 1. Click the drop-down list next to the Data property to open the Data Selector.
The Data Selector editor opens, for the Data property.
Step 2. Click the Ad-hoc category.
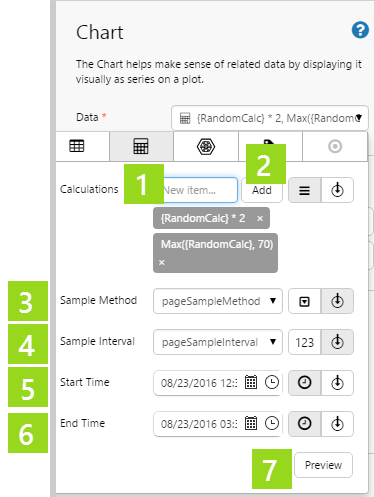
Step 3. Select and configure the ad hoc calculation.
1. Type in a Calculation (or set a variable). For example: {RandomCalc} * 2
See the box on the right, for more information about ad hoc calculations.
2. Click the Add button to the right of the Calculations box.
Continue to add new calculations in this way.
3. Select a Sample Method to specify how Server should collect the attributes/tags used in the calculations.
Click the Options button to the right of the Sample Method box, then select a sample method from the drop-down list: Average, Last Known Value, Linear Interpolate or Raw. (Or set a variable.)
4. Select a Sample Interval to specify which interval Server should use to collect the attributes/tags used in the calculations.
Click the Number button to the right of the Sample Interval box, then type in a number. This is the interval, in seconds, and should be a multiple of 60. (Or set a variable.)
5. Select a Start Time (or set a variable) to specify the start of the request interval Server for should use for the attributes/tags used in the calculations.
Click the Time button to the right of the Start Time box, then select a date and time from the date time picker.
6. Select an End Time (or set a variable) to specify the end of the request interval Server for should use for the attributes/tags used in the calculations.
Click the Time button to the right of the End Time box, then select a date and time from the date time picker.
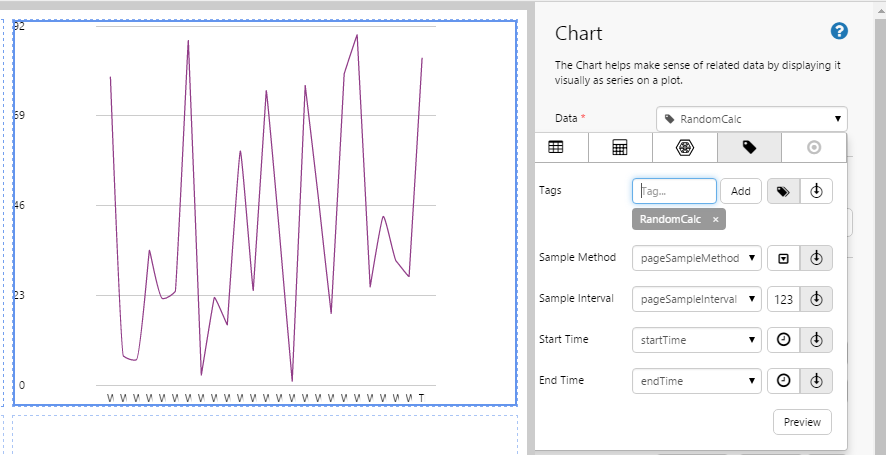
7. Click Preview to see the tag results in a table.
Ad hoc Calculations
Syntax for an Ad hoc Calculation:
A basic calculation is a combination of tags and/or attributes and numbers, with mathematical operators such as multiply *, add +, subtract - and divide %.
Tags and Attributes in a Calculation:
Tags and attributes must be enclosed by curly braces {}.
The attribute name is made up of the following components: Entity, Template, Attribute, Attribute Value, put together in this format: Entity[Template]:Attribute!Attribute Value
Example of an attribute definition: TWell 1[Oil Producing Well]:Casing Pressure!Actual
Note: If you choose not to specify a template, the primary template, current for the retrieved data's timestamp, is the one that gets used. (Primary templates, which are time aware, are defined in Server. Read more about this here.)
Note: If you choose not to specify an attribute value, the default attribute value, current for the retrieved data's timestamp, is used. (Default attribute values, which are time aware, are defined in Server. Read more about this here.)
Example of a basic calculation:
{TWell 1[Oil Producing Well]:Tubing Head Pressure!Target} - {TWell 1[Oil Producing Well]:Tubing Head Pressure!Actual}
More on Calculations:
Refer to the article Mathematical Expressions for syntax on some common mathematical functions to use in your calculations.
For example, here is a calculation using the sqrt (square root) function: sqrt({TWell 1:Casing Pressure} + 20)
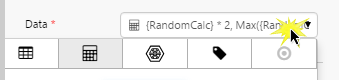
To use this data, we've configured the chart to use data from the ad hoc calculations as follows: the {RandomCalc}*2 column for a Line Series and the Max({RandomCalc}, 70) column for a second line series, and the Timestamp column as the X Axis Column.
In the screenshot below, you can see the two calculation values {RandomCalc}* 2 and Max({RandomCalc}, 70) plotted along the X Axis (Timestamp).
Step 4. Click the configured drop-down list, to close it.
Using Attribute Data
TOP TIP
Use the shortcut method for Dropping Tags or Attributes onto the component property. Note that this is only available on some of the components.
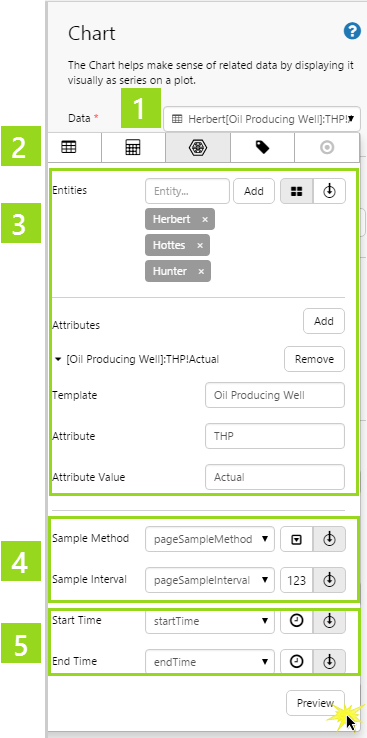
Here is an example of what a property’s attribute configuration looks like, where a set of data is required (such as the Data for a Chart). Note that there is a start time and an end time here for a range of dates, as well as the option to add multiple entities and attributes.
1. Component Property:
This is the property that uses the data. In the example used, data from a single attribute, for three different entities is available for the chart. This data spans the time range specified by Start Time and End Time.
2. Data Categories:
The selected category is highlighted, with details shown in the panel below the categories tab.
3. Entities and Attributes:
One or more entities is specified here. One or more attributes for the defined entities is specified.
Attributes are qualified by Template, Attribute, and Attribute Value names.
Variation: For component properties where only a single point of data is used (such as the Data Label's Value), you can only enter a single Entity and a single Attribute.
4. Sample Method and Sample Interval:
These are used to define the method (e.g. Average) and the interval (e.g. 3600 - measured in seconds) that attribute data is collected, for this component.
5. Start Time and End Time:
These times specify the request interval for the various attribute values.
Variation: For component properties where only a single point of data is used (such as the Data Label's Value), you can only enter a single time: Time.
6. Item:
Variation: For component properties where only a single point of data is used (such as the Data Label's Value), select an Item.
The default is the attribute value's Value. You can also select Name, Timestamp, or Confidence (a measure, from 1 to 100, of the data's accuracy) from the drop-down list.
Note: Click Preview to see the attribute values in a table.
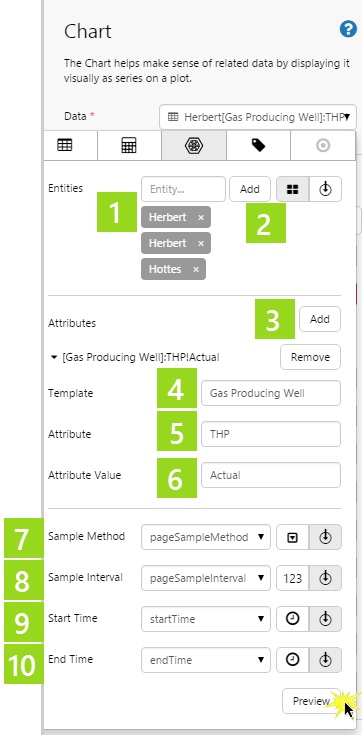
How to Select Attribute Data
The Chart requires a set of data, so we’re using this as an example.
Step 1. Click the drop-down list next to the Data property to open the Data Selector.
The Data Selector editor opens, for the Data property.
Click the Entities button to the right of the Entities box, then start typing an entity name in the Entities box. As you type, a list of matching names appears. Click to select an entity from the list. Note that you can search for an entity using the Wildcard characters, ? and *. Read more about Searching with Wildcard Filtering, introduced in version 4.5.4.
2. Or type an entity name and then click the Add button to the right of the Entities box.
Continue to add new entities in this way.
3. Click the Add button to the right of the Attributes label, to add attributes.
4. In the Template box, type in a Template name. As you type, a list of matching names appears. Click to select a template from the list.
5. In the Attribute box, type in an Attribute name. As you type, a list of matching names appears. Click to select an attribute from the list.
The current default attribute value appears in the Attribute Value box.
6. To change the default Attribute Value, type a new Attribute Value into the Attribute Value box. As you type, a list of matching names appears. Click to select an attribute value from the list.
Click the Options button to the right of the Sample Method box, then select a sample method from the drop-down list: Average, Last Known Value, Linear Interpolate or Raw. (Or set a variable.)
8. Select a Sample Interval (or set a variable) to specify which interval Server should use to collect the attribute data.
Click the Number button to the right of the Sample Interval box, then type in a number. This is the interval, in seconds, and should be a multiple of 60.
9. Select a Start Time (or set a variable) to specify the start of the request interval Server for should use for the attribute.
Click the Time button to the right of the Start Time box, then select a date and time from the date time picker.
10. Select an End Time (or set a variable) to specify the end of the request interval Server for should use for the attributes.
Click the Time button to the right of the End Time box, then select a date and time from the date time picker.
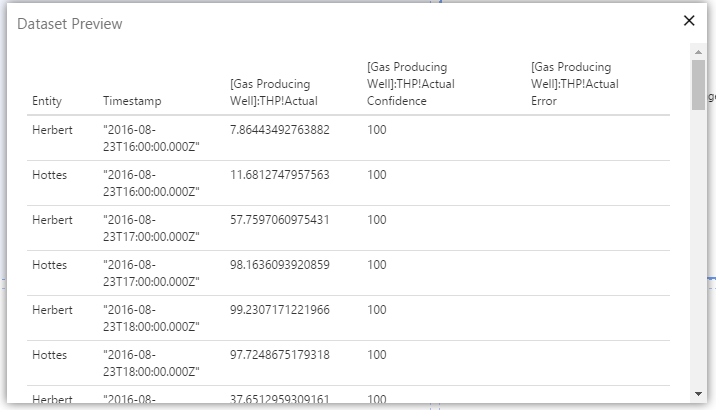
Note: Click Preview to see the tag results in a table.
Attributes
The attribute name is made up of the following components: Entity, Template, Attribute, Attribute Value, put together in this format:
Entity[Template]:Attribute!Attribute Value
Entity
Any entity defined in the data model can be used here.
This is what the previewed data looks like, for this example.
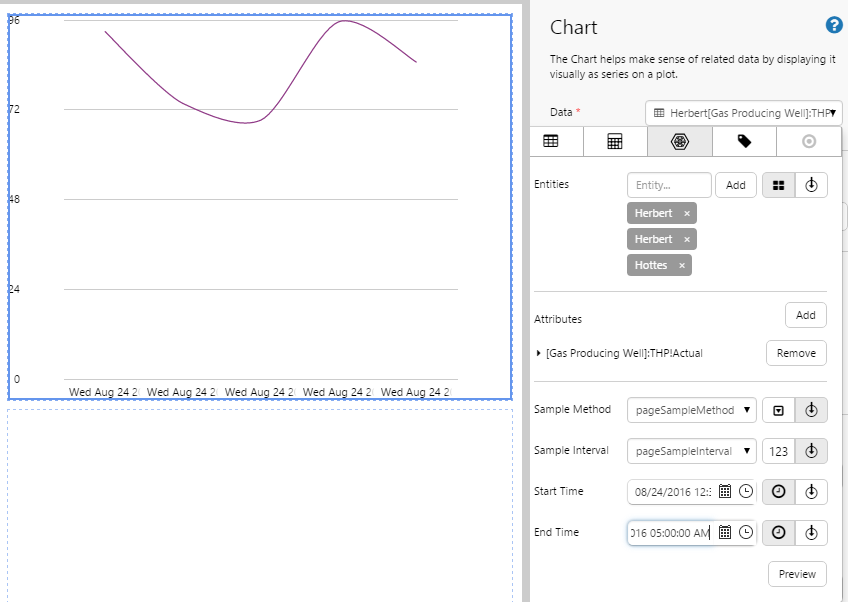
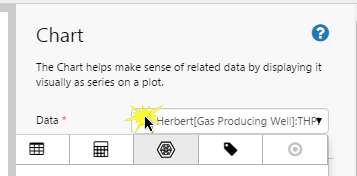
To use this data, we've configured the chart to use the [Gas Producing Well]:THP!Actual column (just for entity Herbert) for a Line Series Y Column, and the Timestamp column as the X Axis Column.
In the screenshot below, you can see the values for the attribute (THP[Gas Producing Well]:THP!Actual) plotted along the X Axis (Timestamp).
Step 4. Click the configured drop-down list, to close it.
Using Tag Data
TOP TIP
Use the shortcut method for Dropping Tags or Attributes onto the component property. Note that this is only available on some of the components.
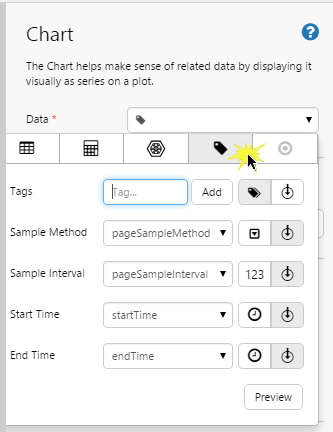
Below is an example of what a property’s tag configuration looks like, where a set of data is required (such as the Data for a Chart). Note that there is a start time and an end time here for a range of dates, as well as the option to add multiple tags.
1. Component Property:
This is the property that uses the data. In the example used, it is the Data property, for the chart.
2. Data Categories:
The selected category is highlighted, with details shown in the panel below the categories tab.
3. Tags:
The tags used to source a a matrix of data for this component's Data property.
Variation: For component properties where only a single point of data is used (such as the Data Label's Value), you can only enter a single Tag.
4. Sample Method and Sample Interval:
These are used to define the method (e.g. Average) and the interval (e.g. 3600 - measured in seconds) that tag data is collected, for this component's Data property.
5. Start Time and End Time:
These times specify the request interval for the various tag values.
Variation: For component properties where only a single point of data is used (such as the Data Label's Value), you can only enter a single time: Time.
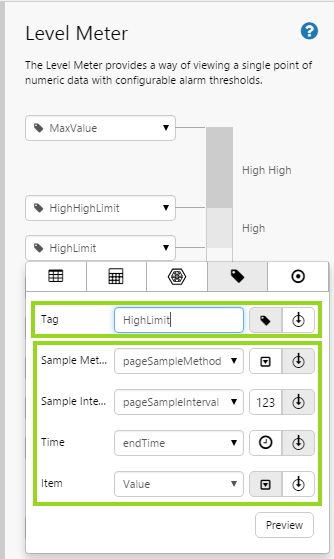
Item (not shown here):
Variation: For component properties where only a single point of data is used (such as the Data Label's Value), select an Item.
The default is Value - where values of any tags or attributes are used in the calculation. You can also select Confidence from the drop-down list. Confidence is a measure (1 - 100) of the data's accuracy.
Note: Click Preview to see the tag results in a table.
How to Select Tag Data
Step 1. Click the drop-down list next to the Data property to open the Data Selector.
The Data Selector editor opens, for the Data property.
Click the Tags button to the right of the Tags box, then start typing a tag name. As you type, a list of matching names appears. Click to select a tag from the list. Note that you can search for a tag using the Wildcard characters, ? and *. Read more about Searching with Wildcard Filtering, introduced in version 4.5.4.
2. Click the Add button to the right of the Tags box.
Click the Options button to the right of the Sample Method box, then select a sample method from the drop-down list: Average, Last Known Value, Linear Interpolate or Raw. (Or set a variable.)
4. Select a Sample Interval (or set a variable) to specify which interval Server should use to collect the tag data.
Click the Number button to the right of the Sample Interval box, then type in a number. This is the interval, in seconds, and should be a multiple of 60.
5. Select a Start Time (or set a variable) to specify the start of the request interval for the tag data.
Click the Time button to the right of the Start Time box, then select a date and time from the date time picker.
6. Select an End Time (or set a variable) to specify the end of the request interval for the tag data.
Click the Time button to the right of the End Time box, then select a date and time from the date time picker.
7. Click Preview to see the tag results in a table.
Tags
A tag is a time series data item, that has not been modelled into a hierarchy.
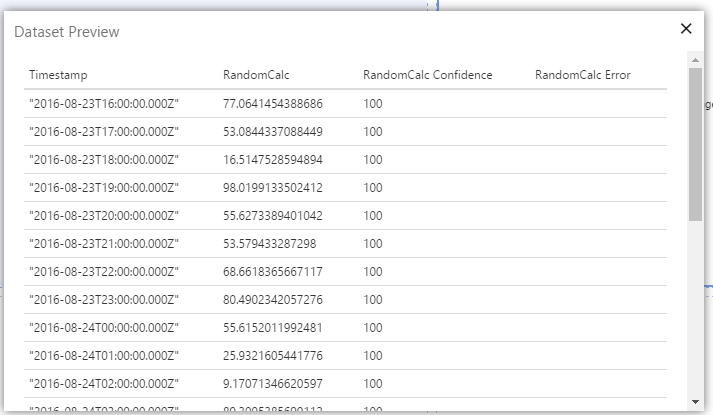
This is what the previewed data looks like, for this example.
The Chart's Data property is configured, and the resulting data is available for use in the chart component.
To use this data, we've configured the chart to use the tag data as follows: the Silver column for a Line Series, the Goldenrod column for a second Line Series, and the Timestamp column as the X Axis Column.
In the screenshot below, you can see the value for the two tag, RandomCalc , plotted along the X Axis (Timestamp).
Step 4. Click the configured drop-down list, to close it.
Using Value Data
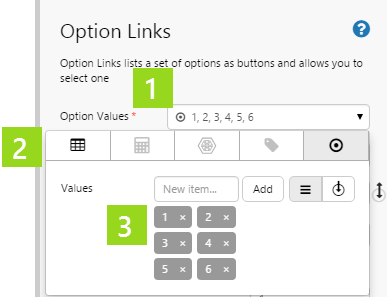
Here is an example of what a property’s value configuration looks like, where a list of data is required (such as the Option Values for an Option Links) component.
1. Component Property:
This is the property that uses the data. In the example used, it is the Option Values, used by the Option Links component.
2. Data Categories:
The selected category is highlighted, with details shown in the panel below the categories tab.
3. Values:
A set of values. These can be numerical or text.
Variation: For component properties where only a single point of data is used (such as the Data Label's Value), you can only enter a single Value.
How to Select Value Data
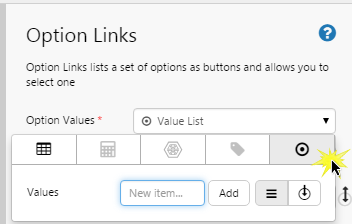
Step 1. Click the drop-down list next to the Option Values property to open the Data Selector.
The Data Selector editor opens, for the Option Values property.
Step 2. Click the Value category.
Step 3. Select and configure the values.
Step 3 a) Click the CSV (comma separated values) button to the right of the Values box, then type in a number or string. (Or set a variable.)
Step 3 b) Click the Add button to the right of the Values box, or press the Enter key.
Step 3 c) Keep adding values in this way, until you have all the value options that you want to use.
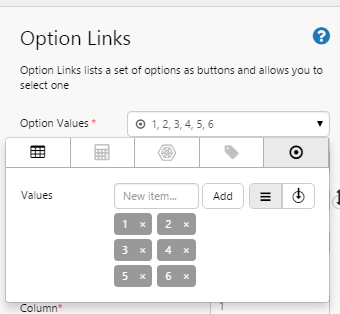
The Option Links Option Values property is configured, and the resulting data is displayed in the Option Links component.
Step 4. Click the configured drop-down list, to close it.
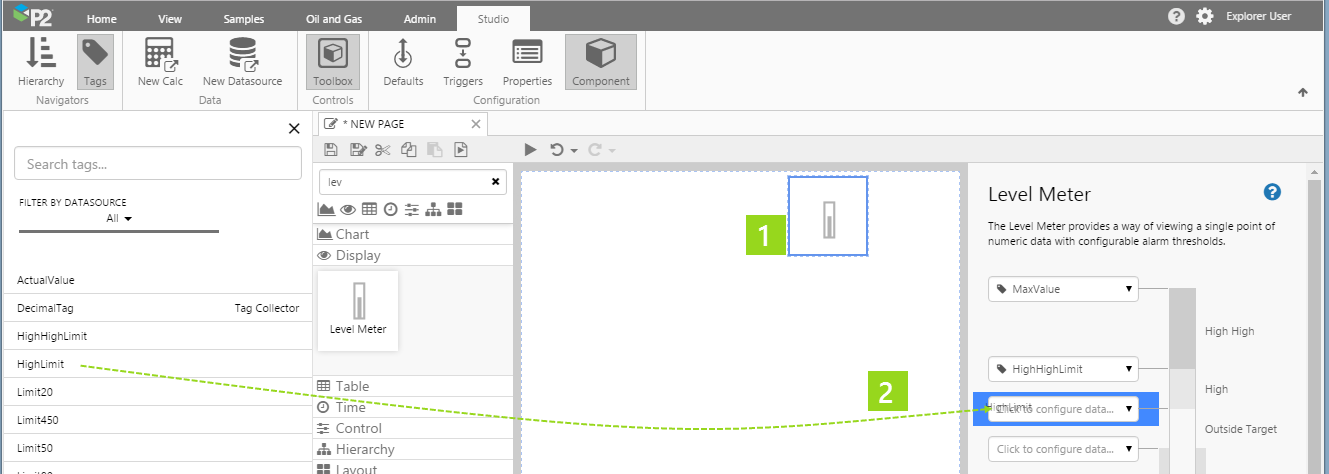
Dropping Tags or Attributes into the Data Field
Some of the components can have data dropped into their Data Selectors straight from the Hierarchy or Tag navigators.
These are the components which would typically be used to show tag or attribute data, for example:
2. Locate a tag, attribute or attribute value, then drag and drop it into the applicable property of the component.
In the same example as used above, you can see how the tag value has been inserted into the component property, with defaults for Sample Method, Sample Interval, Time and Item.
3. For components that can use multiple tags or attributes (such as the Data Table), you can continue to drag and drop additional tags/attributes.
4. If you need to adjust the Sample Method, Sample Interval, Start Time and End Time (or Time and Item), see how in Points 4 and 5, for Tags, or Attributes.