ON THIS PAGE:
A trend displays time-series data, such as tags, attribute values and calculations, over a selected period of time.
To create a trend, click New Trend on the Home ribbon tab. You can add tags, attribute values and calculations to your new trend.

Overview
The screenshot below shows a new trend, with three traces. The trend has five main sections:
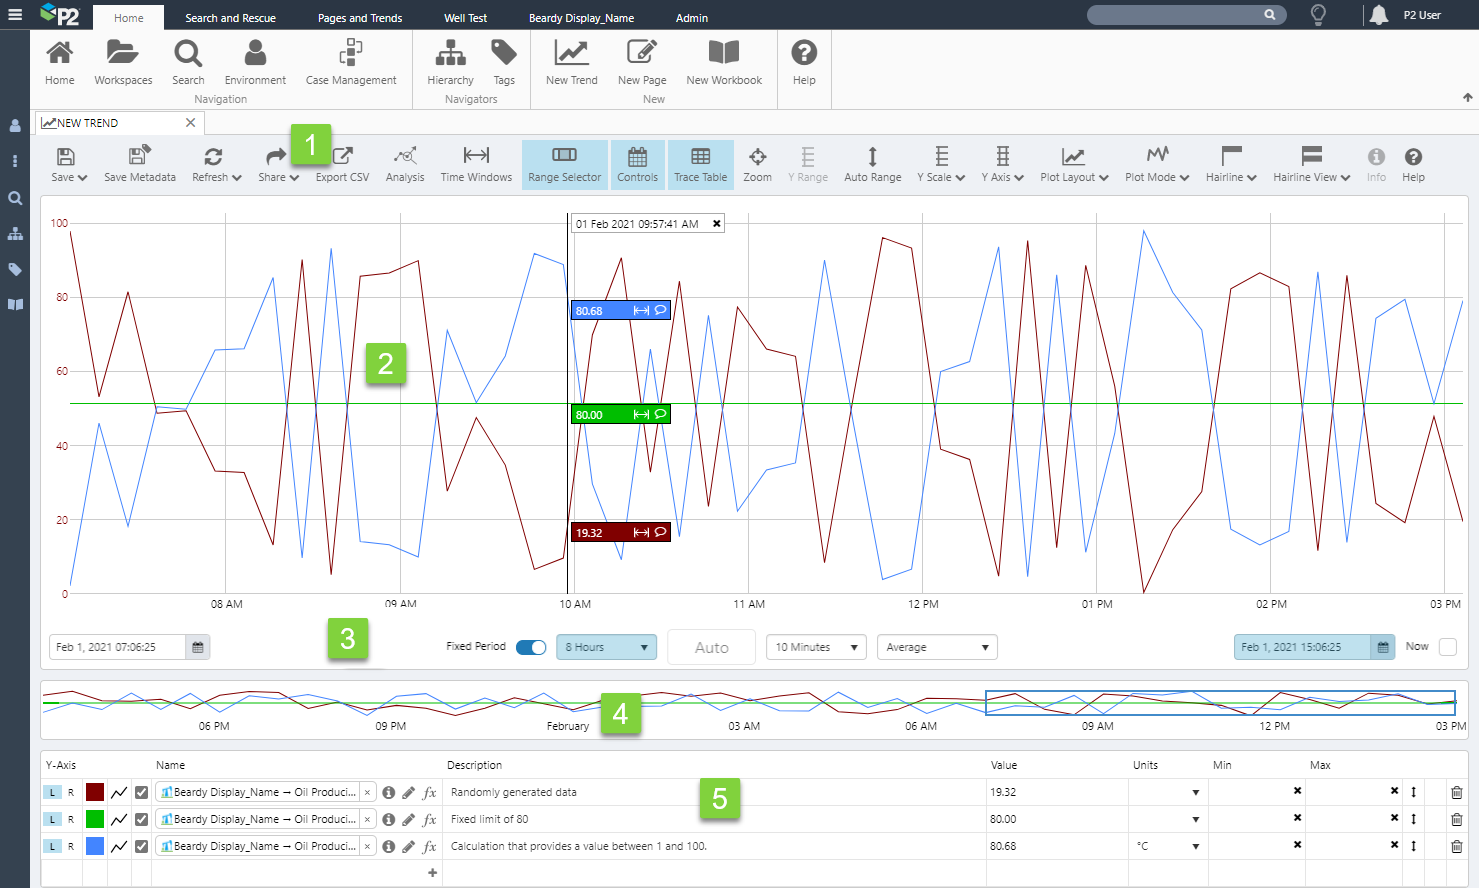
| 1. | Trend Toolbar | The Trend Toolbar is activated whenever a trend is opened and is used for managing and sharing the trend, as well as refreshing data or resetting the trend, and choosing some of the trend configuration such as Y-Scale Type, number of allowable hairlines and what type of Y-Axis is used. Click Auto Range to reset the minimum and maximum values for the trace items, so that all data points are visible on the trend. |
| 2. | Trace Window | Data is plotted in the Trace Window, along with hairlines and comments. |
| 3. | Trend Controls | The selections you make in the Trend Controls affect the time range of the chart, as well as the data collection method and interval. |
| 4. | Range Selector | The highlighted section in the range selector matches the start and end of the trend time range. Use the range selector as a longer trend, to help identify highs and lows. You can select smaller periods within the range selector, to pick a new time range. |
| 5. | Trace Table | The Trace Table lists each item (attribute, tag or calculation) in the trend, along with its description, minimum and maximum, and units. The table also displays values or statistics. Use the functionality here to format each trace line (colour, trace style, visibility), add or remove trace lines, add or edit calculation traces, open Point Details for a tag or attribute value, choose a Left or right Y-Axis, and manipulate display minimums and maximums. |
A saved trend also has Display Information. Click the Info button on the trend toolbar to open the Display Information in the Info Zone. Tutorial 7 describes how to add and view Display Information.
Tutorials
In the tutorials that follow, we’ll add a new trend, and then drop some attributes into the Trace Window to create trace lines. Next, we'll experiment with changing selections, using the range selector, and adding a hairline with comments before saving the trend.

Note: You will need to search for attributes or tags within your own environment, to follow this exercise.
Tutorial 1: Simple Trend
In this tutorial, we create a simple trend by opening a blank trend and adding two attributes, and a tag. We then save the trend.
Step 1. Create a Trend
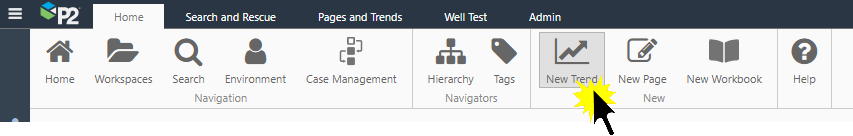
Open the Home tab on the Explorer ribbon, and click New Trend.
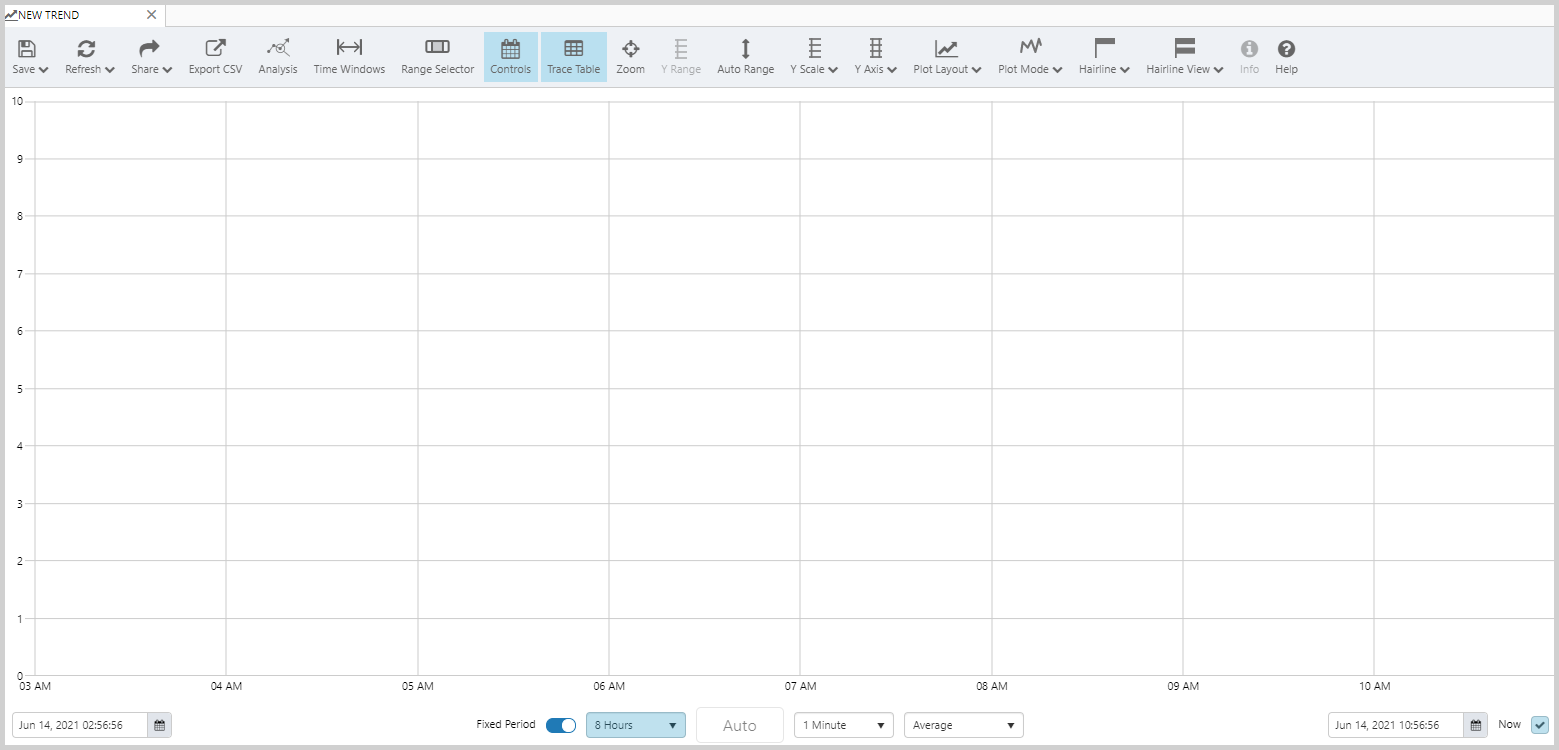
The Trend toolbar appears, with a new blank trend in the main window. The Controls and Trace Table are selected. The Configuration settings are defaulted to:
- Y-Scale: Linear
- Hairline: Single
- Y-Axis: Separate
- Mode: Time Series
The Trend Controls have the following defaults:
- Time: Duration, 8 hours
- Sample Interval: 1 minute
- Sample Method: Average
- Now: Selected
Step 2. Add a Trace
To trend an attribute or tag, you can either drag it onto the trace window, or add the item directly into the Name column using Auto-Complete or the Calculation Editor.
Adding an Attribute
To add an attribute to the Trace Window from the hierarchy navigator: Open the Hierarchy Navigator, select a hierarchy, select an entity, then drag and drop one of its attribute values onto the Trace Window.
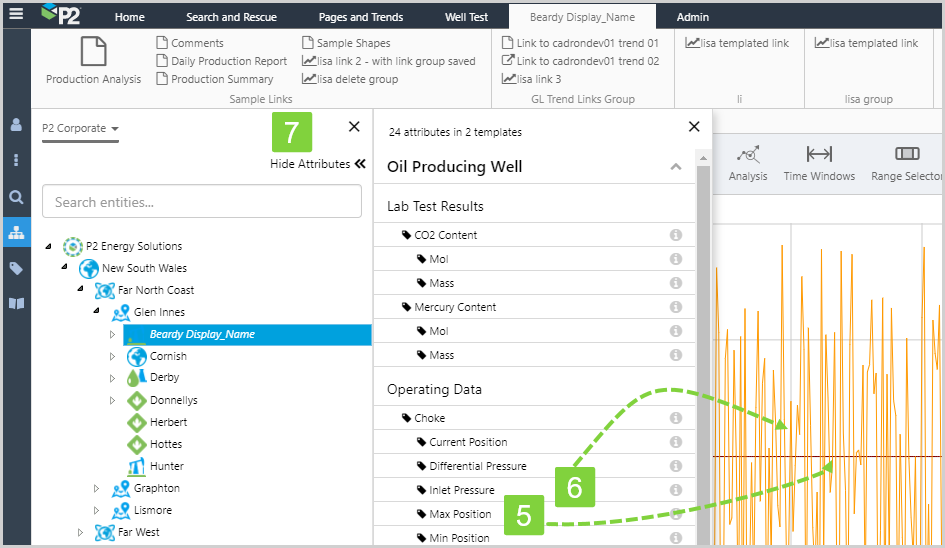
In our example tutorial, we select the P2 Corporate hierarchy, and navigate to the Beardy Display_Name entity:
P2 Energy Solutions>New South Wales>Far North Coast>Glen Innes>Beardy Display_Name
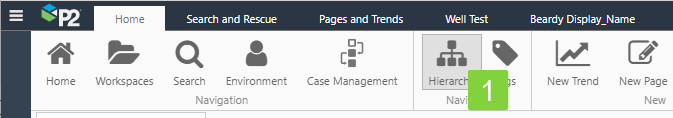
1. Click Hierarchy on the Home tab, on the Explorer ribbon.
2. Select a hierarchy from the drop-down list (P2 Corporate hierarchy in our example).
3. Navigate through the hierarchy to find your entity, or type the entity name in the search box and press enter. Then click the entity.
4. Click Show Attributes to open the Attributes Panel.

5. In the attributes panel, select an attribute from one of the templates, and drag it onto the Trace Window ({Beardy Display_Name[Oil Producing Well]:Choke!Max Position}, in our example).
6. Add another attribute in the same way ({{Beardy Display_Name[Oil Producing Well]:Choke!Inlet Pressure}}, in our example).
7. Click Hide Attributes to close the Attributes Panel.
Adding a Tag
You can add a tag in a similar way to adding an attribute, however you use the Tags Navigator instead of the Hierarchy Navigator.
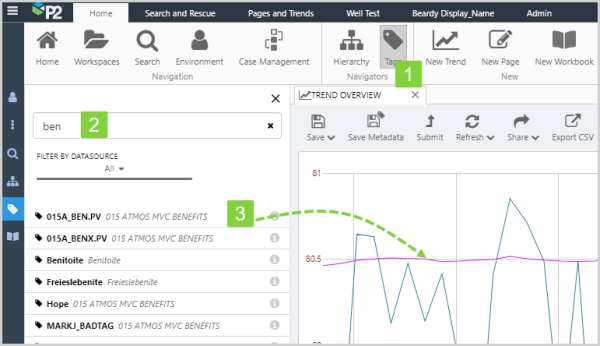
1. Click Tags on the Home ribbon.
2. Search for tags in the Tags Navigator that appears on a panel on the left.
3. Drag and drop a tag ({015A_BEN.PV}, in our example) onto the Trace Window.
Using the Trace Table
You can add an attribute value, tag, calculation, or templated attribute directly into the Trace Table.
Click in the Name column in a new row in the Trace Table.
Typing in the name: If you know a tag or attribute name, you can type this directly into the name column, always surrounding the tag or attribute name in {curly brackets}. You can also type in a calculation, with the tag or attribute also surrounded by curly brackets{}, for example: {TWell 1:Tubing Head Pressure} + 20, or add a calculation to to an attribute or tag that you dragged onto the trend, by editing the value in the Trace Table. Here are some examples:
| Tag | {Benitoite} | |
| Calculation with a tag | {Benitoite} * 2 | |
| Fully qualified attribute value | {Beardy Display_Name[Oil Producing Well]:Choke!Inlet Pressure} | |
| Partially qualified attribute value | {Beardy Display_Name:Choke} | The primary template (Oil Producing well, in our sample data) and the default attribute value (Actual, in our sample data) are supplied by P2 Server. |
| Templated attribute value | {entity[Oil Producing Well]:Choke!Inlet Pressure} | Read more about templated attributes, below. |
Using Auto-Complete: When you start typing a name directly into the Name column for a new item in the trace table, a list of tags, calculations and entities appears, where the name or description matches the search text. You can select one of these items to insert into the trace table.
Using the Calculation Editor: You can add a new item, or edit an existing one, using the Calculation Editor. Each item in the trace table has a pencil icon ![]() in the Name column, linking to the Calculation Editor. Click the pencil icon to open the Calculation Editor and build an expression which can be immediately inserted into the trend.
in the Name column, linking to the Calculation Editor. Click the pencil icon to open the Calculation Editor and build an expression which can be immediately inserted into the trend.
To edit a calculation from the trend, or save to a new calculation, click the corresponding pencil icon in the trace table.
Templated Attributes and Entities: This variation of an Attribute definition uses the entity keyword. The keyword is replaced by the entity clicked on the hierarchy navigator (although not updated in the Name column). A trend that uses the entity keyword is often called a templated trend.
For example, if you add a templated attribute {entity[Oil Producing Well]:Age!Actual}, then the attribute values for TWell 1 are retrieved and traced when you click TWell 1 in the Hierarchy Navigator.
You can type this manually into the name field, or use the Calculation Editor to substitute the actual entity name with the entity keyword.
Step 3. Save the Trend
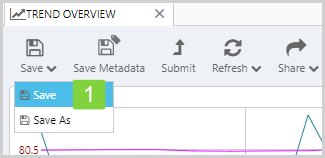
1. On the Trend toolbar, click Save.
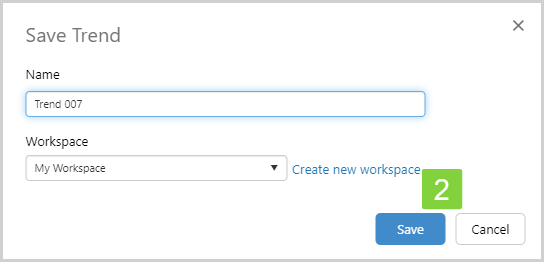
2. In the Save Trend window, type in a Name for your trend, and save to My Workspace.
Tutorial 2: Trend Controls
In this tutorial, we'll experiment with changing the trend controls. Note how these changes affect the trend, and also how some of the control selections are interdependent.
Using some basic examples, we'll demonstrate how the trend changes when different controls are selected. There are many different combinations you can try out on your own trend. Be aware that your selections (for example, a long duration with a small sample interval) may require a large data fetch which will affect performance.
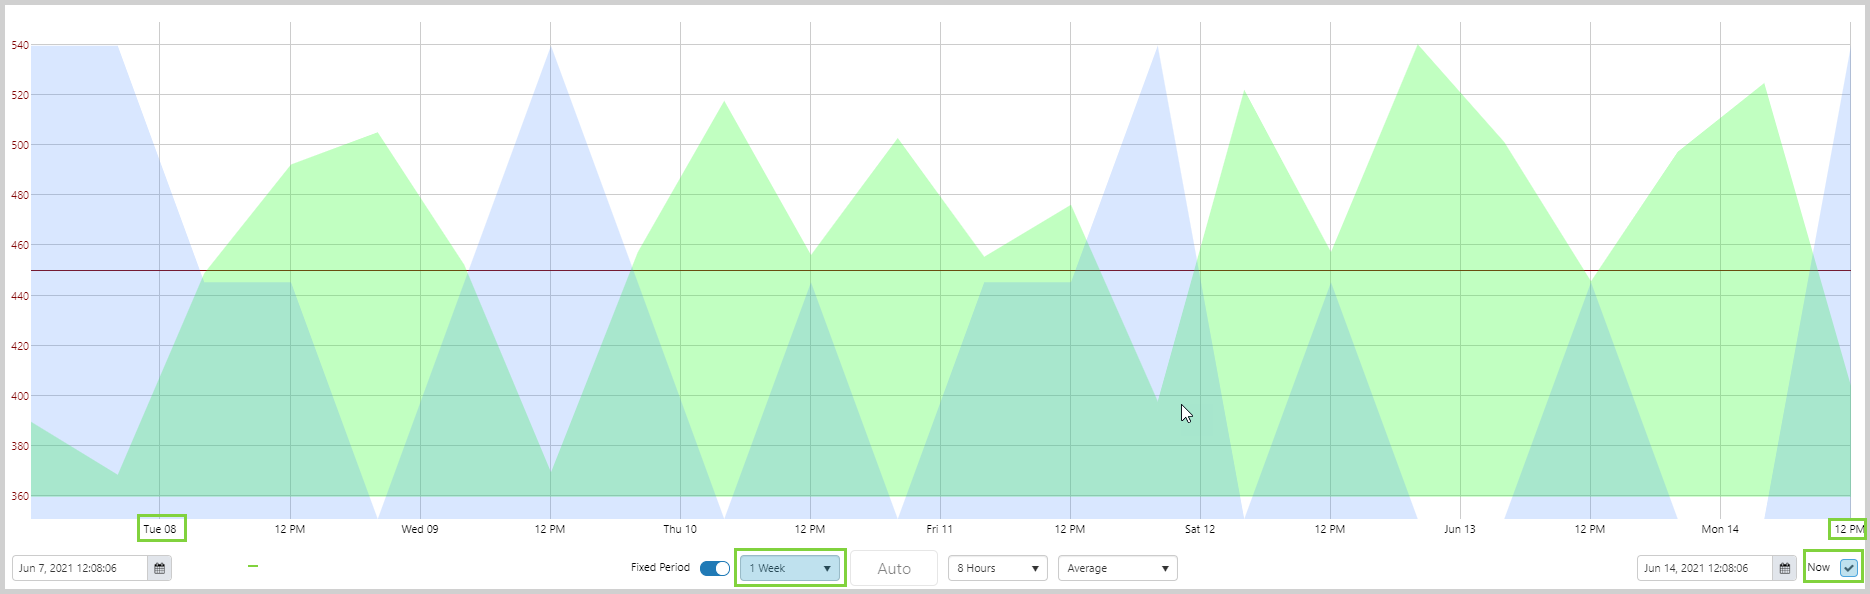
Step 1. Changing the Duration
Here we have selected a duration of 1 week. Note the dates and times on the X-Axis, spanning a week until the current date and time (Now).
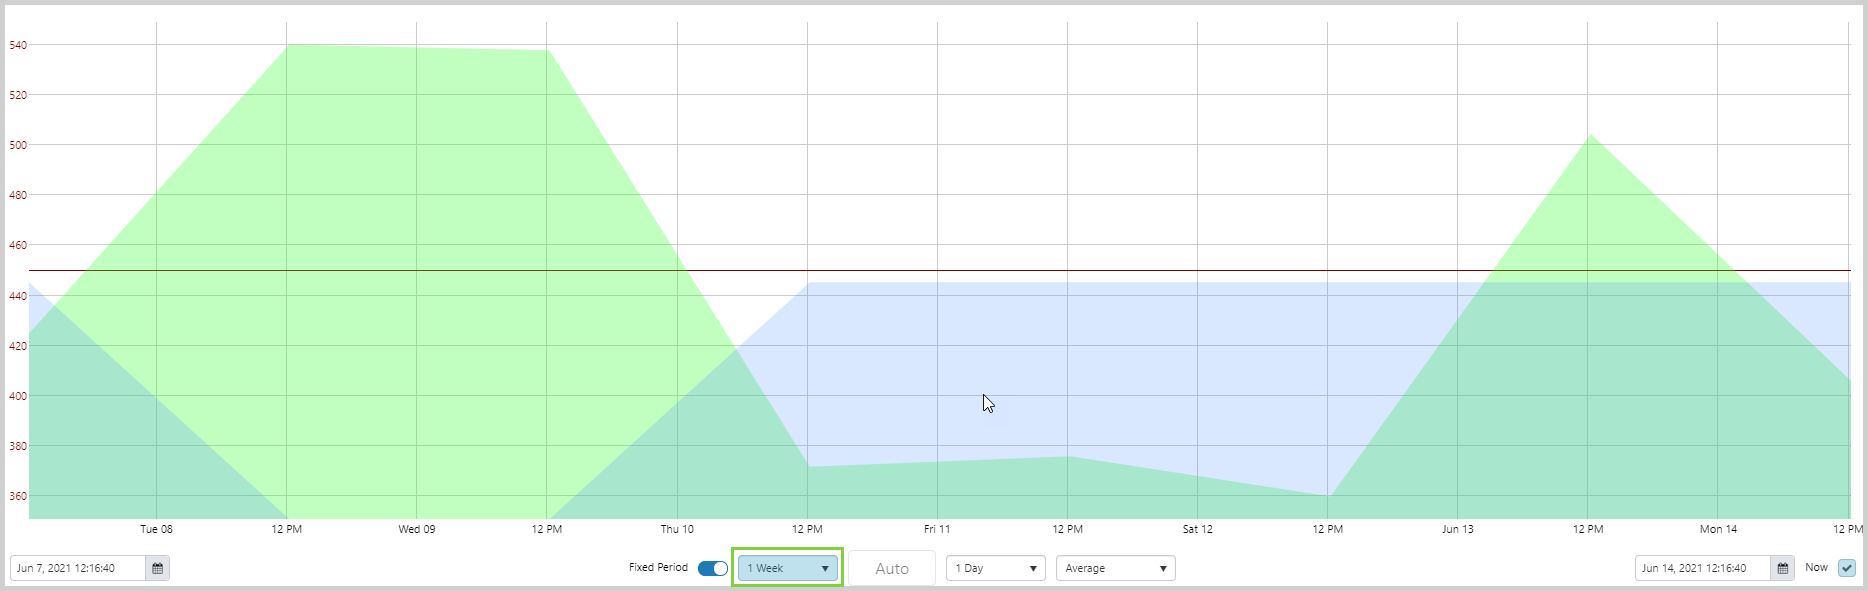
Step 2. Changing the Sample Interval
Here we have selected a 1 day sample interval. Note how the data points are at one day intervals.
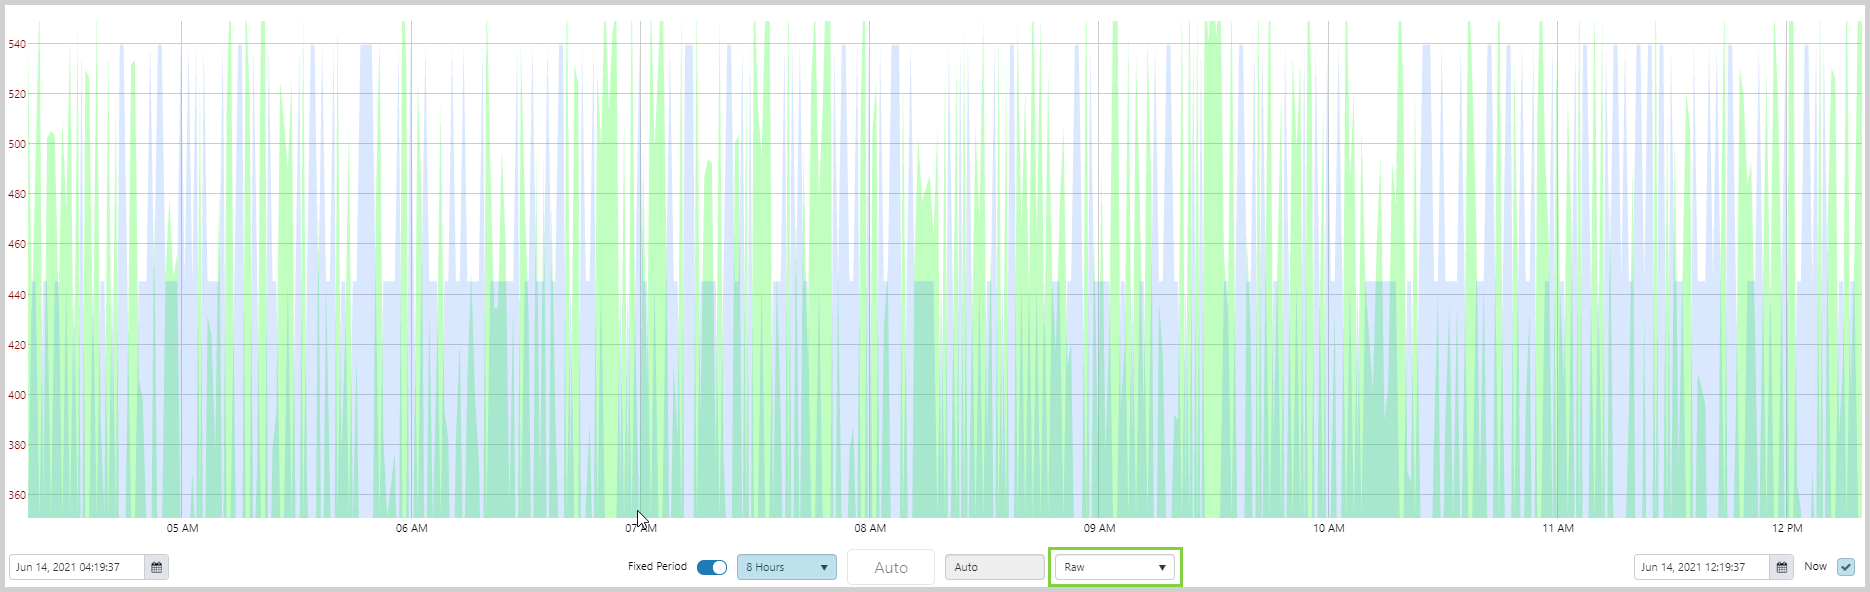
Step 3. Changing the Sample Method
Here we have selected the Raw sample method. Note how the duration is set to 8 hours and sample interval becomes Auto.
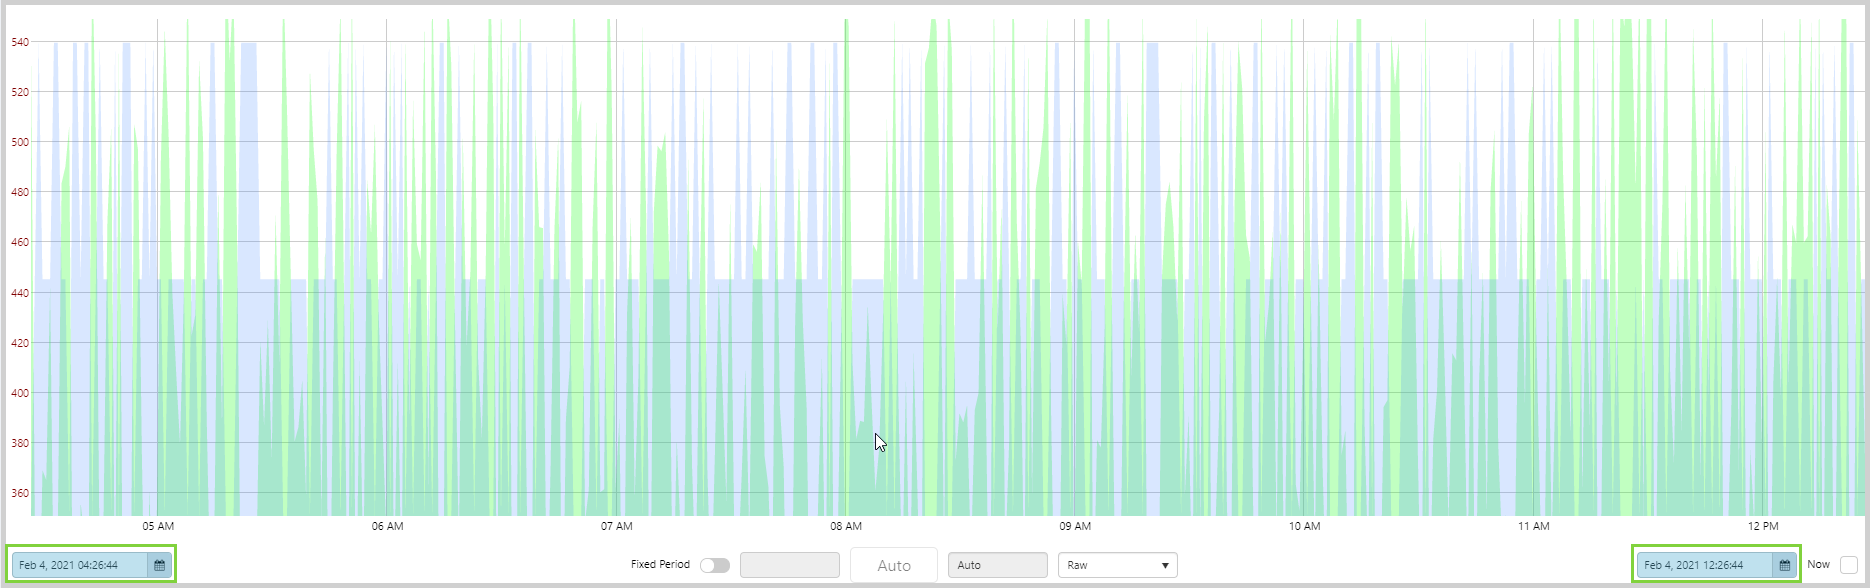
Step 4. Selecting Fixed Times
Here we have selected a period of 4 February 2021 04:26:44 AM to 4 February 2021 12:26:44 PM.
Tutorial 3: Range Selector
In this tutorial, we will change the time selections using the Range Selector, located below the Trace Window. The Range Selection works interchangeably with the Time trend controls to set your trend time range. The range selector has a highlighted section (Range Selection) that matches the time range set by the date pickers, with double that time period shown before the selection if Now is selected (for example, for a new trend).

Resizing the highlighted section (range selection)
1. Hover the mouse over the left or right edge of the highlighted section, until you see the mouse horizontal resize pointer ![]() .
.
2. Now click and drag to left or right. Note how the trend start and end time changes.
Moving the highlighted section (range selection)
1. Hover the mouse over the central portion of the highlighted section, until you see the mouse move pointer ![]() .
.
2. Now click and drag the whole highlighted section to left (earlier) or right (later). Note how the trend start and end time changes.
Tutorial 4: Hairline and Comments
Trace items on the trend can have comments associated with them. If you have a hairline, you can add and search for comments. If there are existing comments for a trace item, you can access the comments from the comment marker.
Comments from a Hairline
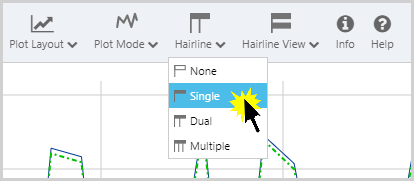
1. On the toolbar, select a hairline mode (Single, Dual or Multiple).
2. Click on the trace window, to add a hairline at that point in time.
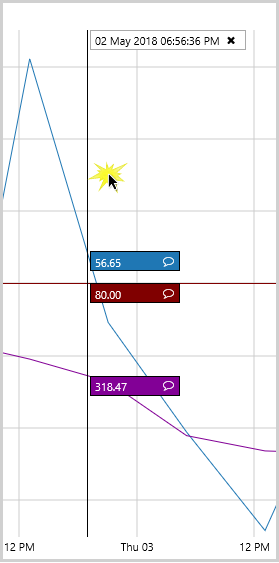
3. To add a comment to a trace item, click the comment ![]() icon. (Note how the Info Box expands to show the name of the data item when you hover over it.)
icon. (Note how the Info Box expands to show the name of the data item when you hover over it.)

The Comments panel opens for the trace item, in the Info Zone.
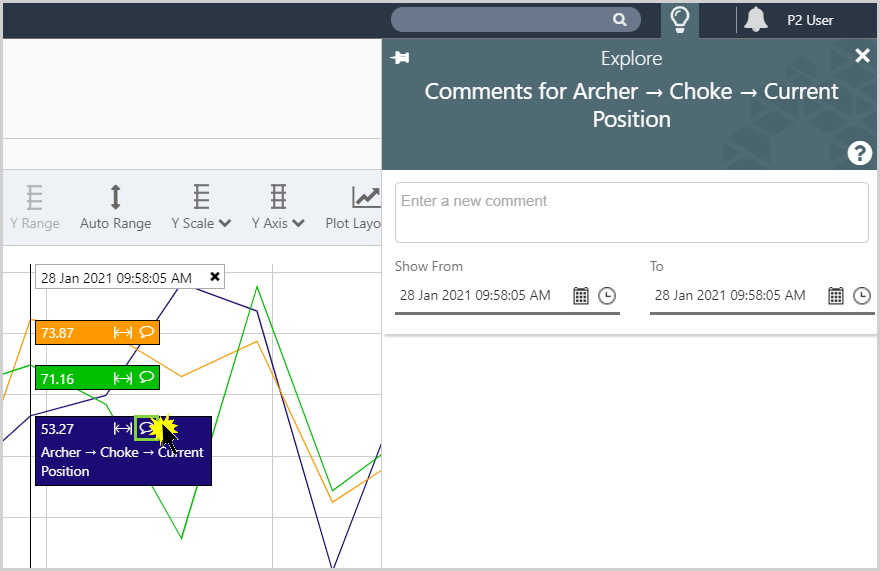
4. In the Comments panel you can:
- Add a new comment for that time.
- Search for other comments for the trace item, by changing the Show From and To dates and times.
Comments from a Comments Marker
An existing comment for a trace is marked by a comment marker in the same colour at the trace. The marker points to the time of the comment.
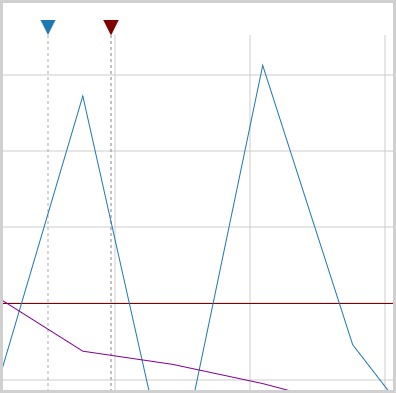
1. Click a comment marker to open the comments for the trace at that time. This appears in the Comments panel in the Info Zone.

2. In the Comments panel you can:
-
- Add a new comment for that time.
- Search for other comments for the trace item, by changing the Show From and To dates and times.
- View the comment for that time (and any replies). You can also edit, reply, or delete the comment - depending on your role privileges.
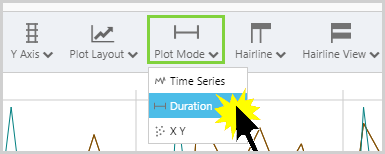
Tutorial 5: Duration Plot Mode
In this tutorial we will change to the Duration plot mode to view Time Windows.
1. Select Plot Mode from the Trends toolbar and Duration from the drop-down list.
2. The Time Windows table is automatically enabled and displays to the right of the Trace Table, if the Trace Table is currently displayed.
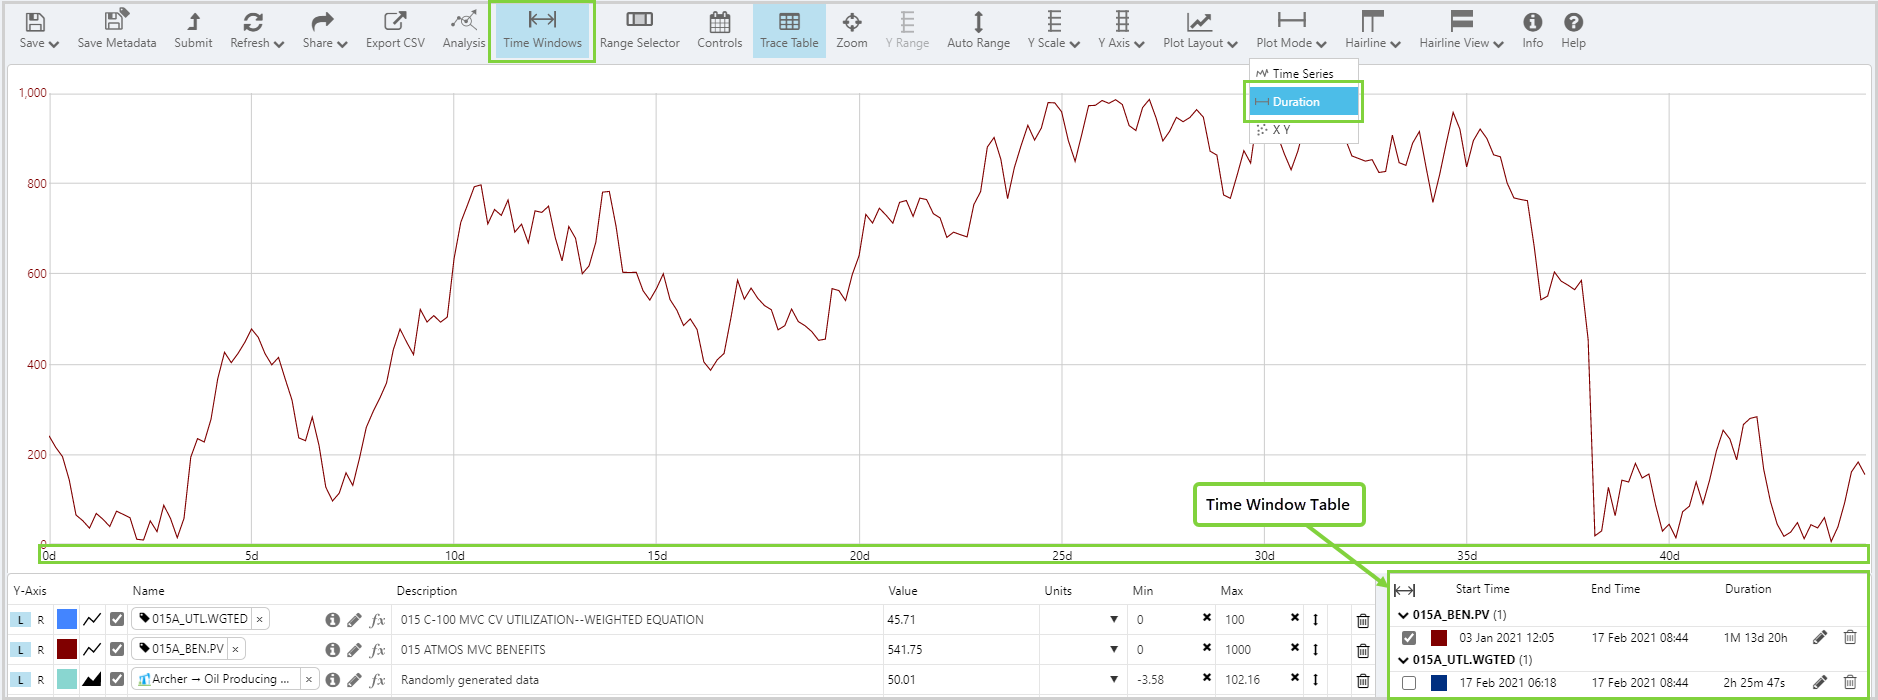
Note: In Duration mode the X-Axis starts at zero.
Tutorial 6: XY Plot Mode
Changing to XY Plot Mode can be done in a single step. In this tutorial we'll start by adding some items to the trend. Then we'll change the mode to see how the trend changes in XY mode. Next, we'll select a different X-Axis from the two trace items.
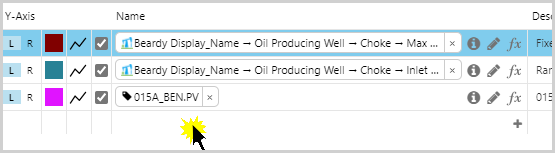
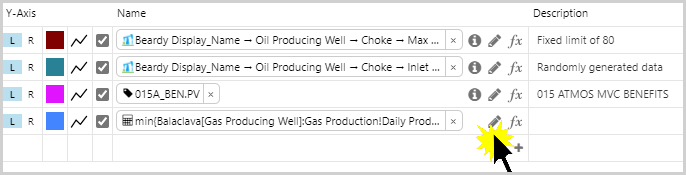
1. Drag and drop two attributes onto the trend, as well as a tag and a calculation.
In our example, we've used {Beardy Display_Name[Oil Producing Well]:Choke!Max Position} and {Beardy Dispay_Name[Oil Producing Well]:Choke!Inlet Pressure}, as well as tag {015A_BEN.PV} and a calculation Min({Balaclava[Gas Producing Well]:Gas Production!Daily Production}, 90).
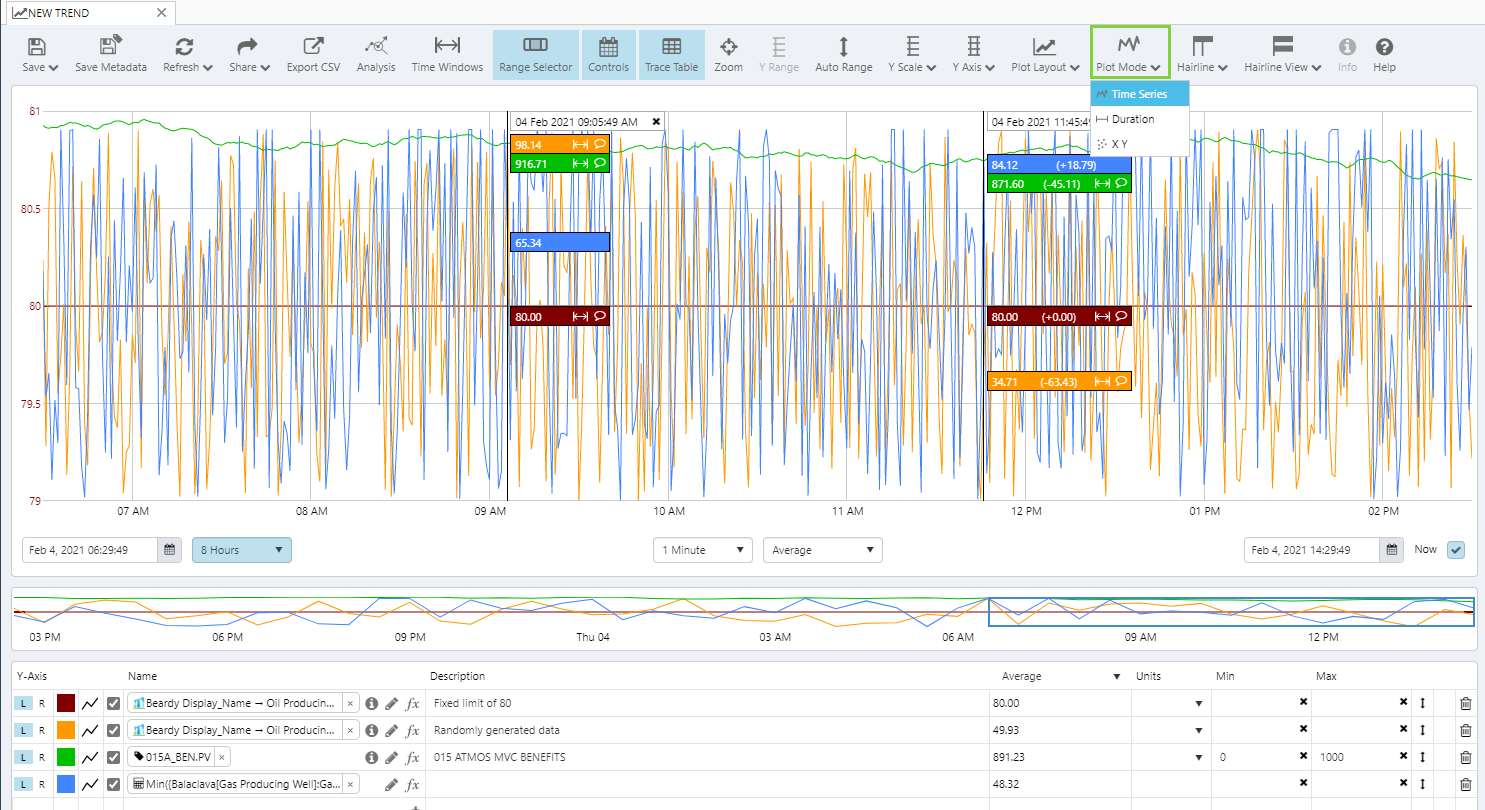 |
| The default mode for a trend is Time Series. Note how the times for the range selection are plotted along the X-Axis. |
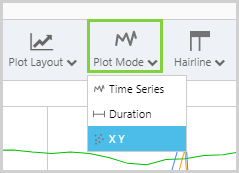
2. Change the Plot Mode to XY in the toolbar.
Note how the trace lines become dots. Also, note the changes in the Trace Table (the Trace Style and Value columns have been removed, and there is a new column for X-Axis).
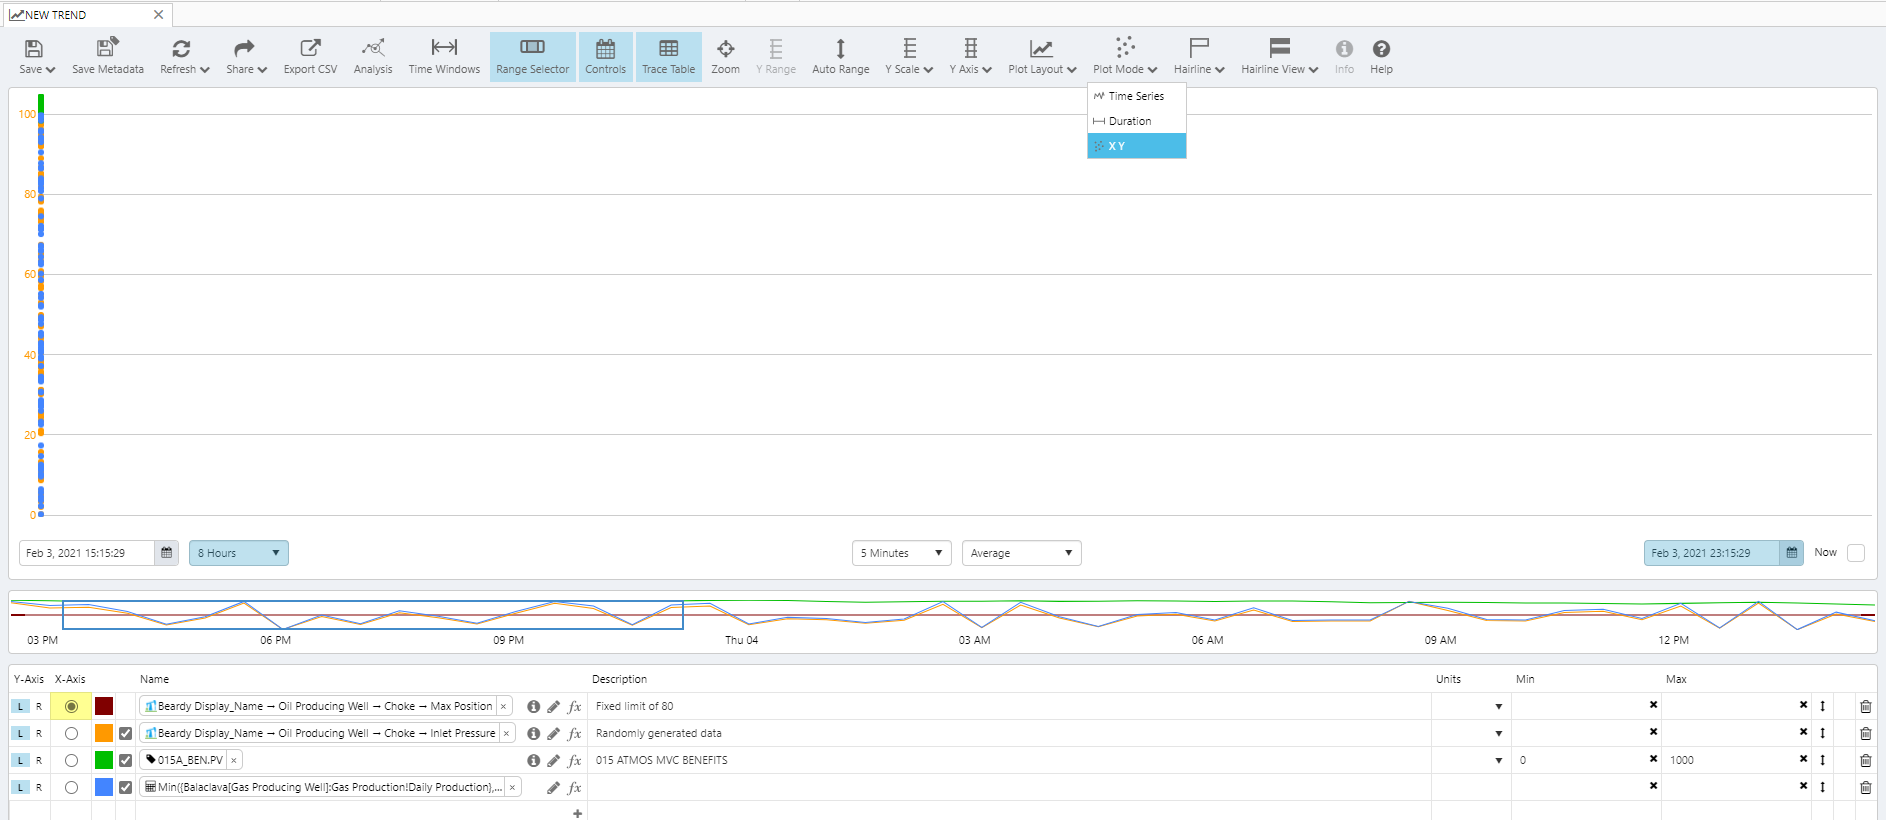 |
| In XY Mode, one of the trace items' values is used as the X Axis. Each dot on the chart is positioned at the XY co-ordinate of the Y trace item and the X trace item. |
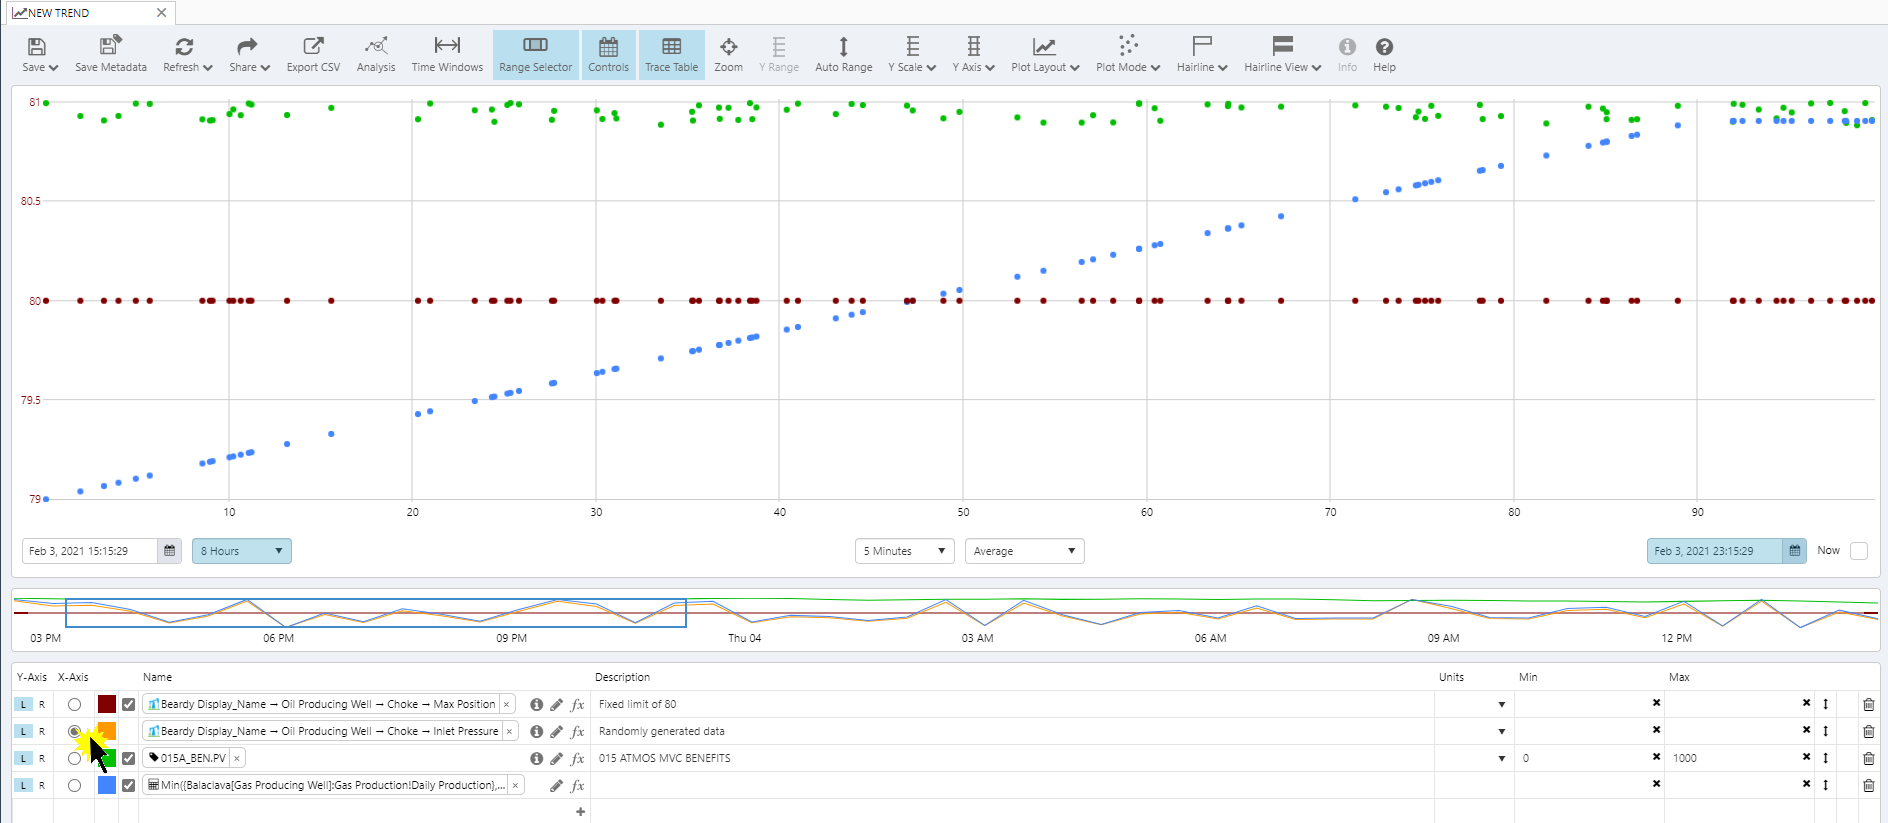
3. Click the X-Axis radio button next to the second trace item, and note how the chart changes.
Tutorial 7: Zoom Mode
If there is a particular portion of the trace that you want to see in more detail, for example an unexpected spike in values, you can zoom in to get a closer look.
Zooming changes the selected time range and sample interval, to give you an optimal view of the section you are interested in.
Zoom Mode
Before you can zoom, you need to be in Zoom mode.
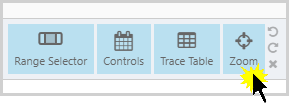
Click the Zoom button on the toolbar.
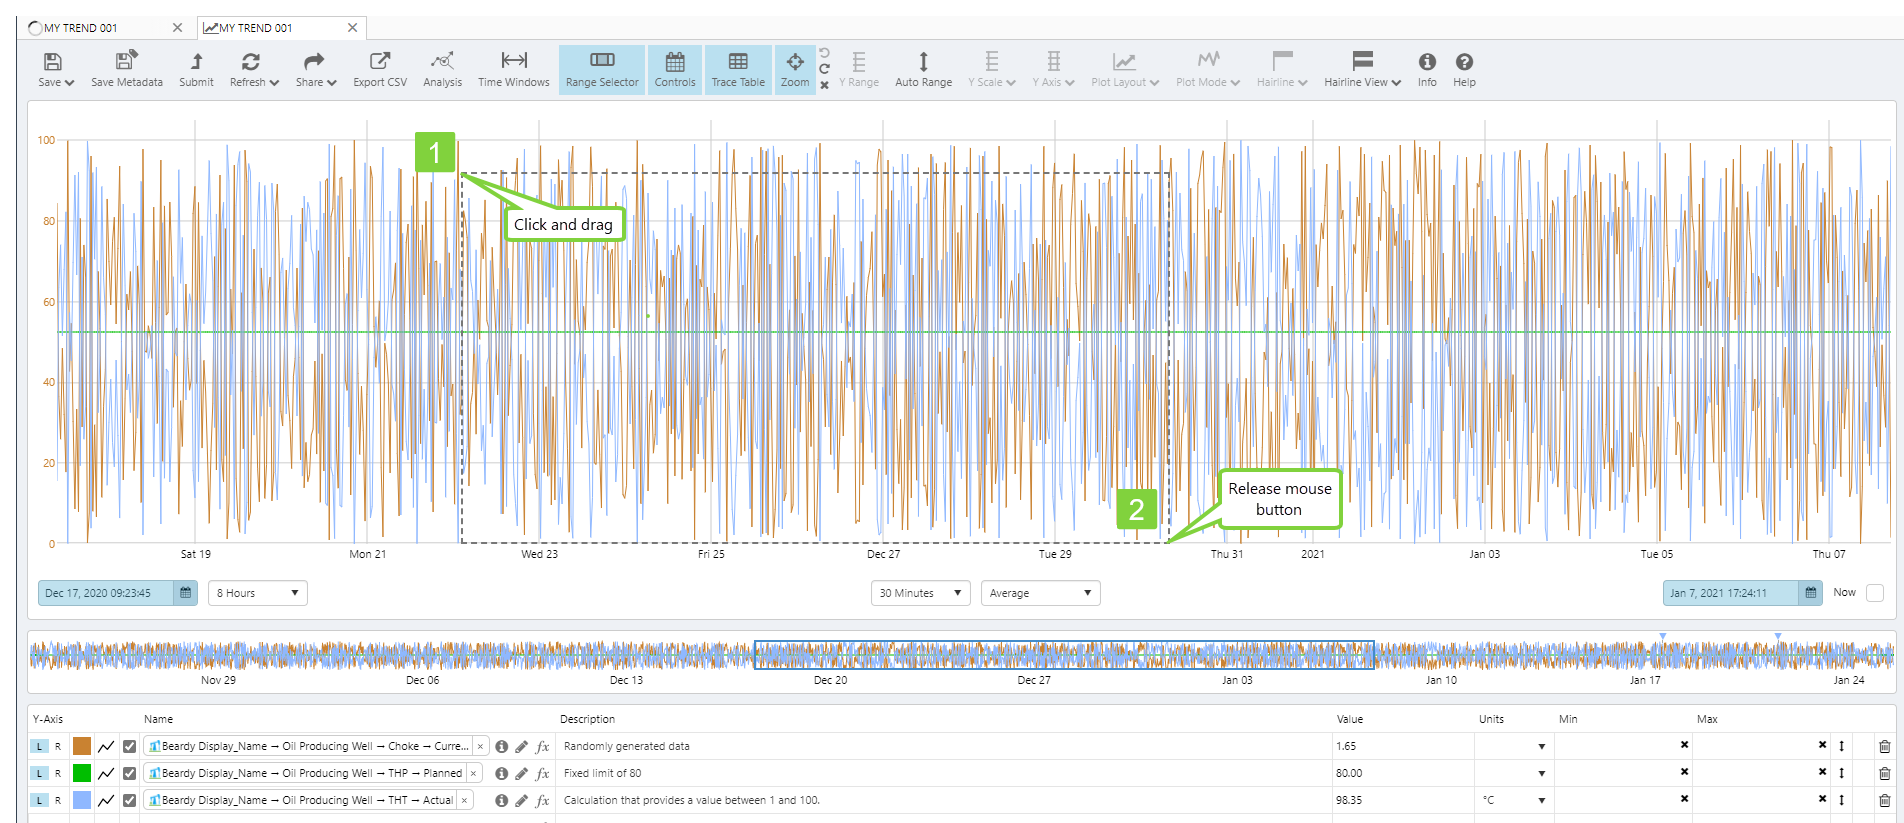
Zooming in the Trace Window
1. In the trace window, locate the area you want to zoom into, then click and drag.
You will see a dashed line tracing the movement of your mouse as you drag. This is marking the zoom area you are selecting.
2. Release the mouse button when you have finished selecting your area.
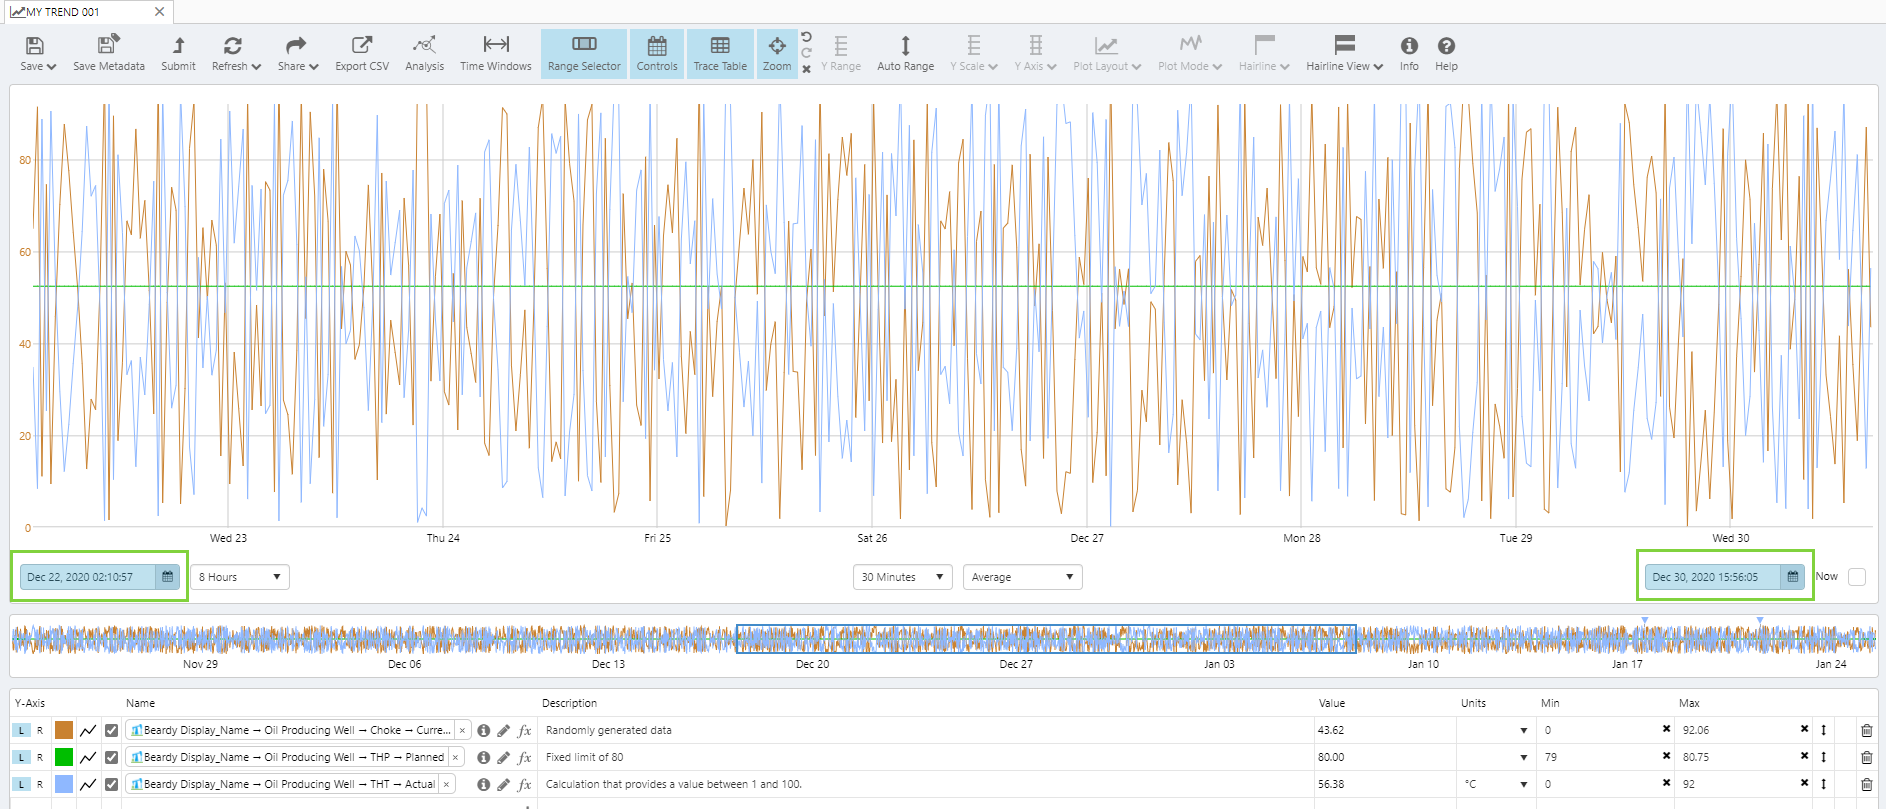
You will notice the whole trace area is now filled with the zoom area. The time range will match that of your selection, and the sample interval and method will have adapted for this smaller period.
3. To zoom in even further, repeat the click, drag and release action from the previous steps.
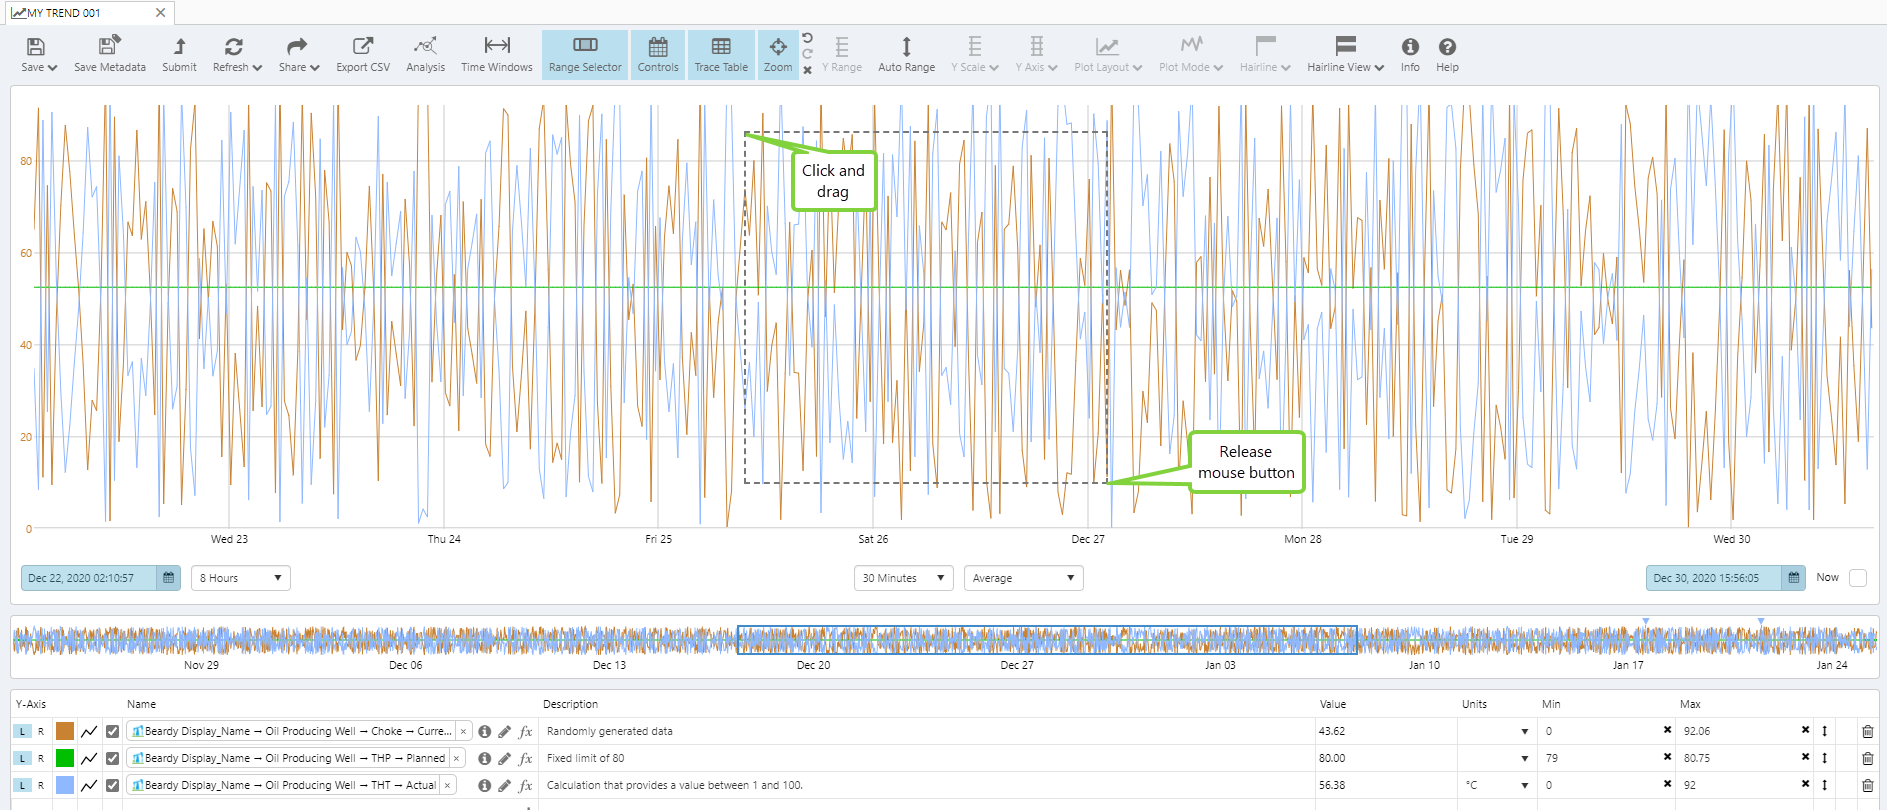
Continue to zoom in, until you have the desired granularity, or you have reached the maximum zoom level.
Tutorial 8: Viewing and Editing the Display Information
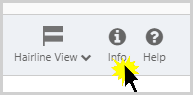
When a trend is saved, the Info button on the toolbar is enabled, and you can view information for that trend. If the trend is in a public workspace (that is, not My Workspace), you can view and edit Knowledge Management as well.
For a trend in a private workspace (My Workspace)
Click the Info button on the Trend toolbar.
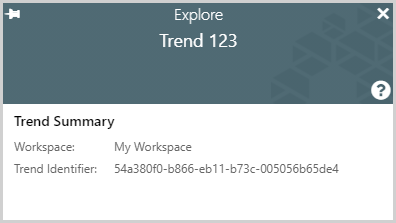
The Explore panel appears and displays the trend name (in bold), the workspace that contains the trend (Workspace), and the unique trend identifier (Trend Identifier).
For a trend in a public workspace
1. Click the Info button on the Trend toolbar.
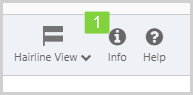
The Explore panel appears (as above), with additional fields Knowledge Management: Purpose and Instructions, and Commentary.
2. To edit the Knowledge Management or Commentary fields, click inside the relevant box.

3. Type a purpose into the Purpose edit box.
4. Type instructions into the Instructions edit box.
5. Type a comment in the Commentary edit box.
6. Click Save.
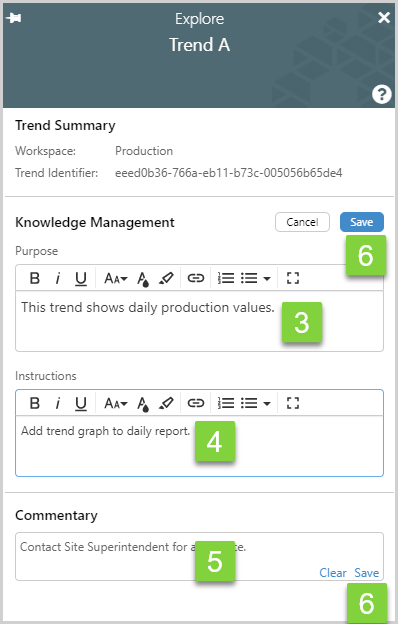
The display information is now complete for this trend. Other users can edit the Knowledge Management and Commentary portions if required.

Release History
- Creating a Trend 4.9.7 (this release)
- Range Selector switched off by default
- Manual Fetch button added to Trend Controls
- Data fetch time limit set in configuration file
- Creating a Trend 4.9
- Creating a Trend 4.6
- Creating a Trend 4.5.5
- Creating a Trend 4.5.3
- Creating a Trend 4.5.2
- Creating a Trend 4.5
- Creating a Trend 4.4.4
- Creating a Trend 4.3.2
- Creating a Trend 4.3.1