ON THIS PAGE:
A trend displays time-series data, such as tags, attribute values and calculations, over a selected period of time.
To create a trend, you can either open a new blank trend (click New Trend on the Home ribbon tab), and add tags, attribute values and calculations to this. Or you can open a trend from an Explorer Page control, such as an embedded trend, a line chart, or a data label, to trend data from the control (right-click on the control and select Open Trend). You can add extra data to this trend as well.
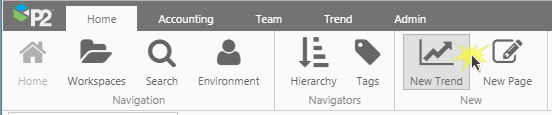
Creating a New Trend from the Home ribbon tab
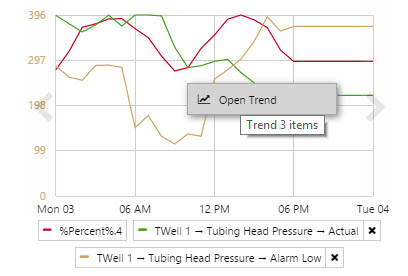
Opening a trend from an Embedded Trend on an Explorer Page
Overview
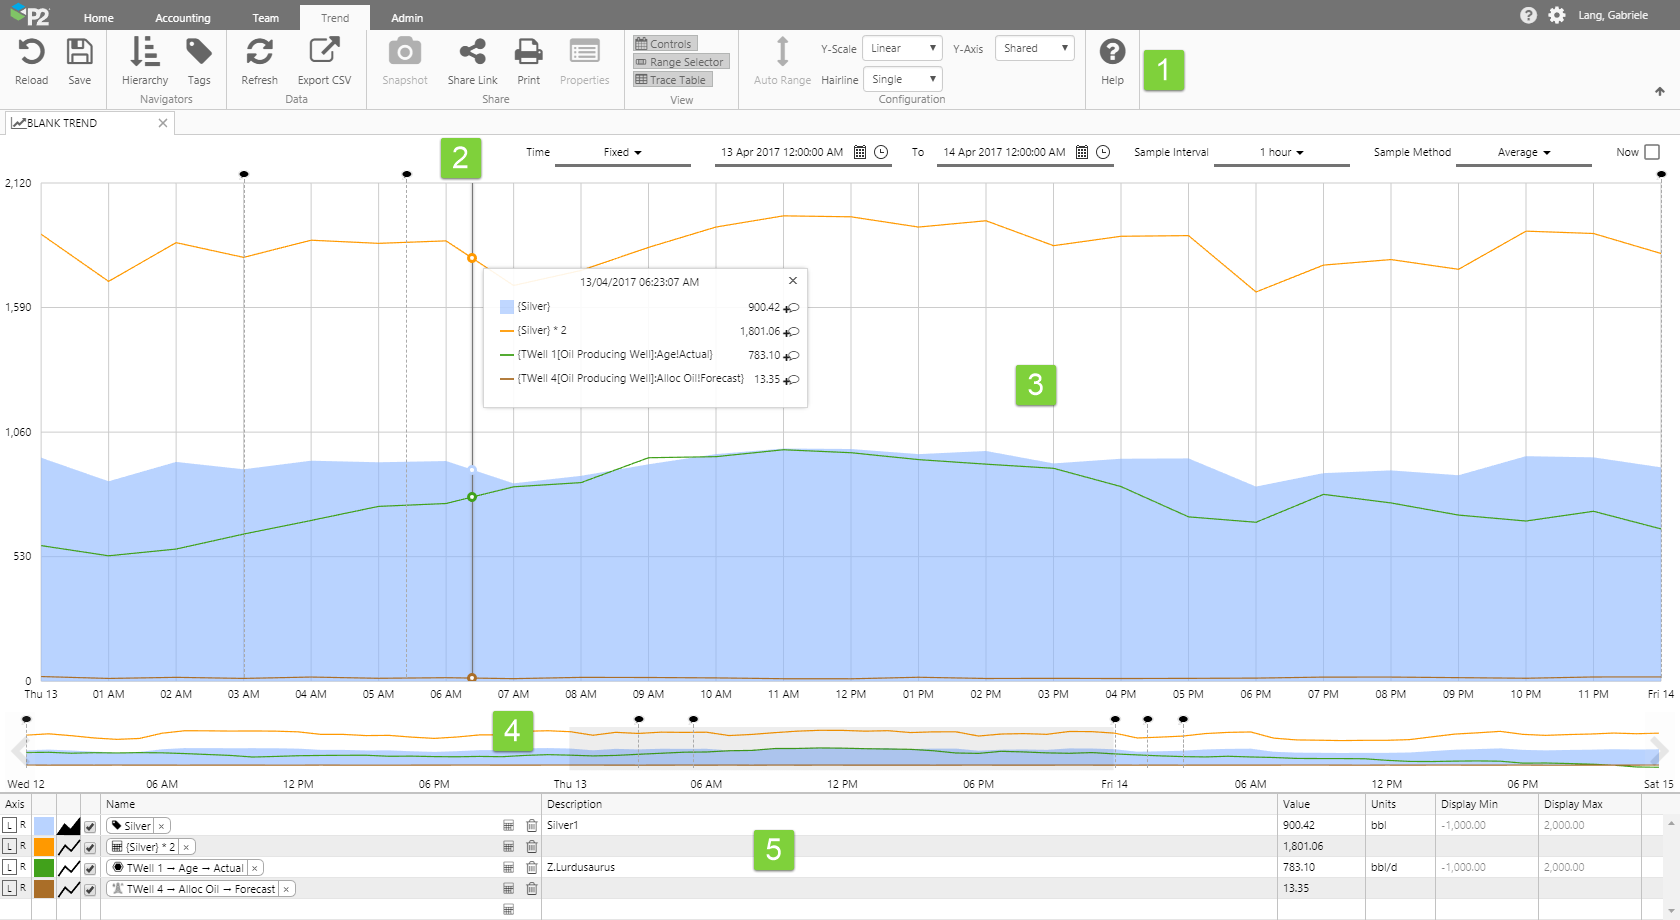
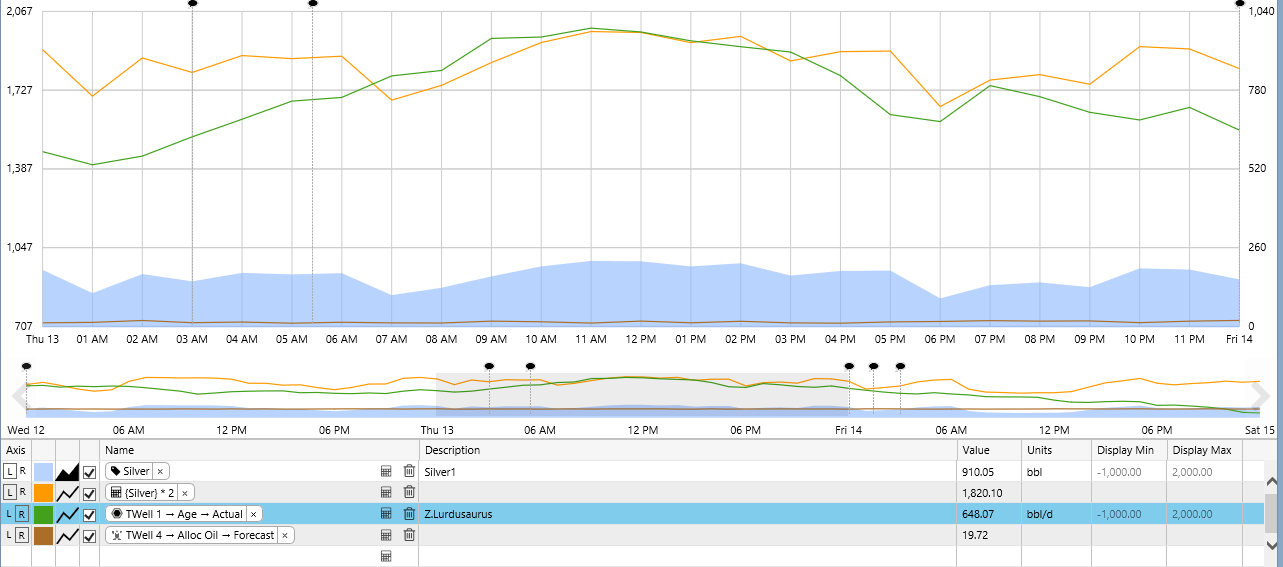
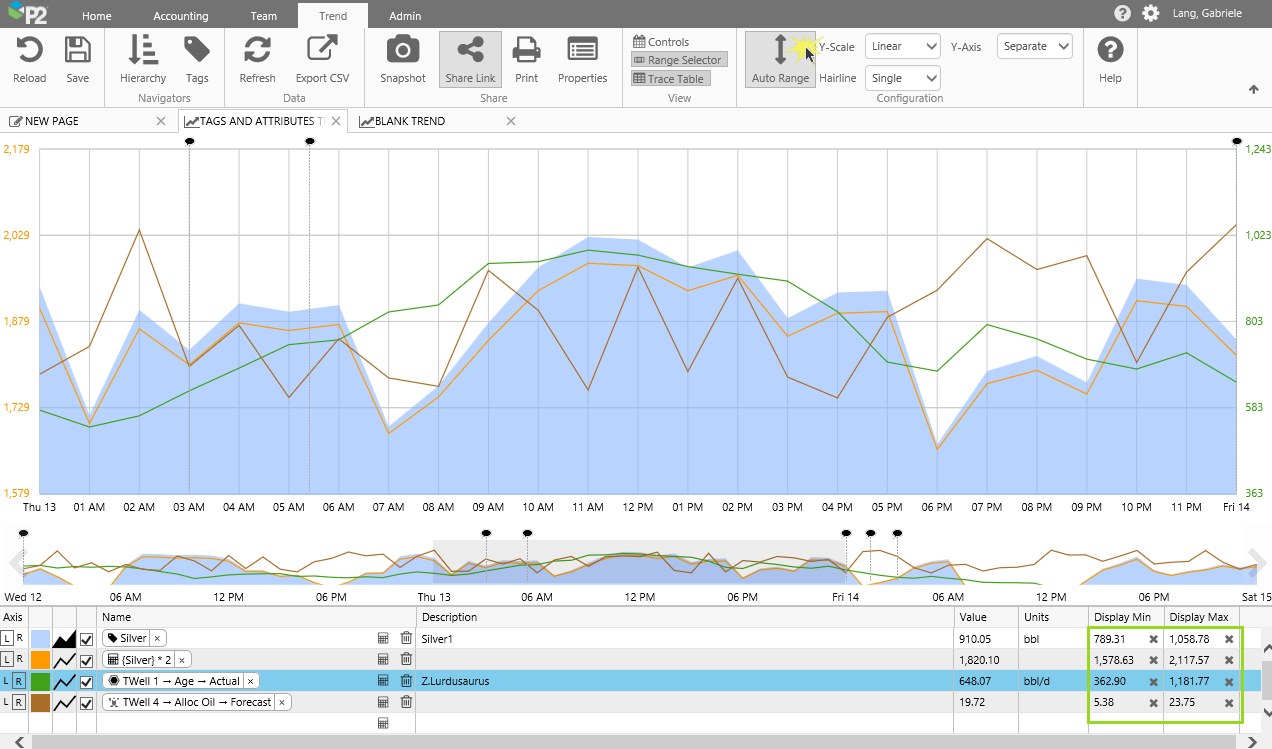
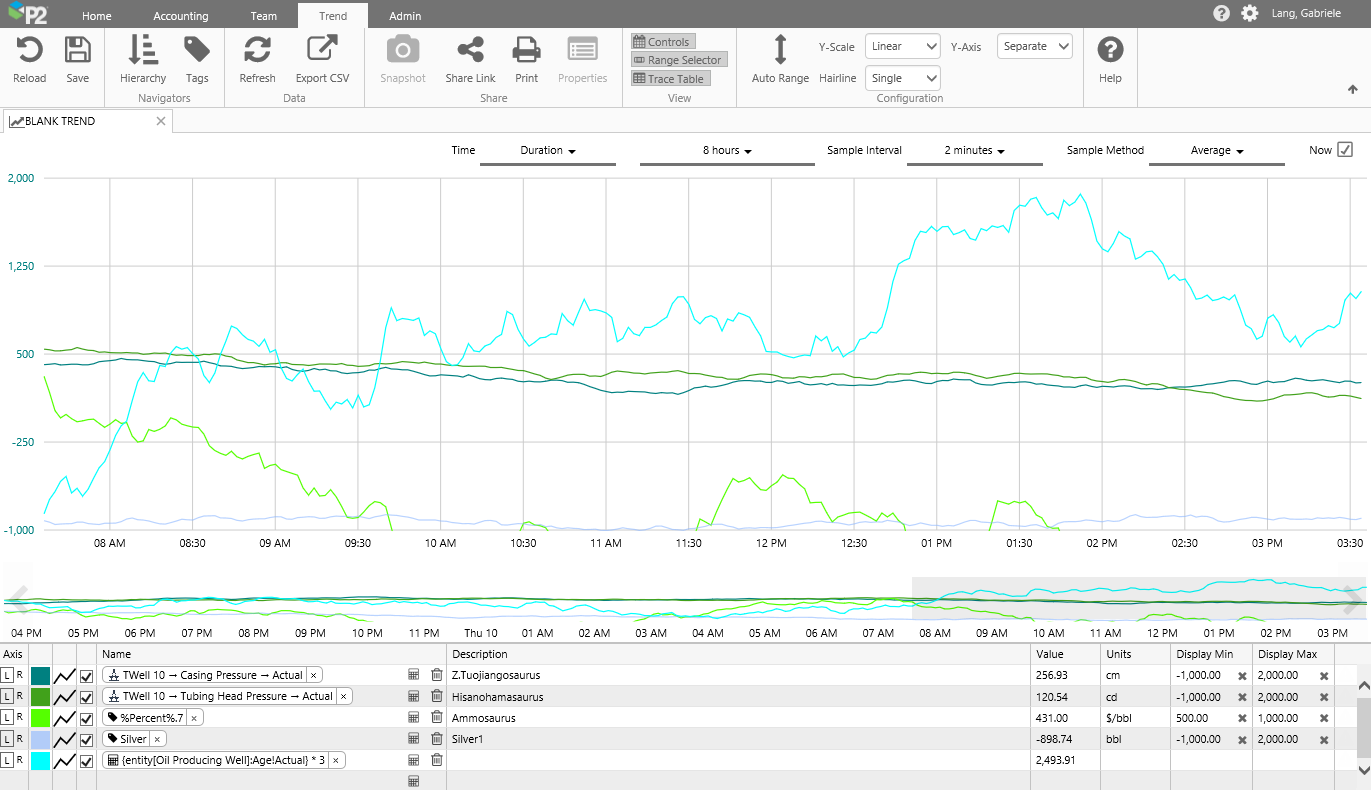
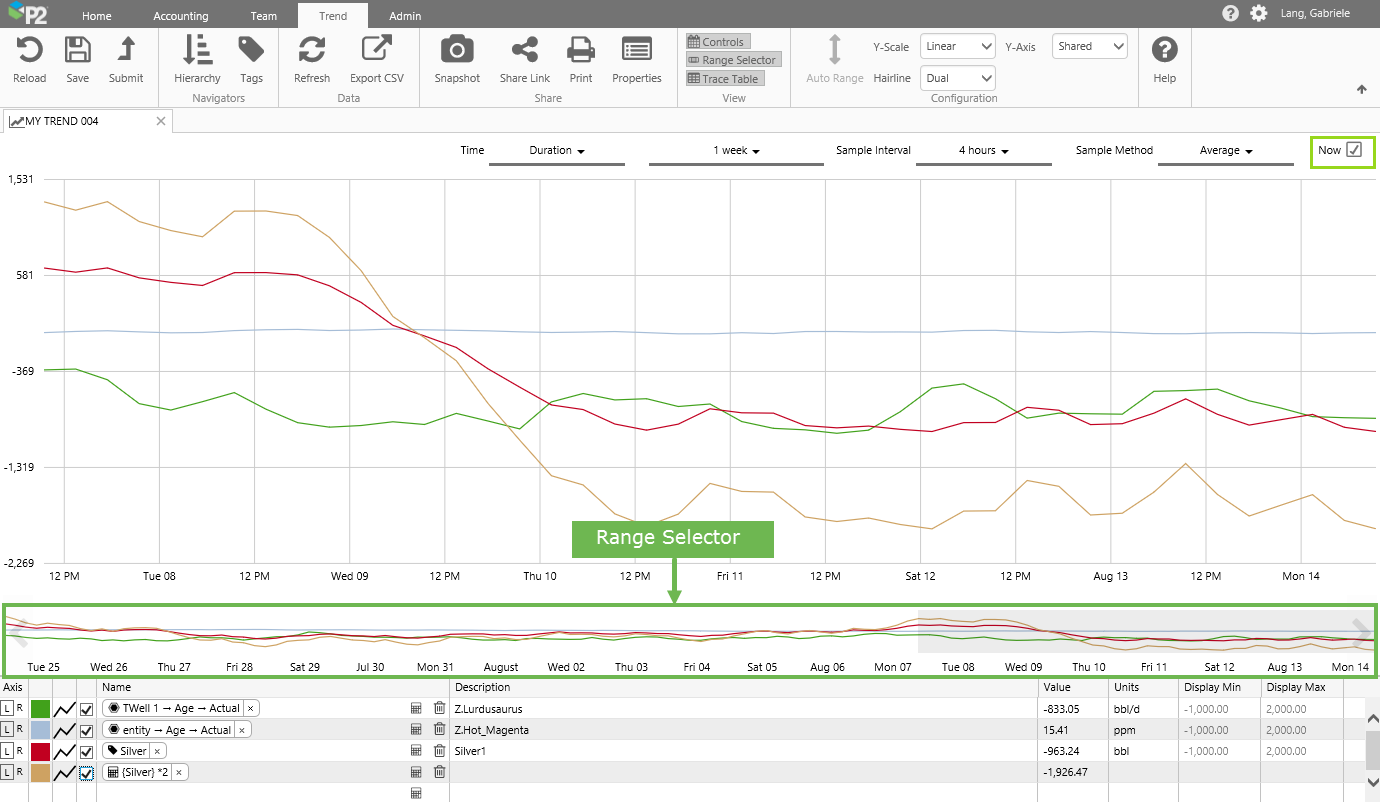
The screenshot below shows a new trend, with four traces. The trend has five main sections:
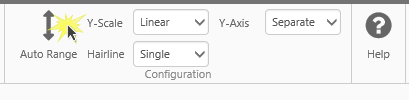
| 1. | Trend Ribbon Tab | The Trend Tab on the ribbon is activated whenever a trend is opened and is used for managing and sharing the trend, as well as refreshing data or resetting the trend, and choosing some of the trend configuration such as Y-Scale Type, number of allowable hairlines and what type of Y-Axis is used. Click Auto Range to reset the minimum and maximum values for the trace items, so that all data points are visible on the trend. |
| 2. | Trend Controls | The selections you make on the Trend Controls affect the time range of the chart, as well as the data collection method and interval. |
| 3. | Trace Window | Data is plotted on the Trace Window, along with hairlines and comments. |
| 4. | Range Selector | The highlighted section in the range selector matches the start and end of the trend time range. Use the range selector as a longer trend, to help identify highs and lows. You can select smaller periods within the range selector, to pick a new time range. |
| 5. | Trace Table | The Trace Table lists each item (attribute, tag or calculation) in the trend, along with its description, display minimum and maximum, and units. The table also displays values or statistics.
Use the functionality here to format each trace line (colour, trace style, visibility), add or remove trace lines, add or edit calculation traces, choose a Left or right Y-Axis, and manipulate display minimums and maximums. |
Trend Ribbon Tab

Use the buttons on this tab to manipulate the trend.
| Reload | Reload the trend to what is was since the last Save (or to a blank trend, if you’ve just started a new trend). E.g. If you add two new tags to the trend and then click ‘Reload’, these disappear. | Save | Save the trend. You can also save it as a different trend, by changing its name in the Save Trend dialogue. |
| Submit | Submit an unpublished trend. | Hierarchy | Toggle button: click to show/hide the Hierarchy Navigator. Use this to search for entities, with attributes to drag onto the trend. Hiding the Hierarchy Navigator enlarges the Trace Window. |
| Tags | Toggle button: click to show/hide the Tags Navigator. Use this to search for tags to drag onto the trend. Hiding the Tags Navigator enlarges the Trace Window. | Refresh | Refresh the data on the trend. (Note: To refresh current data at a steady rate, select ‘Now’ and choose a 'Duration' in the Trend Controls.) |
| Export CSV | Export the trend's data to a .csv file for downloading. | Snapshot | Save the current selections of the trend as a snapshot. Trend snapshots are accessible in the Trend Details window, in the trend's Workspace. |
| Share Link | Click to open the Share Trend dialogue. You can copy the trend's URL and Share the link, if you want another user to view the trend with its current selections. | Print the trend. Use your browser's print settings if required. For example, include background graphics in the settings. | |
| Properties | Open the Trend Properties panel for a summary of trend details. | Controls | Toggle button: click to show/hide the Trend Controls (date selectors, sample method and sample interval). Hiding the Trend Controls allows more space for the Trace Window. |
| Range Selector | Toggle button: click to show/hide the Range Selector. Hiding the Range Selector allows more space for the Trace Window, and also improves trend performance. | Trace Table | Toggle button: click to show/hide the Trace Table. Hiding the Trace Table allows more space for the Trace Window. |
| Auto Range | Click this to automatically update the individual display minimum and maximum values, so that all of your trace data points are visible on the trend. | Y-Scale | You can choose Log (uses logarithmic data points) or Linear (uses actual data points). Notes: Negative values cannot render in the logarithmic scale type. If a trend includes data points of zero, then instead of showing an error for the Log Scale Type, Explorer plots a point that is close to zero, and displays this as zero. |
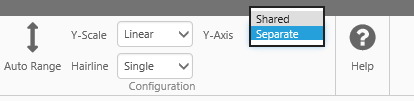
| Hairline | Choose the number of hairlines allowable on the trend (single, dual, multiple or none). | Y-Axis | If you select Shared from the Y-Axis drop-down list, then all traces on the Left Y-Axis (L) are plotted against a single, shared Left Y-Axis, while all traces on the Right Y-Axis (R) are plotted against a single, shared Right Y-Axis. If you want each trace to be plotted against its own axis, select Separate from the Y-Axis drop-down list. |
| Help | Open the Trends landing page on the P2 Explorer Help Center. |
Maximising the Trace Window
You can change the trend view to allow more space for the trace window.
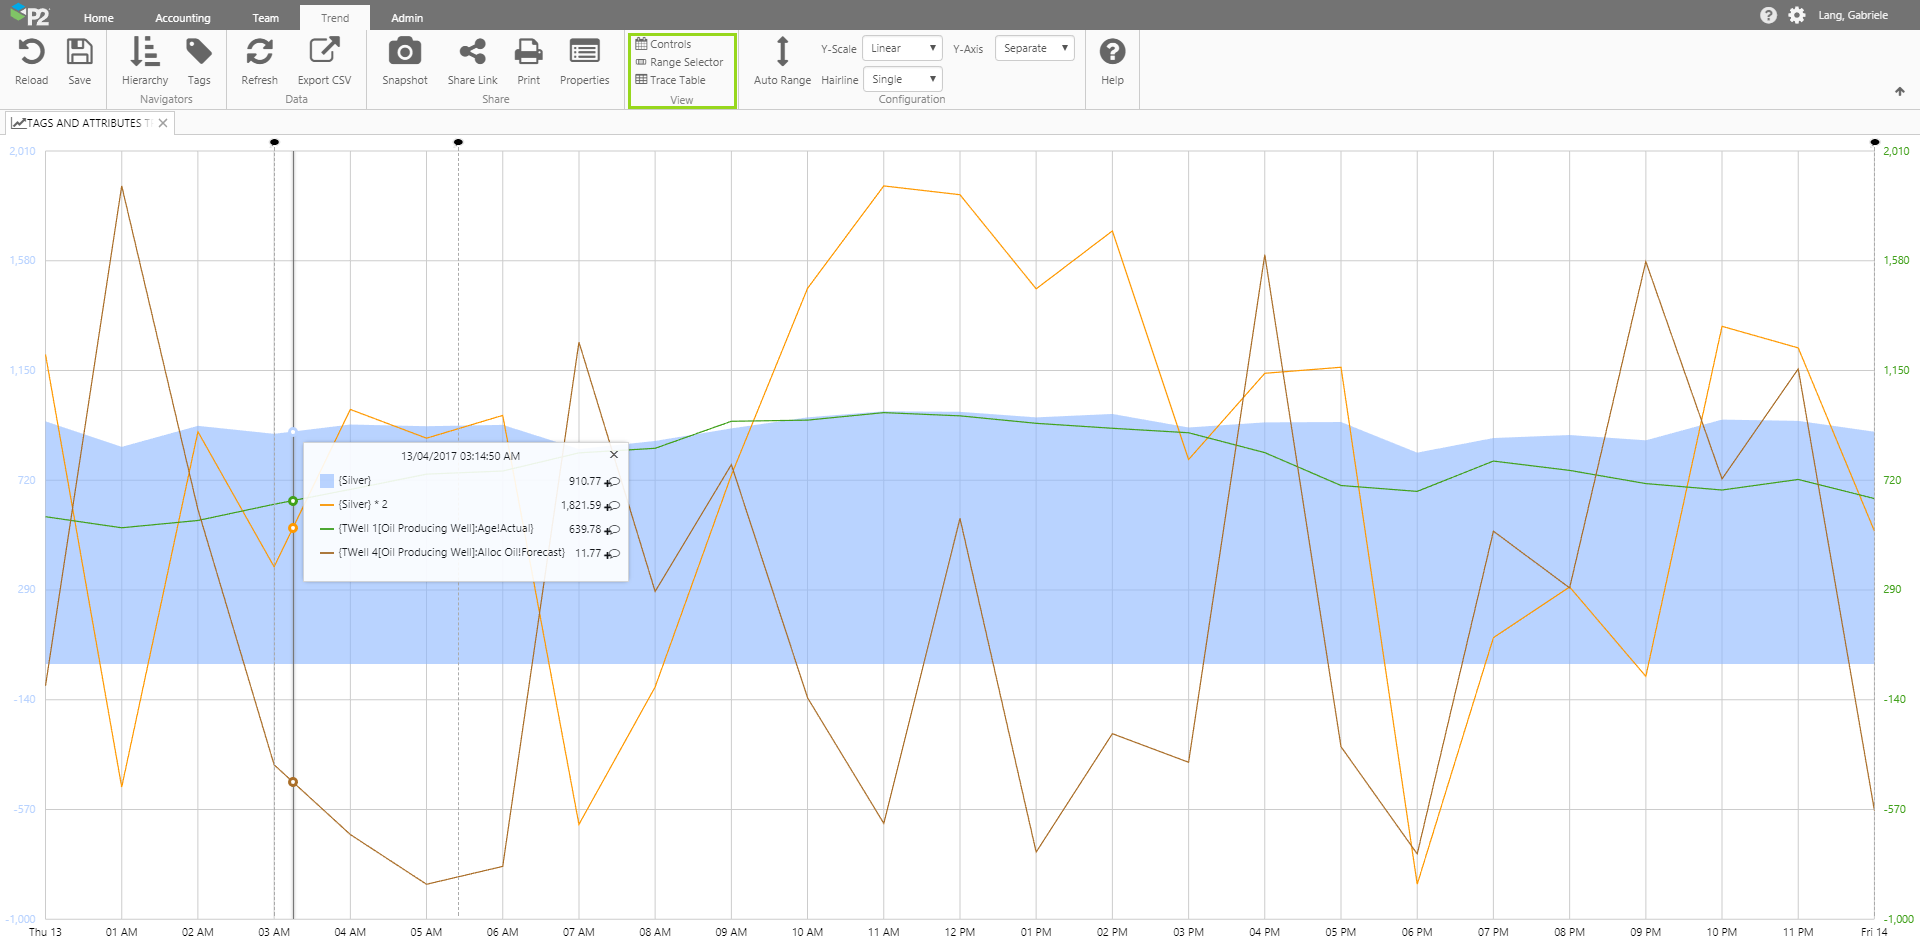
Click any of the buttons in the View group of the Trend ribbon, to hide the respective sections: Controls, Range Selector, Trace Table.

This is how the trend looks without the Controls, Range Selector, or Trace Table. Click any of the toggle buttons to show that section again.
Trend Controls
The selections you make on the Trend Controls affect the time range of the chart, as well as the data collection method and interval.
Read more about how P2 Server fetches the data using a sample method and a sample interval.
For a new trend, Now is pre-selected. This is how the controls look with Now selected:

| 1. | Time Setting | This is Duration where Now is selected. If you select Fixed, the Now check box is cleared. (The table below this one shows the controls where Now is cleared.) |
| 2. | Duration | This is the duration leading up to the current date and time (Now). To change the duration, select from the drop-down list (e.g. 8 hours, 3 days, 1 year). See Note below on sample method and duration, and how they work together . |
| 3. | Sample Interval | This is the sample interval (for example, 1 hour) that P2 Server uses to collect the trend data. See Note below for how the sample interval is calculated based on the trend's time range. |
| 4. | Sample Method | This is the sample method (for example, Average) that P2 Server uses to collect the trend data. See Note below on sample method and duration, and how they work together. |
| 5. | Now | When you select Now, the trend end time is the current time. This refreshes at the Sample Interval rate (with 30 seconds as the lowest refresh rate). You can also click the Refresh button on the ribbon for an immediate refresh. |
If you clear Now, the time controls change so that there is also an end time (labelled To). This is how the controls look with Now cleared:

| 1. | Time Setting | Select Duration or Fixed. |
| 2. | Duration or Start Time | If the time setting is Duration, then this is the duration leading up to the trend end time (To). To change the duration, select from the drop-down list (e.g. 8 hours, 3 days, 1 year). See Note below for how sample method and trend duration work together. If the time setting is Fixed, then select the range start date and time from the Date/Time Picker. |
| 3. | To | This is the trend end time. To change the end time, select a date and time from the Date/Time Picker. |
| 4. | Sample Interval | This is the sample interval (for example, 1 hour) that P2 Server uses to collect the trend data. |
| 5. | Sample Method | This is the sample method (for example, Average) that P2 Server uses to collect the trend data. See Note below on sample method and duration, and how they work together. |
| 6. | Now | When you select Now, the trend end time is the current time. This refreshes at the Sample Interval rate (with 30 seconds as the lowest refresh rate). You can also click the Refresh button on the ribbon for an immediate refresh. (The table above this one shows the controls where Now is selected.) |
Notes on the Trend Controls
For performance reasons, the options available in the controls are interdependant.
- If Raw is selected, the time setting becomes Duration and the duration is selected as 8 hours. The limit of 8 hours can be updated in Explorer's web.config file (MaximumRawDuration). You can choose a different duration from the available options, which also vary depending on the Sample Method.
- The available Sample Intervals change depending on the trend's selected time range. The longer the trend's time range, the larger the available sample intervals are. This prevents too much data being requested (for example, you cannot request one year of data at a 20 seconds sample interval).
The Trace Table
The trace table displays each trace item. Note that you can only add 20 items, and a warning message appears if you attempt to add more than this. You can configure your trace items by updating the table, and you can add or remove trace items in the table. Your selections are saved when you save the trend, and you can also save your selections to a snapshot of the trend.
To adjust the height of the Trace Table, click and drag its top border.
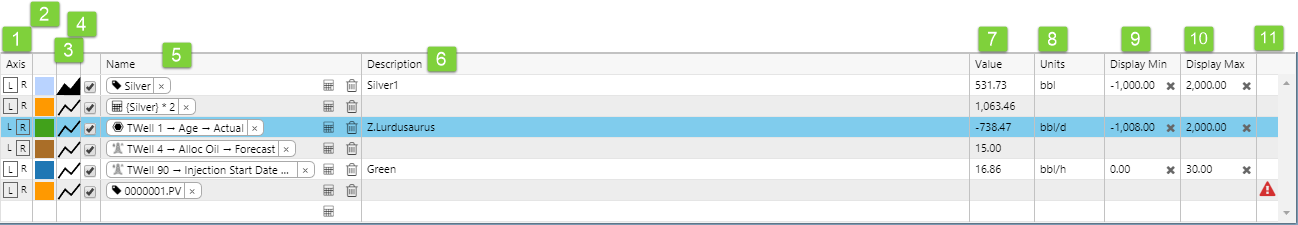
| 1. | Axis | Trace items get a Left Y-Axis by default. Click L to give an item a Left Y-Axis, and click R to give an item a Right Y-Axis. | ||||||||||
| 2. | Colour | To change the trace colour, click to open the colour wheel, then select a colour or choose a custom colour where you can also set opacity. | ||||||||||
| 3. | Style | To change the trace style, click to open the style wheel, then select from Line, Area, Dot, Step Before, and Step After. | ||||||||||
| 4. | Show/Hide Trace | Select this to hide the trace, and de-select to show it again. | ||||||||||
| 5. | Name | The trace Name is a full display name of the item which is a tag, attribute value, or calculation. An attribute value could have an underlying value of a tag or a calculation.
You can drag an item onto the trend, and the name will insert into a new row automatically. Or you can type a name in, using Auto-Complete. |
||||||||||
| 6. | Description | The description from the underlying tag or calculation. | ||||||||||
| 7. | Value | This shows the values for the respective items in the trace. If the trend has hairlines, then this is the current value from the latest hairline that was added or moved; otherwise, it is the current value from the end-time of the selected time range for the trend. | ||||||||||
| Dual Hairline Statistics | The Value column changes to a drop-down list of Dual Hairline Statistics options, if the trend is in Dual hairline mode, and if two hairlines are selected. Select from one of the following options: | |||||||||||
|
||||||||||||
| Note: The values and statistics in the trace table are calculated using the last known value before each hairline position, whereas the hairline information panel shows the interpolated value at the hairline position. | ||||||||||||
| 8. | Units | The units from the underlying tag or calculation. | ||||||||||
| 9. | Display Min | The minimum value from the underlying tag or calculation's Display Range (on P2 Server). Click in the box to edit the value. To reset its minimum value as stored in P2 Server, click the |
||||||||||
| 10. | Display Max | The maximum value from the underlying tag or calculation's Display Range (on P2 Server). Click in the box to edit the value. To reset its maximum value as stored in P2 Server, click the |
||||||||||
| 11. | Indicators | Any issues with the data or the data fetch are indicated by an error icon. Hover over the icon to view error details. |
Trace Name
The item’s Name in the trace table has the following features:
- The name is preceded by an icon, indicating what it is.
- There is a calculator icon
 linking to the Calculation Editor.
 - There is a trash icon
 for removing the trace from the trend.
 - The Name edit box has auto-complete functionality for tags and attributes.
- The name for an attribute value is displayed as: Entity -> Attribute -> Attribute value
The following icons provide information regarding the trace item:
| Icon | Item | Icon | Item |
|
|
Tag |
|
An invalid definition, for example an incomplete attribute definition |
|
|
Calculation |
|
Templated attribute |
|
|
Attribute: this is the icon for the entity’s primary template, and varies, for example |
OR Attribute (where the entity’s primary template does not have an icon) |
Auto-Complete Trace Name
When you start typing a name directly into the Name column for a new item in the trace table, a list of tags, calculations and entities appears, where the name or description matches the search text.
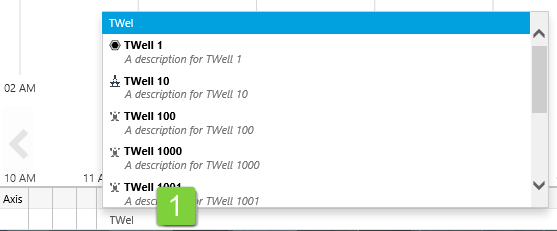
If you are adding an attribute value, you can do this using auto-complete, starting with the entity name, and qualifying until you have the attribute value, as shown in this table:
| 1. Type in part of the entity name, then select an entity (TWell 1) from the list of entities and tags.
|
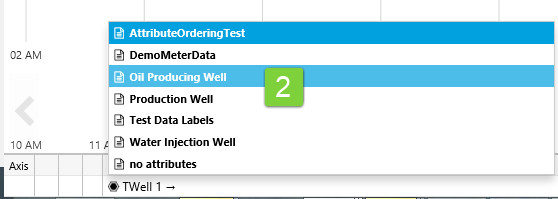
| 2. Select a template (Oil Producing Well) from the list of templates for that entity.
|
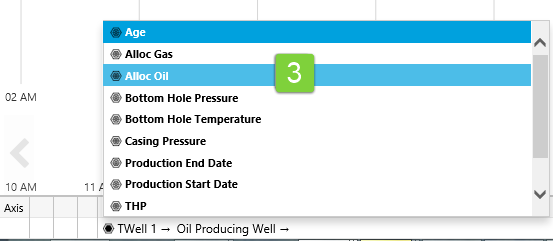
| 3. Select an attribute (Alloc Oil) from the selected template’s list of attributes.
|
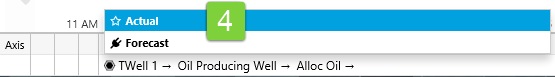
| 4. Select an attribute value (Actual) from the selected attribute’s list of attribute values.
|
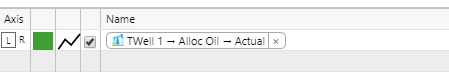
| The fully-qualified display name appears in the Name column of the trace table.
|
Calculation Editor
Each item in the trace table has a calculator icon ![]() in the Name column, linking to the Calculation Editor.
in the Name column, linking to the Calculation Editor.
Click the calculator icon to open the Calculation Editor.
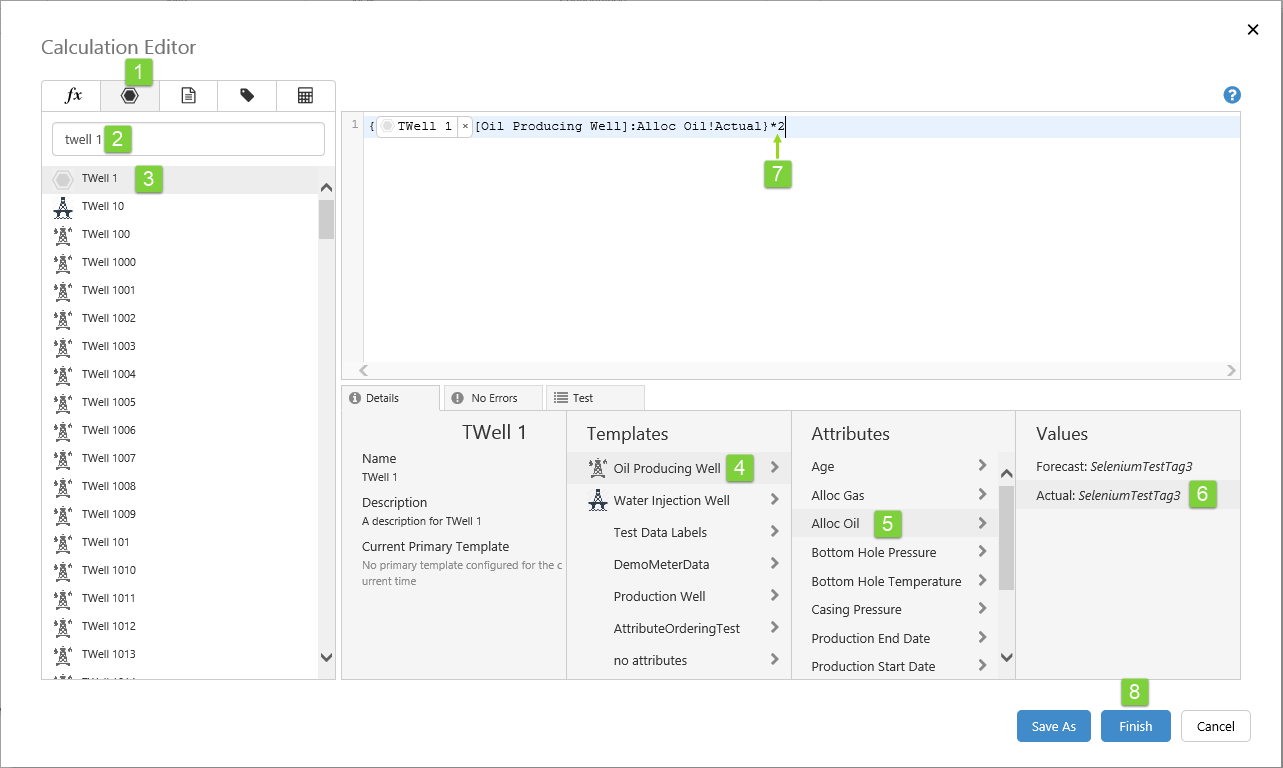
Use the Calculation Editor to build expressions using components from the Component Selector, and to validate these expressions as you build them. You can also preview calculation results.
In the example below, we search for an entity from the entity list, then choose an attribute value to add to the expression. We multiply the attribute value by 2.
|
|||||||||
|
Editing a Calculation
To edit a calculation from the trend, or save to a new calculation, click the corresponding calculator icon in the trace table.
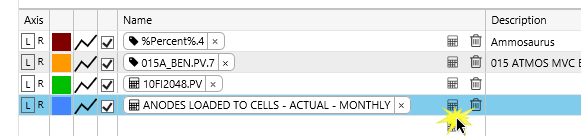
The Calculation Editor opens, to show the calculation.
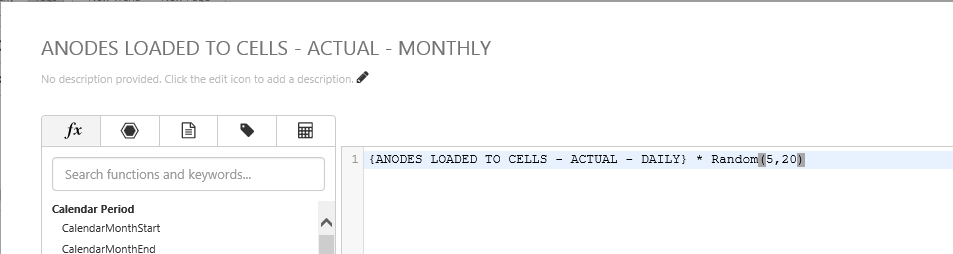
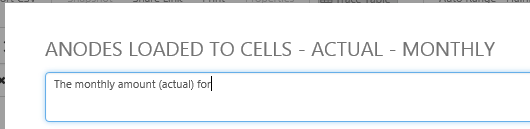
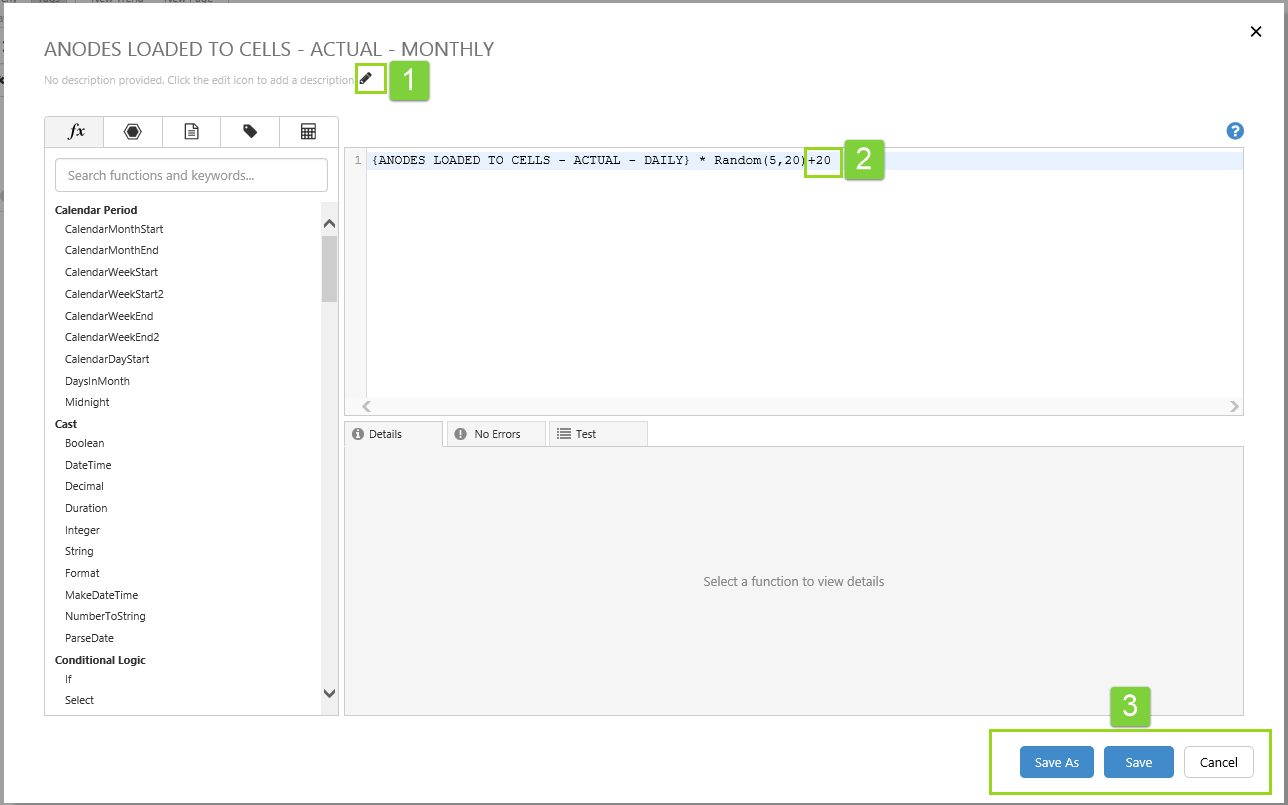
1. To edit the calculation’s description, click the pencil icon next to the description, then update the contents of the description edit box which appears below the calculation name.
2. Edit the calculation expression in the expression edit box.
3. If you edit the calculation or its description, you have the option to save the changes to the existing calculation (click Save), save the changes to a new calculation (click Save As), or click Cancel to exit the calculation editor.
If you cancel, and there are unsaved changes, a confirmation dialog gives you an opportunity to still save the change.
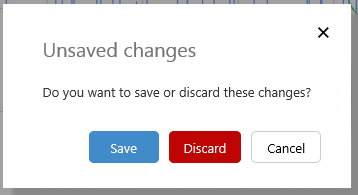
Click Save to save your changes, Discard to discard changes, or Cancel to return to the calculation editor, which still has your unsaved changes.
You can save the unchanged calculation to a new calculation, by clicking the Save As button. This opens a dialog for the new calculation’s Name and Description.
Trace Table Keyboard Shortcuts
When you have focus in the trace table, you can use any of these keyboard shortcuts:
- Arrow Keys: Use the up and down arrows to select a new item in the trace window. If you are editing the Display Min or Display Max of a trace item, use the up and down arrows to increase/decrease by 1.
- Delete Key: Remove the selected trace from the trend.
- Esc Key: Cancel out of whatever you are editing.
- Spacebar: Toggle between showing and hiding the selected trace item.
Trace Window
Data is plotted in the trace window, along an X and one or two Y-Axes (left and right).
You can place one or more hairlines on the trace window, to see the trace data in more detail detail for a particular point in time; you can also add comments from a hairline's information box.
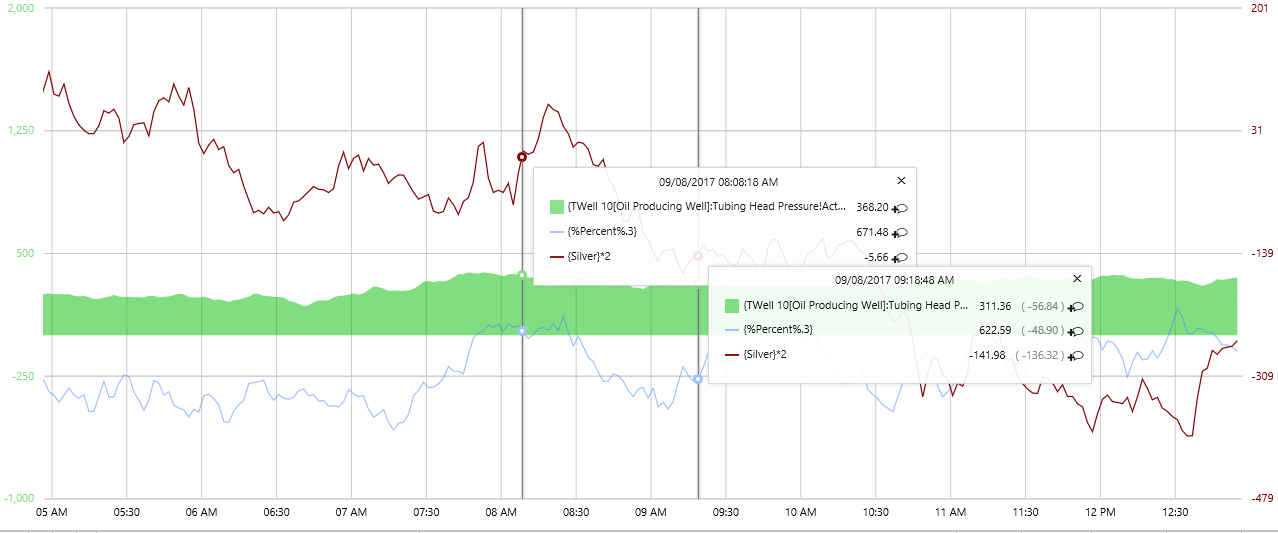
The Trace Window with two hairlines
Determining the Y-Axes
The left and right y-axes can be rendered in various ways. Axes can be shared or separate. When separate axes are selected, you can update the default display minimum and display maximum by manually updating, clicking Auto Range, or resetting to their stored values. The different display minimums and maximums help to determine how the axes are rendered, and also how the traces are plotted within the trace window.
Use the trace table and the configuration buttons on the ribbon to manipulate the Y-Axes, as described in the next sections.
Separate or Shared Y-Axis
You have the option of plotting each trace item against its own axis (Left or Right). Note that even if you choose separate Y-Axes, there is still only one rendered Y-Axis for Left, and one for Right.
Separate Y-Axis
If you want each trace to be plotted against its own axis, select Separate from the Y-Axis drop-down list.

The left Y-Axis renders for the first left Y-Axis item in the trace table. The right Y-Axis renders for the first right Y-Axis item in the trace table.
If you select an item in the trace table, then the left or right Y-Axis re-renders for this item.
Selecting the Left and Right Y-Axes from the Trace Table
You can control the rendered Left and Right Y-Axes by clicking on one either a left Y-axis item, or a right Y-axis item. If there is no selection, then the most recently selected left/right Y-Axis is rendered.
Each Y-Axis (Left/Right) is rendered in the colours of the corresponding left Y-Axis/Right Y-Axis item.
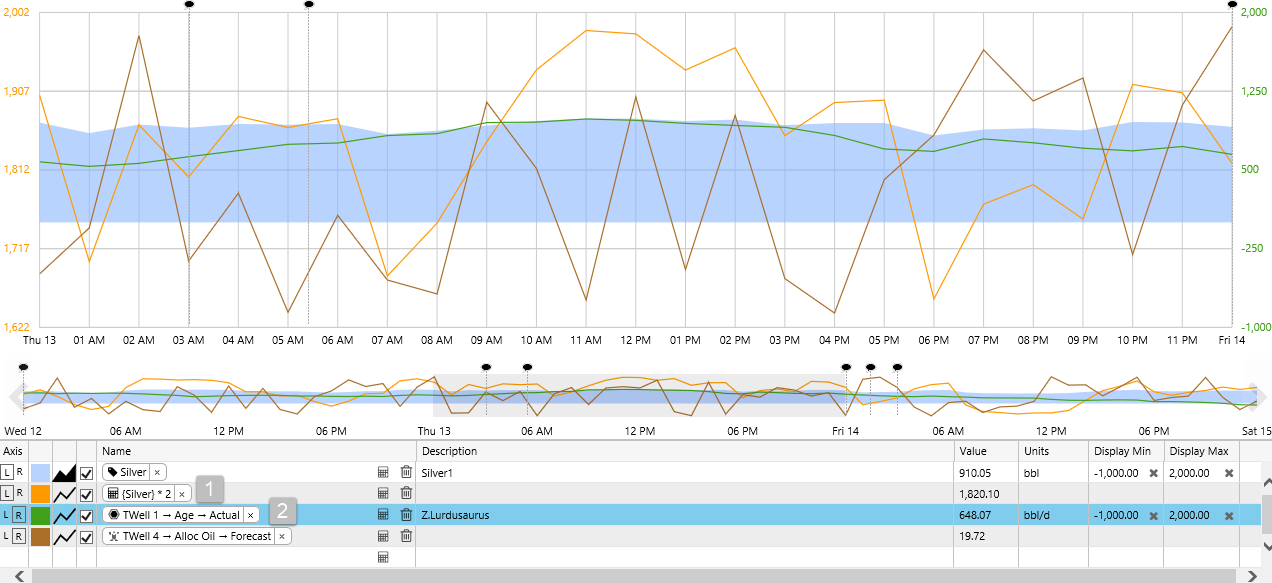
1: The most recently selected Left Y-Axis item is used for rendering the left Y-Axis. 2: The currently selected Right Y-Axis item is used for rendering the right Y-Axis.
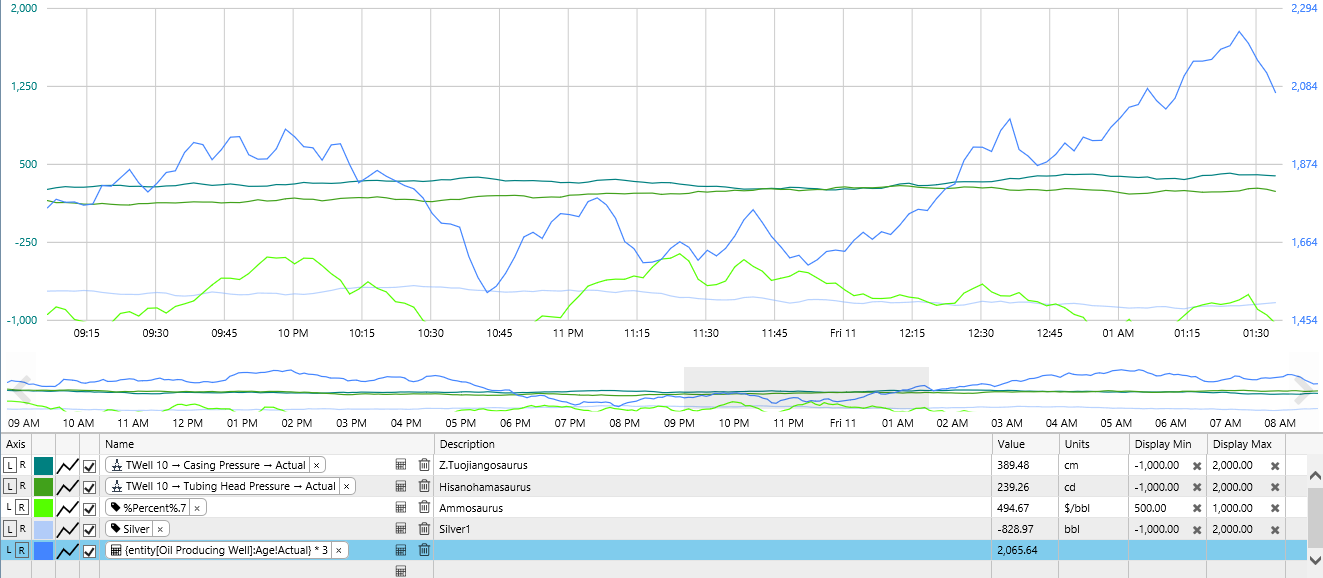
Shared Y-Axis
If you want all traces to be plotted against a shared axis, select Shared from the Y-Axis drop-down list.
All traces on the Left Y-Axis (L) are plotted against a single, shared Left Y-Axis, while all traces on the Right Y-Axis (R) are plotted against a single, shared Right Y-Axis.
When there is a shared Y-Axis, the Left Y-Axis and the Right Y-Axis are both rendered in black.
Manual Adjustments to Display Minimums and Maximums
Minimum and maximum display values for items in the trace table can be edited, and saved with the trend. The minimum and maximum values help to determine the Y-Axes.
1. Select Separate from the Y-Axis drop-down list on the ribbon.
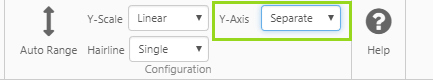
Select Separate Y-Axis on the ribbon
2. Edit individual Display Min and Display Max values in the Trace Table. Either overwrite with a new value or use the up and down arrow keys to increase/decrease the value by one.

Updating Display Min for a trace item
Note that the new Minimum and Maximum display values for items in the trace table are saved with the trend, but the stored minimum and maximum display values for the tags are not updated.
Resetting Display Minimums and Maximums
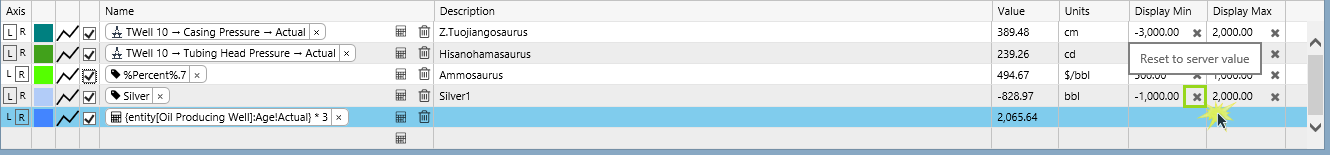
Trace item Display Minimums and Maximums that have been manually overwritten, or updated using Auto Range, can be reset to their stored value.
1. Select Separate from the Y-Axis drop-down list on the ribbon.
Select Separate Y-Axis on the ribbon
2. Click the ![]() on the right of the display minimum or display maximum value for a trace item, to reset to the stored value.
on the right of the display minimum or display maximum value for a trace item, to reset to the stored value.
Auto Range
Auto Range automatically updates the individual display minimum and maximum values, so that all of your trace data points are visible on the trend.
1. Select Separate from the Y-Axis drop-down list on the ribbon.
Select Separate Y-Axis on the ribbon
2. Click Auto Range on the Trend ribbon.
Auto Range calculates a new Display Min and Display Max for each item, based on the individual items’ data values for the selected time range, and plots the separate trace lines using the new minimums and maximums.
Note how all the trace lines fit into comfortably into the Trace Window
Note that the new Minimum and Maximum display values for items in the trace table are saved with the trend, but the stored minimum and maximum display values for the tags are not updated.
You can reset or manually adjust each trace's display minimum and maximum.
Hairlines
Depending on your selection of allowable hairlines on the trend ribbon, you can add single, dual, multiple or no hairlines to the trace window.

Click on an area in the trace window to add a hairline.
Clicking to add a hairline
To move a hairline left or right, click the hairline and drag it to the left or right.

Dragging a hairline to the left or right
The position of your mouse as you click determines the horizontal position of the hairline, and also the vertical position of the hairline information panel.
You can reposition a hairline information panel by clicking on a hairline, and then moving your mouse up or down the hairline.
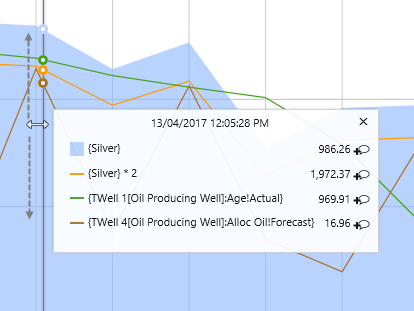
Dragging the information box up or down
Comments
Comments can be added to tags and attribute values on a trend.
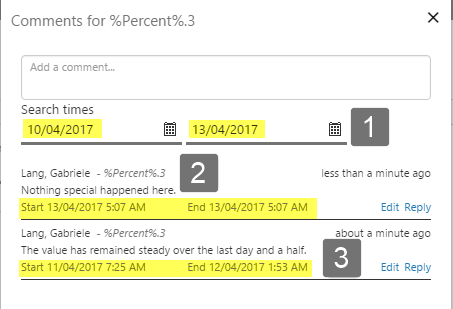
You can reply to comments, locate comments on a trace, and search for comments within a period, for a particular tag or attribute value. All tag or attribute comments within the range are listed in the comments window, with comments that apply to later start times listed at the top.
You can edit the comment text, for your own comments.
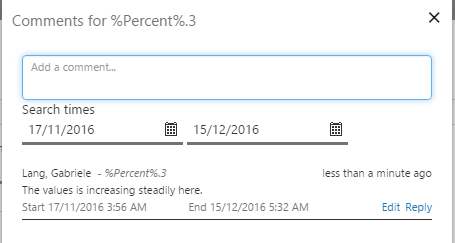
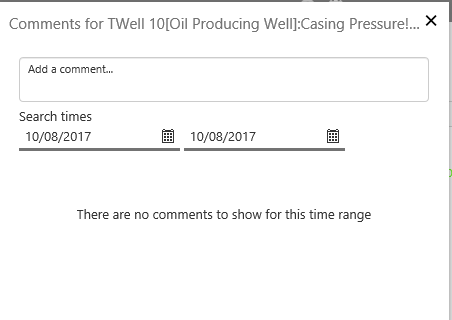
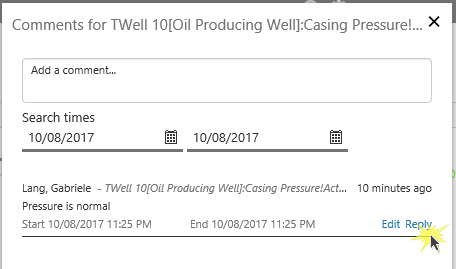
Comments Window Overview
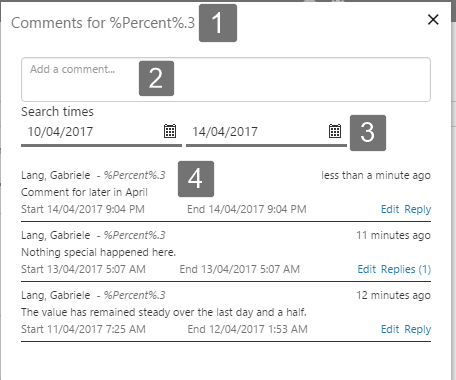
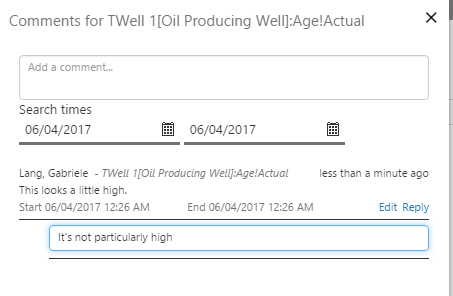
| 1. | Comment Header | This includes the name of the tag or attribute value. | |||||||||||||||||||
| 2. | Comment Edit Box | Type a comment in the edit box, then press Enter to add it. You can edit your own comments after adding them. | |||||||||||||||||||
| 3. | Search Range | Search for any comments for the tag or attribute value, that apply to periods between Start and End times. | |||||||||||||||||||
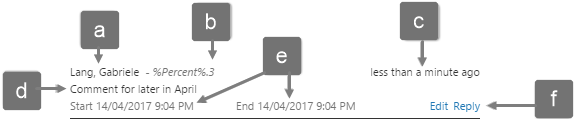
| 4. | Comment Details | Comments for the tag or attribute value for the search range are listed here. Details for each comment are:
|
|||||||||||||||||||
|
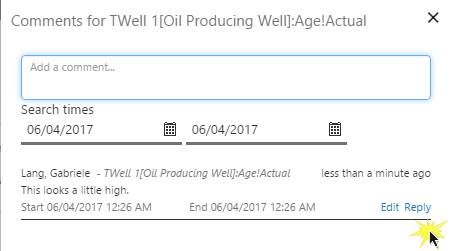
Adding Comments
Click the comment icon alongside a tag or attribute value, in a hairline's Information Box.
The Comments Window opens for the tag or attribute value, with a search range for either a single date, or for a period defined by the dates and times of the first and last hairline, if there is more than one hairline in the Trace Window.
Type a comment in the Comment edit box then press Enter.
The comment is added for the period marked by the first and last hairline on the Trace Window.
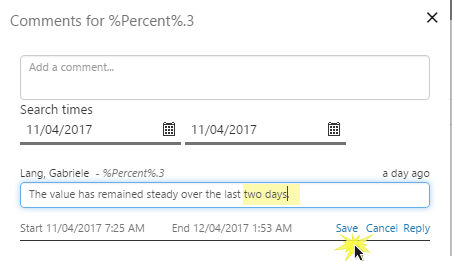
Editing Comments
You can edit the comment text, for your own comments. Comments cannot be deleted.
1. Click Edit, alongside the comment you want to edit.
2. Overtype the comment in the comment edit box, and press Enter or click Save.
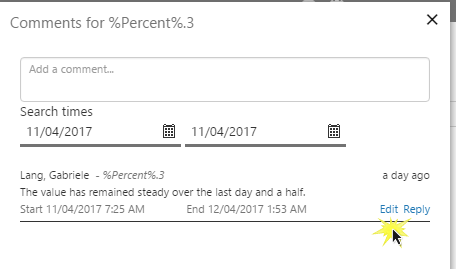
Replying to Comments
1. Click Reply, next to the comment.
2. Type a reply in the reply text box, and press Enter.
Searching for Comments
Click the comment icon for a tag or attribute value, in a hairline's Information Box.
The search range for the comment is either for a single date of the hairline on the Trace Window (if it is a single hairline), or it is for a period defined by the dates and times of the first and last hairline if there is more than one hairline in the Trace Window.
|
|
|||||||
|
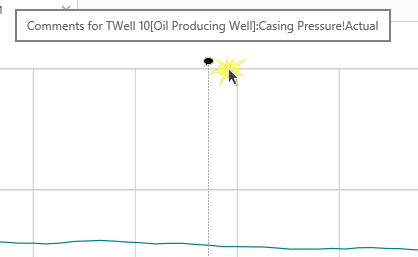
Locating Comments
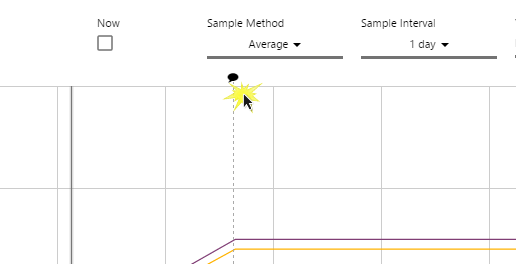
Comments are marked on the Trace Window (and also in the Range Selector) by a dashed vertical line with a solid comment icon. Click the icon to open the comment.
Trend FAQs
Tutorial
In this tutorial we’ll add a new trend, and then drop some attributes into the Trace Window to create trace lines. Next, we'll experiment with features of the resulting trend.
Follow the step-by-step instructions, below.
Step by Step: Adding a New Trend
We'll open a new trend and put some data on there. Next, we'll experiment with changing selections, using the range selector, and adding a hairline with comments before saving the trend. And finally, we'll locate and open the saved trend.
You will need to search for attributes or tags within your own environment, to follow this exercise.
Step 1. Adding a New Trend
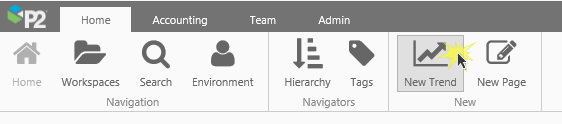
Open the Home tab on the Explorer ribbon, and click New Trend.
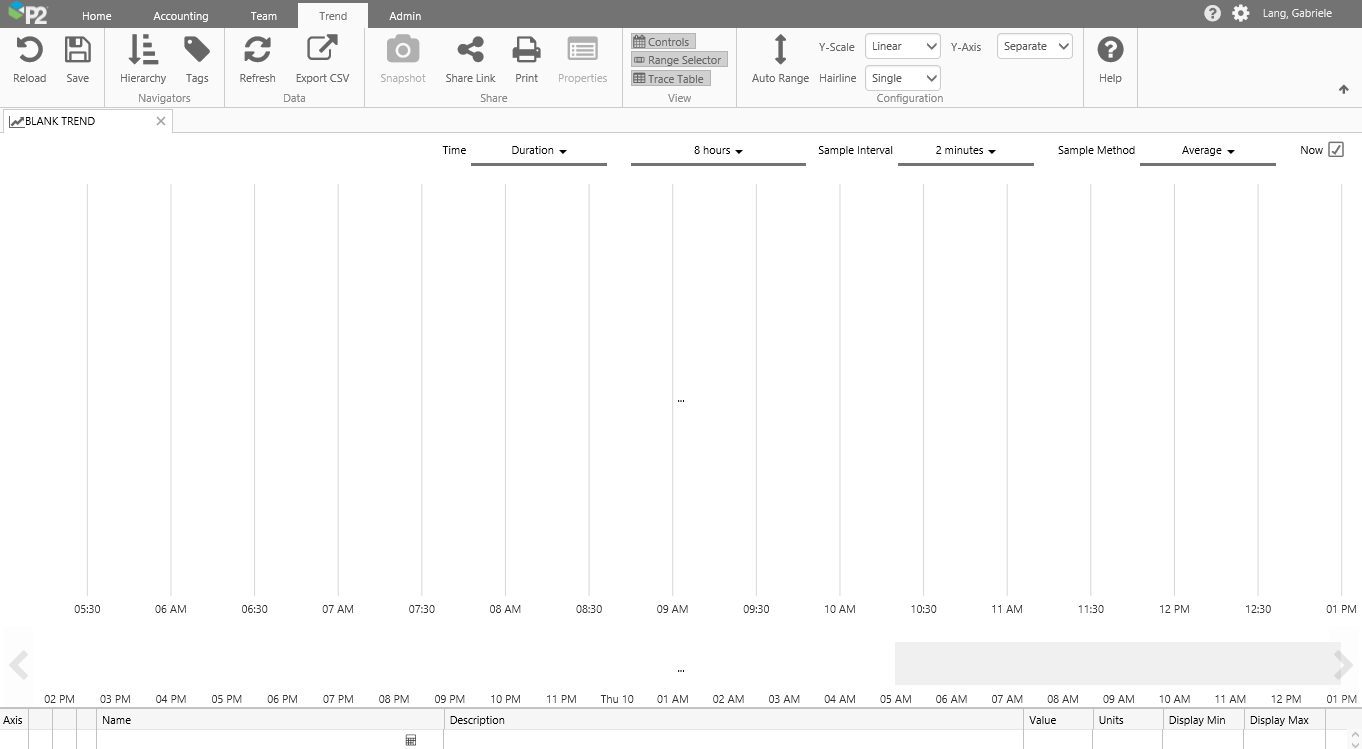
The Trend ribbon tab appears, with a new blank trend in the main window. The Controls, Range Selector and Trace Table are all selected. The Configuration settings are defaulted to:
- Y-Scale: Linear
- Hairline: Single
- Y-Axis: Separate
The Trend Controls have the following defaults:
- Time: Duration, 8 hours
- Sample Interval: 2 minutes
- Sample Method: Average
- Now: Selected
Step 2. Adding a Trace
To trend an attribute or tag, you can either drag it onto the trace window, or click Add Trace above the Trace Table, and add the item into the Name column using Auto-Complete or the Calculation Editor.
Dragging an Attribute onto the Trend from the Hierarchy Navigator
To add an attribute to the Trace Window from the hierarchy navigator: Open the Hierarchy Navigator, select a hierarchy, select an entity, then drag and drop one of its attribute values onto the Trace Window.
In our example tutorial, we select the Test Time Series Hierarchy, and navigate to the TWell10 entity: TOrganisation 1>
TRegion 1>TArea 1>TField 2>TWell 10 .
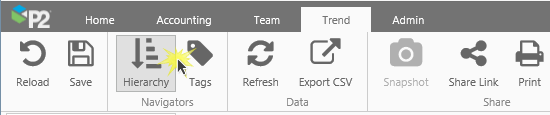
1. Click Hierarchy on the Trend ribbon tab.
2. Select a hierarchy from the drop-down list (Test Time Series Hierarchy in our example).
3. Navigate through the hierarchy to find your entity, or type the entity name in the search box and press enter, then click the entity.
4. Click Show Attributes to open the Attributes Panel.
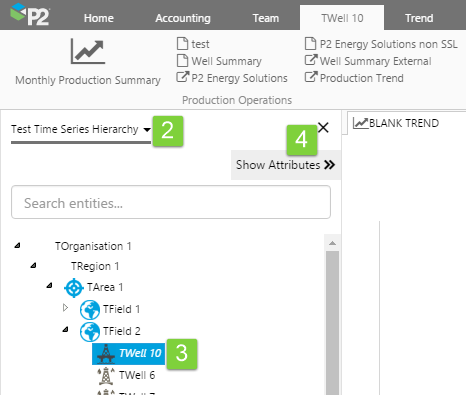
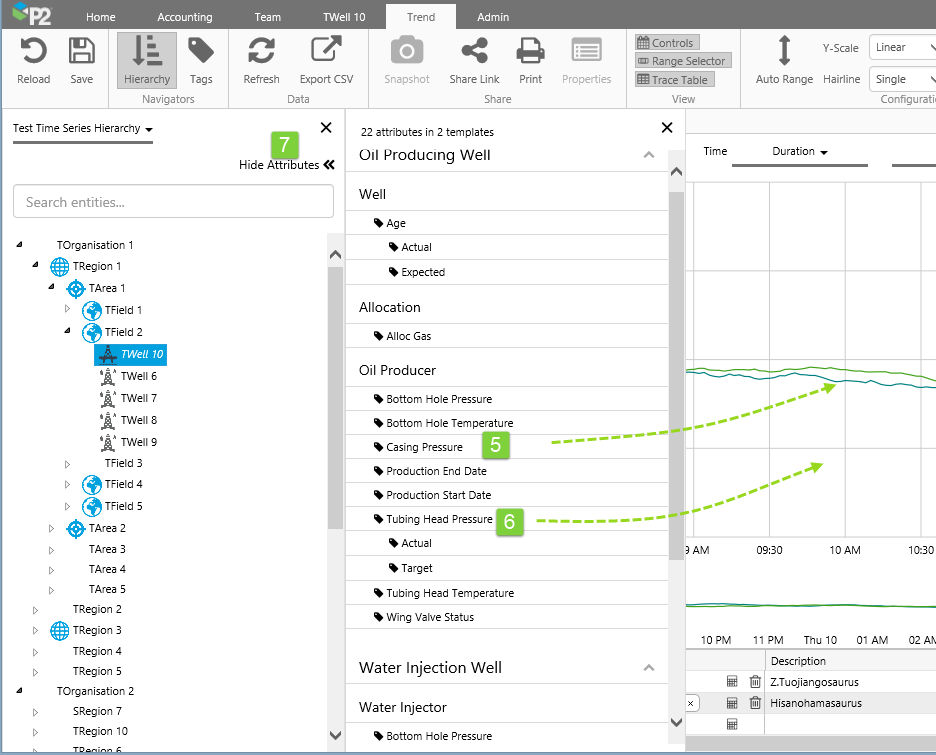
Navigating to an Entity and Displaying its Attributes
5. Select an attribute from one of the templates, and drag it onto the Trace Window (TWell 10[Water Producing Well]:Casing Pressure!Actual, in our example).
6. Now add another one in the same way (TWell 10[Water Producing Well]:Tubing Head Pressure!Actual, in our example).
7. Click Hide Attributes to close the Attributes Panel.
Dragging a Tag onto the Trend from the Tags Navigator
1. Click Tags on the Trend tab.
2. Search for tags in the Tags Navigator that appears on a panel on the left.
3. Drag and drop a tag (%Percent%.7, in our example) onto the Trace Window .
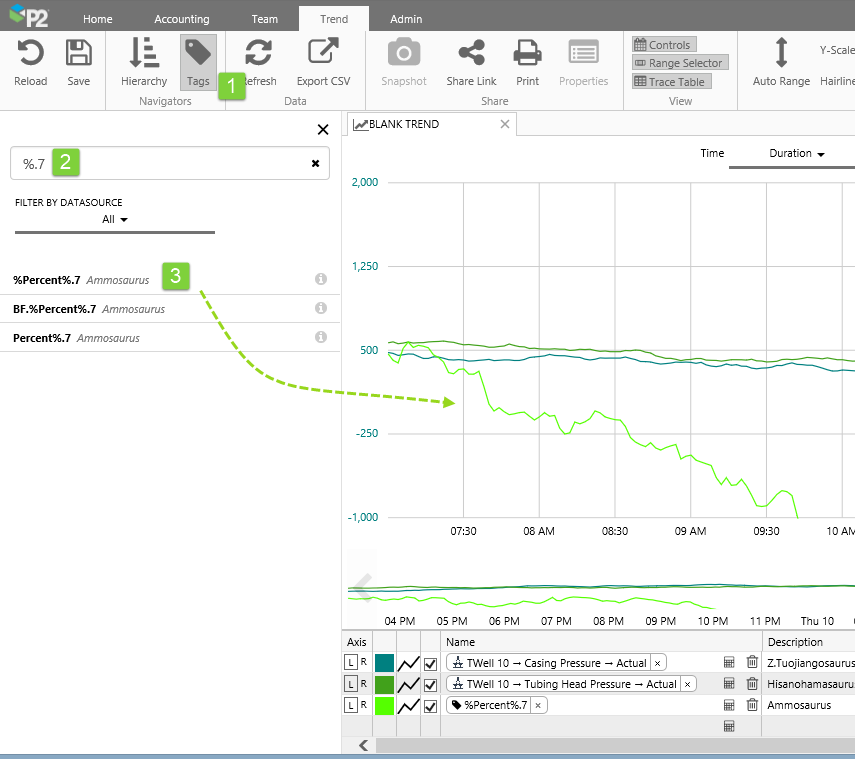
Dragging a Tag onto the Trend
Adding Trace Items Directly into the Trace Table
You can add an attribute value, tag, calculation, or templated attribute directly into the Trace Table.
Click in the Name column in a new row in the Trace Table.
Clicking the Name column to add a new trace item
Typing in the name
If you know a tag or attribute name, you can type this directly into the name column, always surrounding the tag or attribute name in {curly brackets}. You can also type in a calculation, with the tag or attribute also surrounded by curly brackets{}, for example: {TWell 1:Tubing Head Pressure} + 20, or add a calculation to to an attribute or tag that you dragged onto the trend, by editing the value in the Trace Table. Here are some examples:
| Tag | {Silver} | |
| Calculation with a tag | {Silver} * 2 | |
| Fully qualified attribute value | {TWell 1[Oil Producing Well]:Age!Actual} | |
| Partially qualified attribute value | {TWell 1:Age} | The primary template (Oil Producing well) and the default attribute value (Actual) are supplied by P2 Server. |
| Templated attribute value | {entity[Oil Producing Well]:Age!Actual} | Read more about templated attributes, below. |
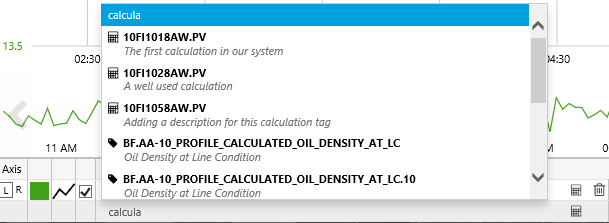
Using Auto-Complete
You can add a new item with Auto-Complete.
Using the Calculation Editor
You can add a new item, or edit an existing one, using the Calculation Editor.
Templated Attributes
This variation of an Attribute definition uses the entity keyword. The entity keyword gets replaced by the entity clicked on the hierarchy navigator (although not updated in the definition).
For example, if you add a templated attribute {entity[Oil Producing Well]:Age!Actual}, then the attribute values for TWell 1 are retrieved and traced when you click TWell 1 in the Hierarchy Navigator.
Syntax: In the Calculation Editor, subsitute the actual entity name with the keyword entity.
As with other attribute definitions that can form part of a calculation, you can use a templated attribute within a calculation, for example: {entity[Oil Producing Well]:Age!Actual} * 3
Step 3. Using the Trend Controls
In this step, we'll experiment with changing the controls. Note how these changes affect the trend, and also how some of the control selections are interdependant.
Using some basic examples, we'll demonstrate how the trend changes when different controls are selected. There are many different combinations you can try out on your own trend. Be aware that your selections (for example, a long duration with a small sample interval) may require a large data fetch which will affect performance.
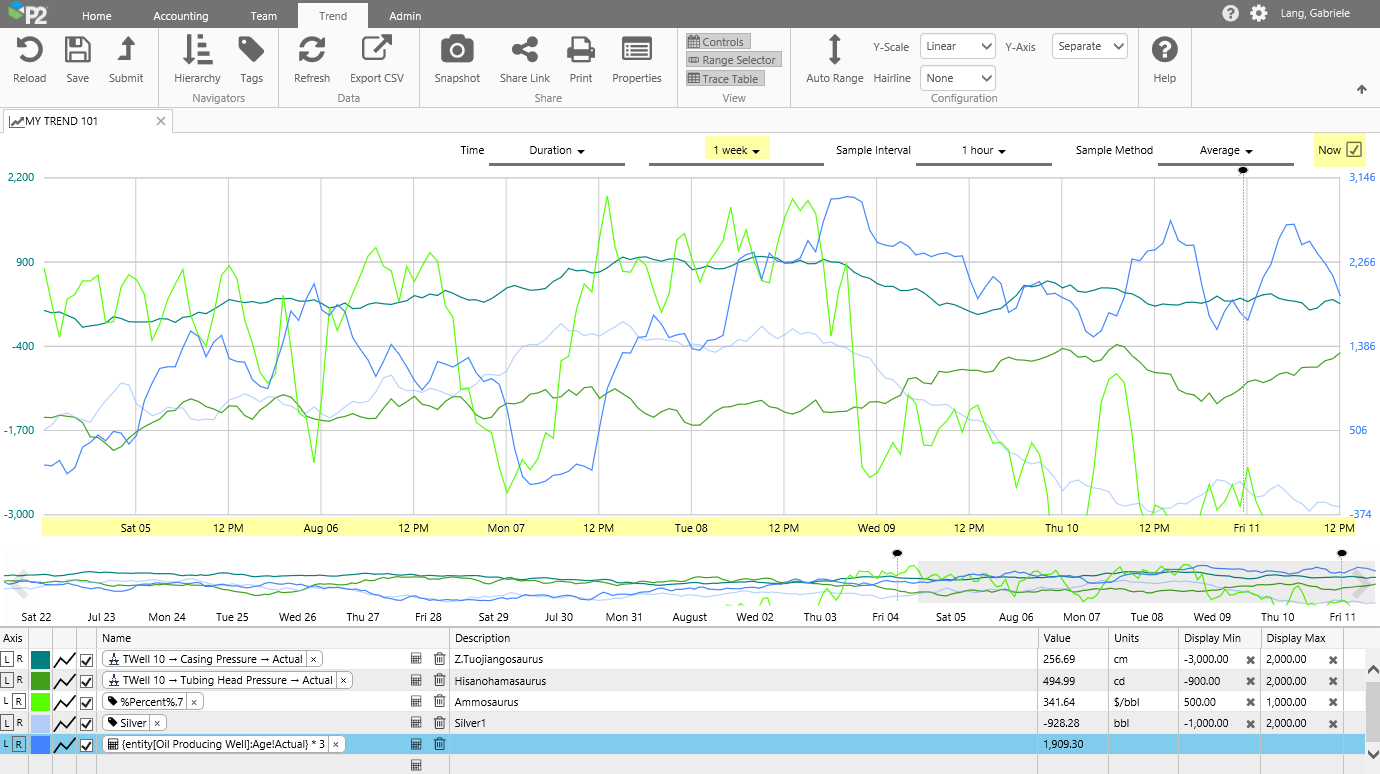
Step 3.1. Changing the Duration
Here we have selected a duration of 1 week. Note the dates and times on the X-Axis, spanning a week until the current date (Now).
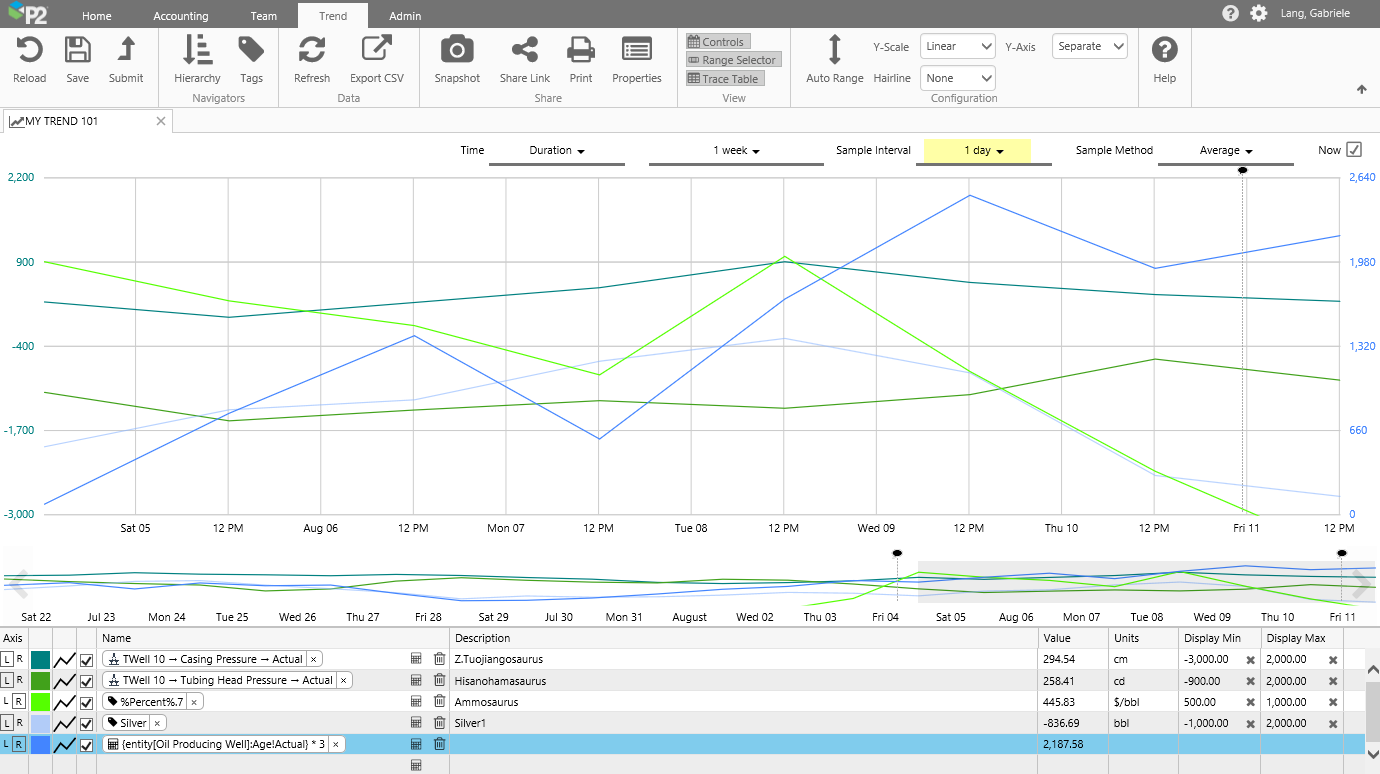
Step 3.2. Changing the Sample Interval
Here we have selected a 1 day sample interval. Note how the data points are at one day intervals.
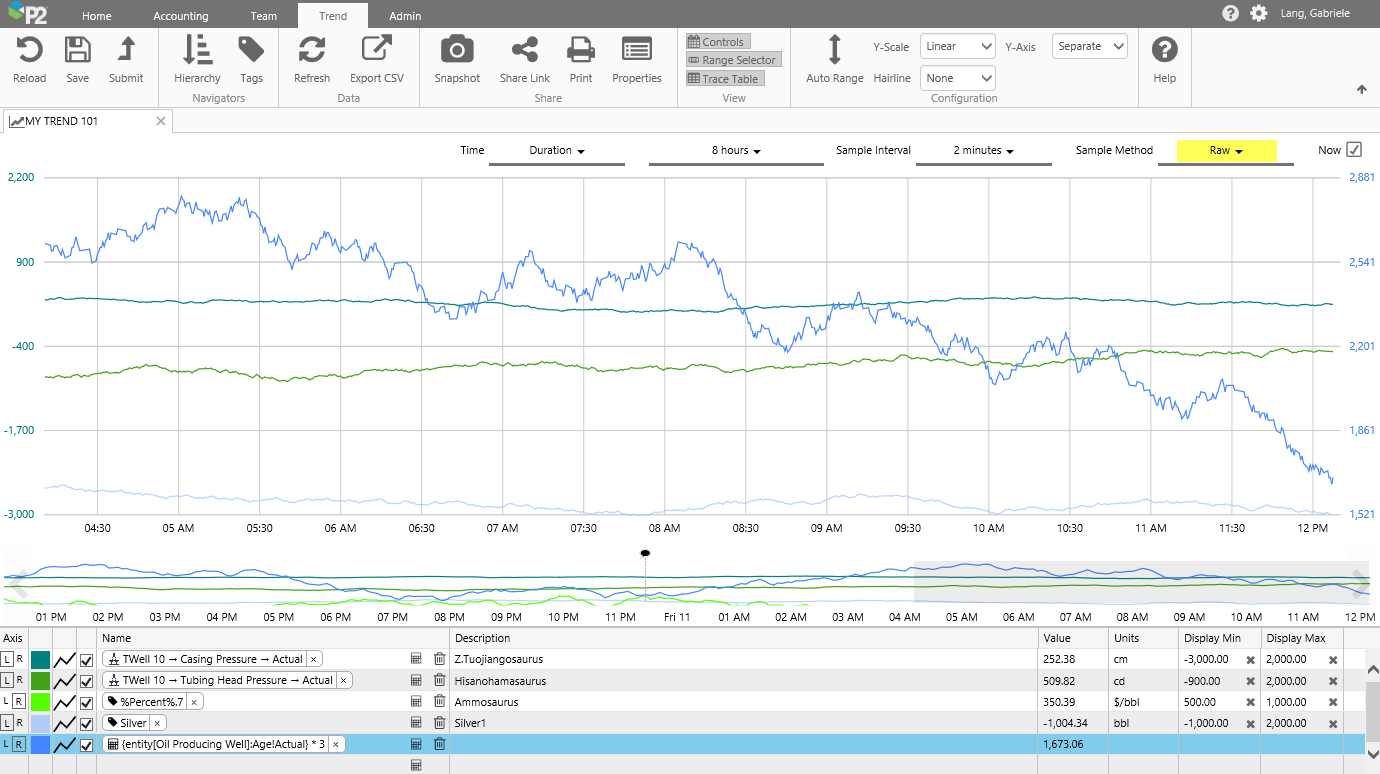
Step 3.3. Changing the Sample Method
Here we have selected the Raw sample method. Note how the duration is now 8 hours.
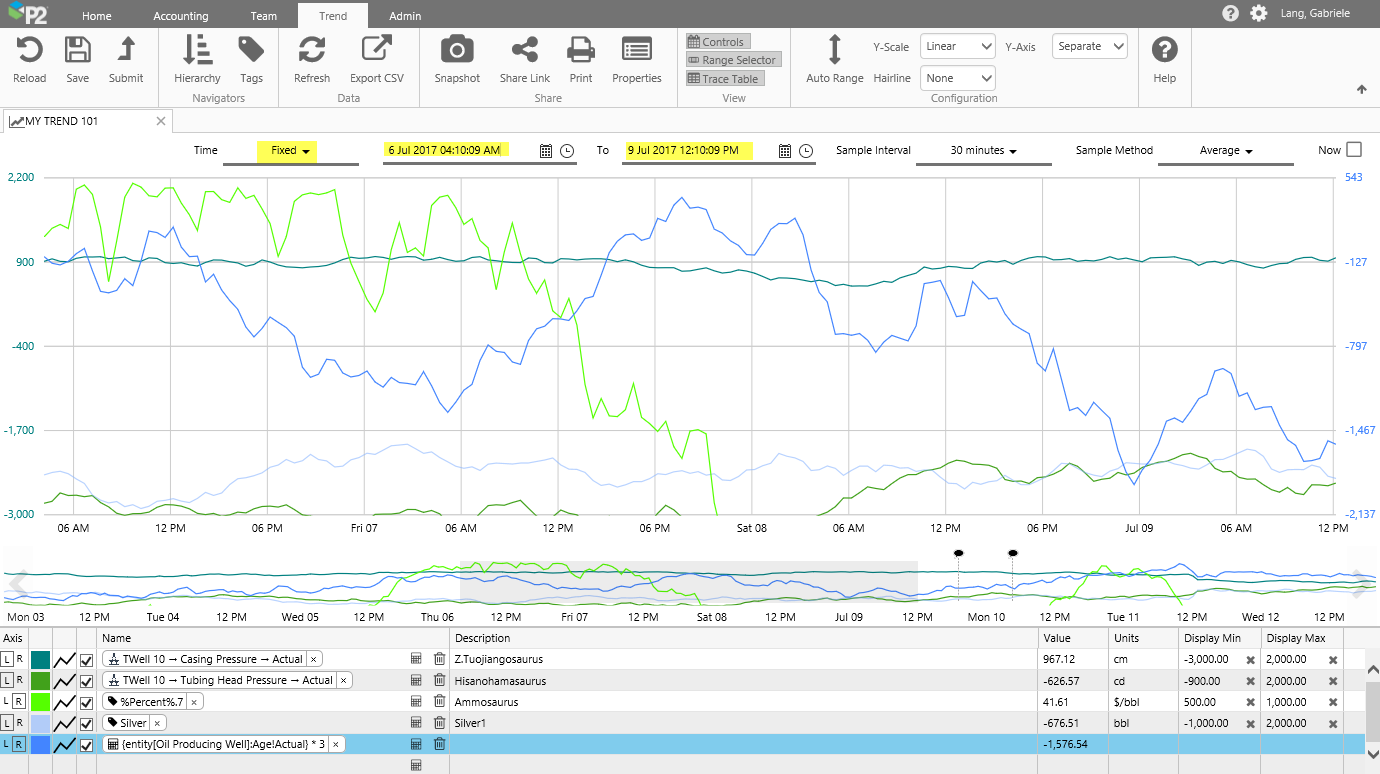
Step 3.4. Selecting Fixed Times
Here we have selected a start time of 6 Jul 2017 04:10:09 AM and an end time of 9 Jul 2017 12:10:09 PM.
Step 4. Changing your Time Selection with the Range Selector
The Range Selector, located below the Trace Window, works interchangeably with the Time trend controls to set your trend time range. The range selector has a highlighted section that matches the time range set by the date pickers, with double that time period shown before the selection if Now is selected (for example, for a new trend).
If Now is cleared, the selection has an equal amount of time shown before and after.
![]()
Resizing the highlighted section
1. Hover the mouse over the left or right edge of the highlighted section, until you see the mouse horizontal resize pointer ![]() .
.
2. Now click and drag to left or right. Note how the trend start and end time changes.
Moving the highlighted section
1. Hover the mouse over the central portion of the highlighted section, until you see the mouse move pointer ![]() .
.
2. Now click and drag the whole highlighted section to left (earlier) or right (later). Note how the trend start and end time changes.
Changing the Range Selector start and end dates
Click the left or right arrow to move the start and end date of the range selector.
Note that the dates on the highlighted section do not change; the highlighted section just moves across (to left or right) in relation to the changing start and end dates of the range selector.

Step 5. Adding a Hairline and Comments
Add a hairline to view values (if any) for all trended tags at a particular point in time. You can leave a comment for a trended tag at the hairline point, or view and reply to other comments.
New Hairline
Click a point on the trace to get a hairline, a vertical line marking out this time, with an information box to the side.
To move the hairline, either drag it along the trace, or add a click another point on the trace.
To change the position of a hairline information box, click on the hairline, then move your mouse up or down the hairline.
To remove the hairline, close the information box (click X on the top right corner).
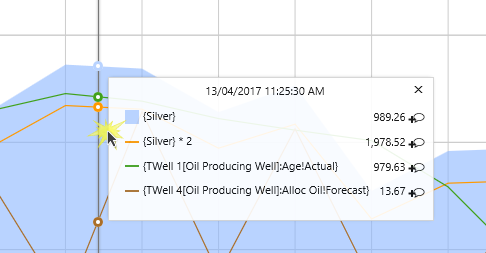
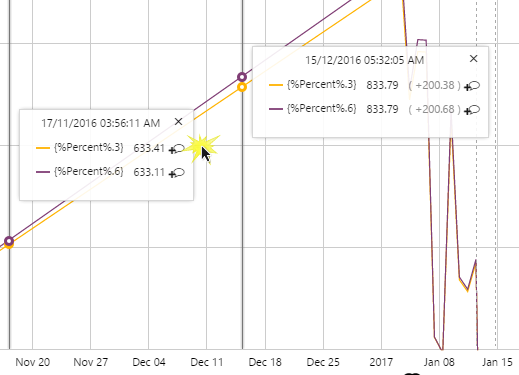
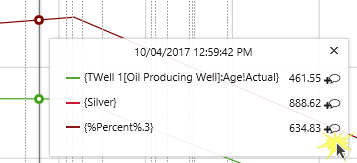
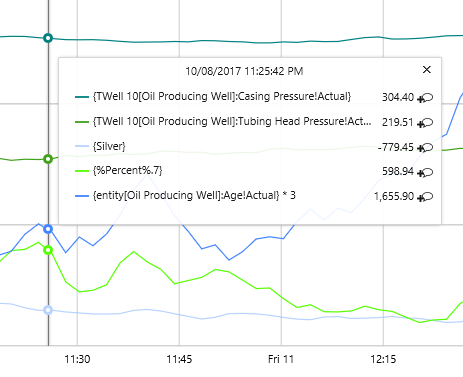
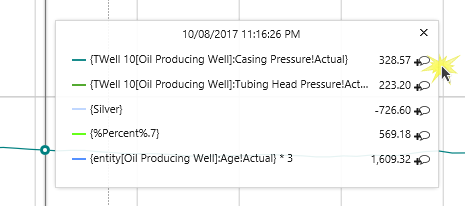
Hairline Information
The Date and Time is displayed at the top of the information box.
Each trace item is identified by its trace legend and its full name. The trace item's value (if any) is displayed to the right, followed by a comment icon.
Adding a Comment
To add or view comments, click the comment icon for a tag or attribute value.
See next section for more on comments.
Step 6. Adding, Viewing and Replying to Comments on a Trend Tag
Step 6.1. Adding a Comment
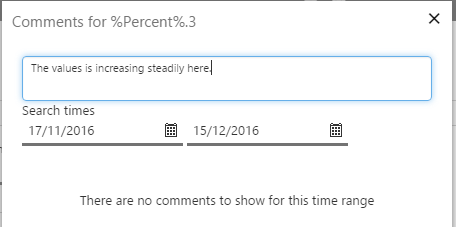
1. Click the comment icon on the hairline information box, to open the Comments Window.
2. In the Comments Window, type in a comment, then press Enter.
Step 6.2. Replying to a Comment
Comments are indicated on the trace by a vertical, dotted line with a comment icon at the top. Hover over the icon to see the tooltip which says which attribute or tag the comment is for.
1. Click the comment icon to open the Comments Window.
2. In the Comments Window, click Reply.
3. Type in a reply, then press Enter.

Step 7. Saving Your Trend
You can save a blank trend, or you can duplicate a named trend by saving it to a new name or workspace.
Saving a Blank Trend
On the Trend ribbon tab, click Save.
![]()
The Save Trend window opens. Type in a Name for your trend, and save to My Workspace or select a workspace from the drop-down list. Or click Create new workspace to save the trend to a new workspace.
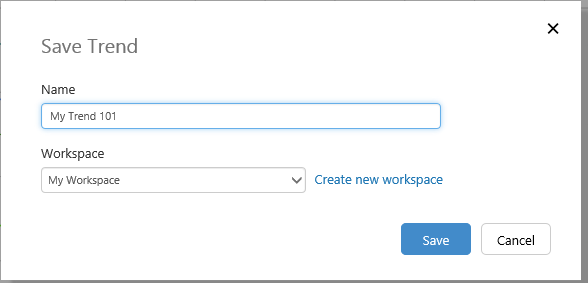
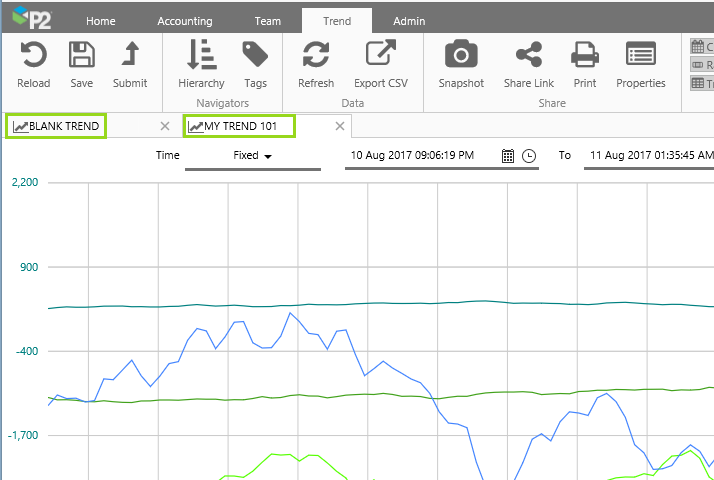
There are now two trends: the original 'blank trend', and your new saved trend.
When you close both of these, only the saved trend (Trend 101) can be reopened. The blank trend is lost when you close it.
Note: You can take a snapshot of a saved trend, and you can share a link of a blank trend or a named trend.
Step 8. Search for a Trend
Now that you have created and saved your trend, here is how you can find it again:
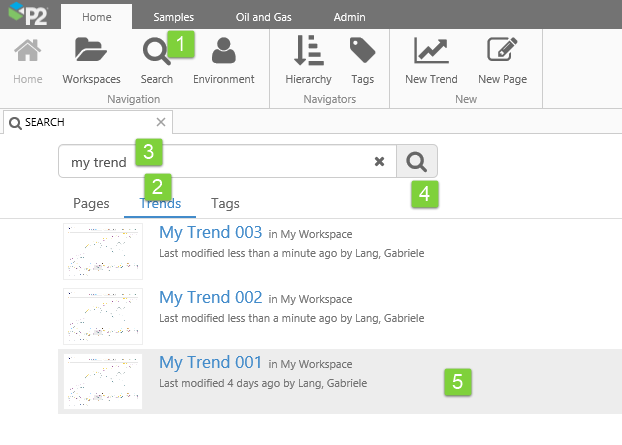
Searching for a Trend in a Search Page
1. Click Search on the Home ribbon tab.
2. In the open Search page, select the Trends tab.
3. Type the search filter into the search box.
4. Click the Search ![]() button, or press enter.
button, or press enter.
5. Click on a trend in the list, to open it.
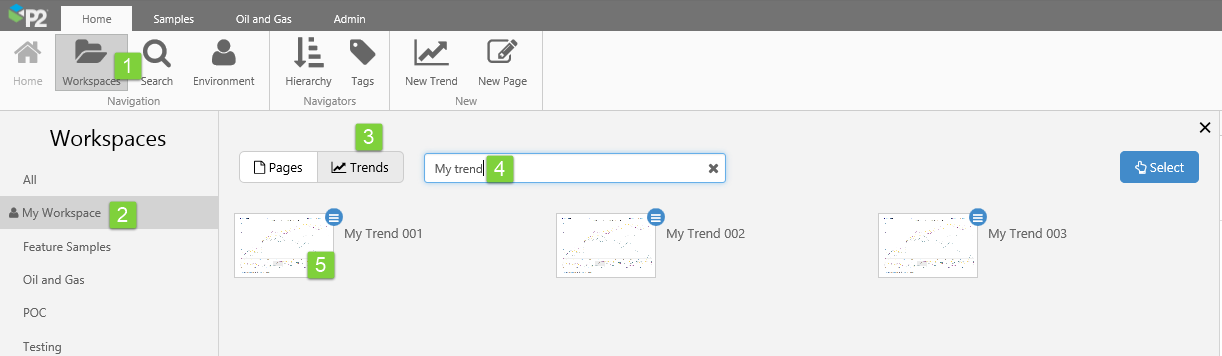
Searching for a Trend in a Workspace
1. Click Workspaces in the Home Explorer ribbon tab.
2. Click the workspace that contains the trend (in this example, My Workspace).
3. Click the Trends tab in the main area.
4. Type all or part of the trend name in the search box.
5. Click the trend thumbnail to open the trend.
Release History
- Creating a Trend (this release, 4.5.3):
- You can now adjust the height of the Trace Table.
- Trend Export to CSV format has changed.
- Dual Hairline Statistics are available.
- Ability to edit a calculation.
- Trace items are limited to 20.
- Creating a Trend 4.5.2:
- Trend ribbon tab has changed to include a View group and a Configuration group.
- Trend controls have inter-dependant options, for performance considerations.
- The display minimum and display maximum values can be reset to their stored values.
- Keyboard shortcuts are available for the trace table.
- The trace table layout has changed.
- The range selector and the controls bar are narrower, allowing more space for the trace window.
- Creating a Trend 4.5:
- Trace name showing display name.
- Auto-complete tags and attributes for the trace name.
- In-line link to the Calculation Editor.
- Hairline information box positioning.
- Creating a Trend 4.4.6:
- Trace Table layout and column changes (single trace table, value column, display min and max).
- Determining the Y-Axis (manual adjustments to display min and max, separate Y-Axes, Auto Range).
- Zero in Log Scale Plots.
- Creating a Trend 4.4.5:
- You can add a templated attribute to the trace table.
- Creating a Trend 4.4.4:
- The trace table now includes a description for tags and attribute values.
- Hover over a name or description in the trace table to see the full name/description in a tooltip.
- Creating a Trend 4.3.2:
- Auto-refresh to 'Now'
- Show/Hide Trend controls
- Trace Table split into Left Y Axis and Right Y Axis
- Multiple hairlines available
- Creating a Trend 4.3.1