ON THIS PAGE:
A trend displays time-series data, such as tags, attribute values and calculations, over a selected period of time.
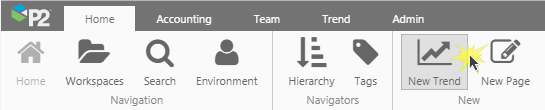
To create a trend, click New Trend on the Home ribbon tab, and add tags, attribute values and calculations to this.
Overview
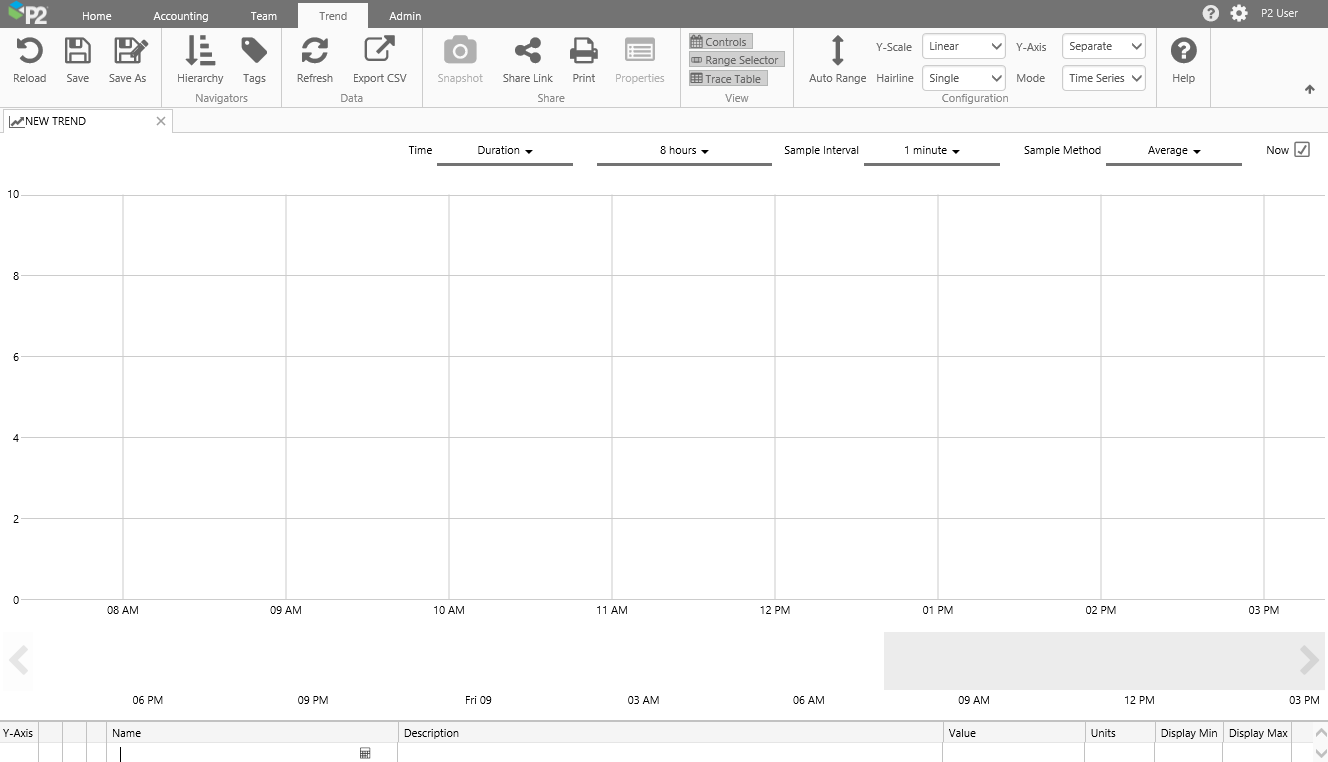
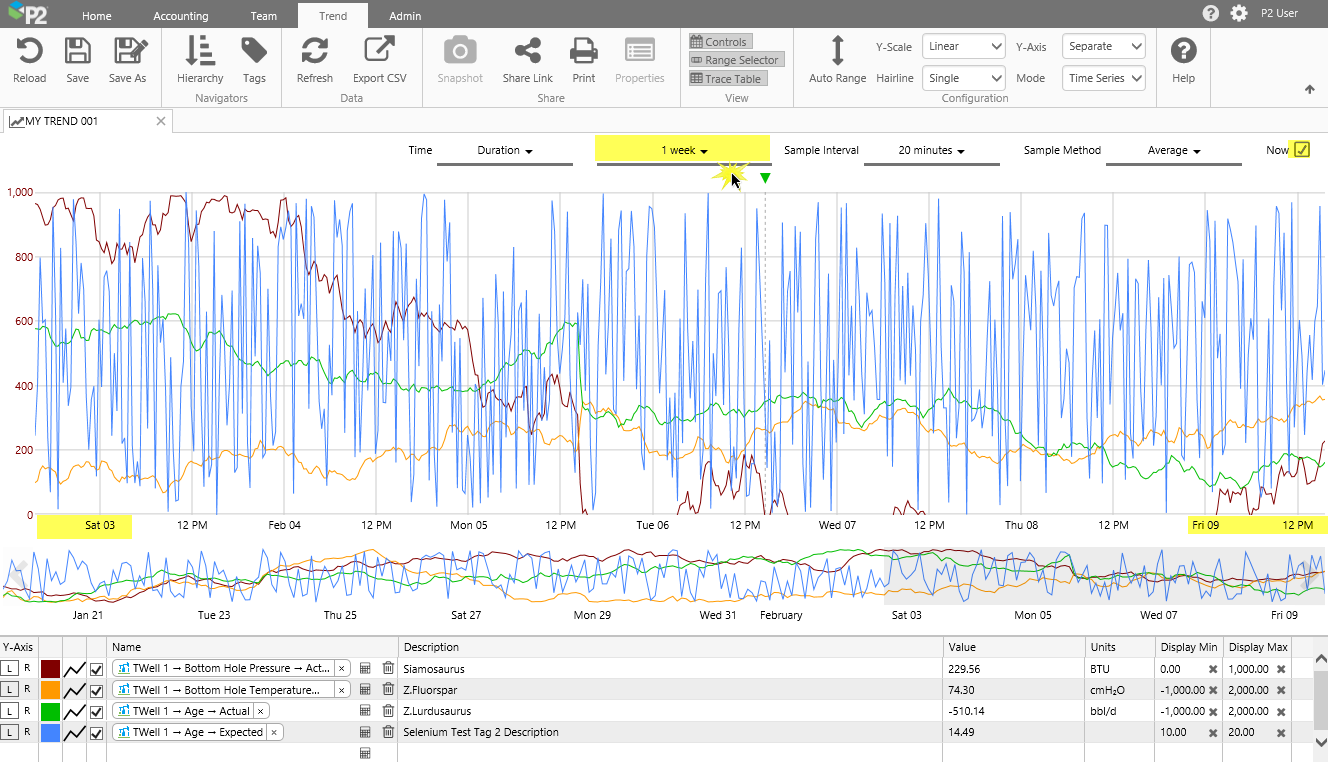
The screenshot below shows a new trend, with three traces. The trend has five main sections:
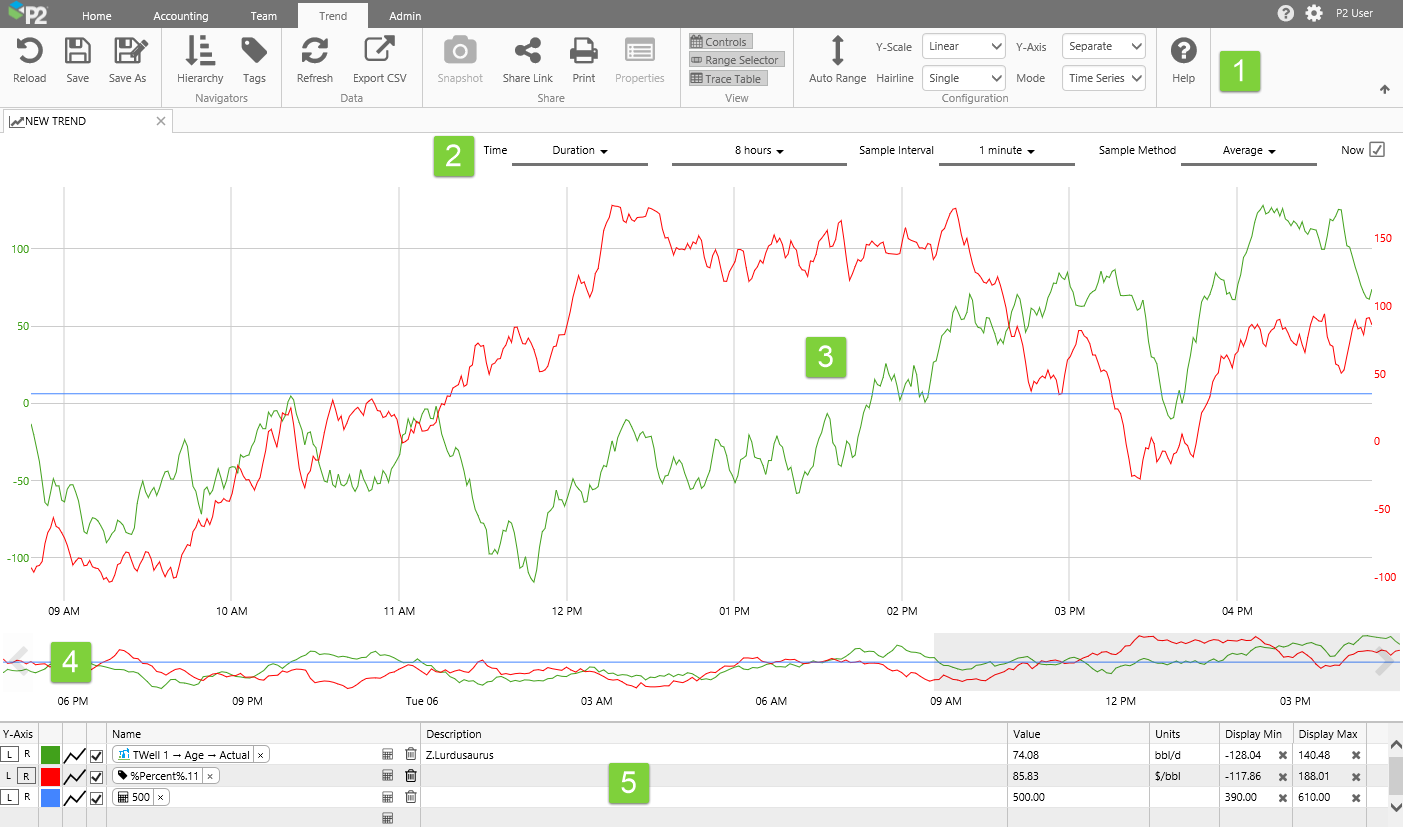
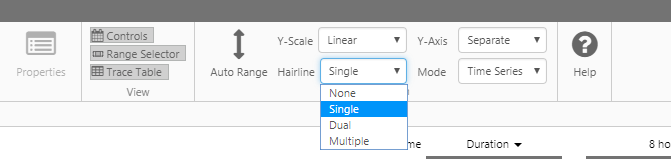
| 1. | Trend Ribbon Tab | The Trend Tab on the ribbon is activated whenever a trend is opened and is used for managing and sharing the trend, as well as refreshing data or resetting the trend, and choosing some of the trend configuration such as Y-Scale Type, number of allowable hairlines and what type of Y-Axis is used. Click Auto Range to reset the minimum and maximum values for the trace items, so that all data points are visible on the trend. |
| 2. | Trend Controls | The selections you make on the Trend Controls affect the time range of the chart, as well as the data collection method and interval. |
| 3. | Trace Window | Data is plotted on the Trace Window, along with hairlines and comments. |
| 4. | Range Selector | The highlighted section in the range selector matches the start and end of the trend time range. Use the range selector as a longer trend, to help identify highs and lows. You can select smaller periods within the range selector, to pick a new time range. |
| 5. | Trace Table | The Trace Table lists each item (attribute, tag or calculation) in the trend, along with its description, display minimum and maximum, and units. The table also displays values or statistics. Use the functionality here to format each trace line (colour, trace style, visibility), add or remove trace lines, add or edit calculation traces, choose a Left or right Y-Axis, and manipulate display minimums and maximums. |
Tutorials
In the tutorials that follow, we’ll add a new trend, and then drop some attributes into the Trace Window to create trace lines. Next, we'll experiment with changing selections, using the range selector, and adding a hairline with comments before saving the trend.
Note: You will need to search for attributes or tags within your own environment, to follow this exercise.
Tutorial 1: Simple Trend
In this tutorial, we create a simple trend by opening a blank trend and adding a tag or attribute. We then save the trend.
Step 1. Create a Trend
Open the Home tab on the Explorer ribbon, and click New Trend.
The Trend ribbon tab appears, with a new blank trend in the main window. The Controls, Range Selector and Trace Table are all selected. The Configuration settings are defaulted to:
- Y-Scale: Linear
- Hairline: Single
- Y-Axis: Separate
- Mode: Time Series
The Trend Controls have the following defaults:
- Time: Duration, 8 hours
- Sample Interval: 1 minute
- Sample Method: Average
- Now: Selected
Step 2. Add a Trace
To trend an attribute or tag, you can either drag it onto the trace window, or click Add Trace above the Trace Table, and add the item into the Name column using Auto-Complete or the Calculation Editor.
Adding an Attribute
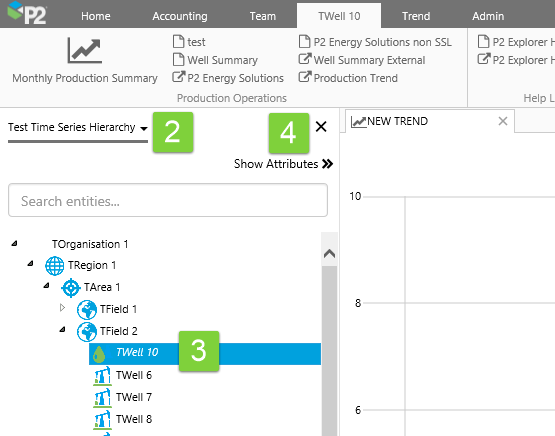
To add an attribute to the Trace Window from the hierarchy navigator: Open the Hierarchy Navigator, select a hierarchy, select an entity, then drag and drop one of its attribute values onto the Trace Window.
In our example tutorial, we select the Test Time Series Hierarchy, and navigate to the TWell10 entity:
TOrganisation 1>
TRegion 1>TArea 1>TField 2>TWell 10
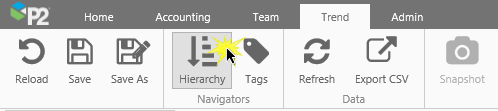
1. Click Hierarchy on the Trend ribbon tab.
2. Select a hierarchy from the drop-down list (Test Time Series Hierarchy in our example).
3. Navigate through the hierarchy to find your entity, or type the entity name in the search box and press enter, then click the entity.
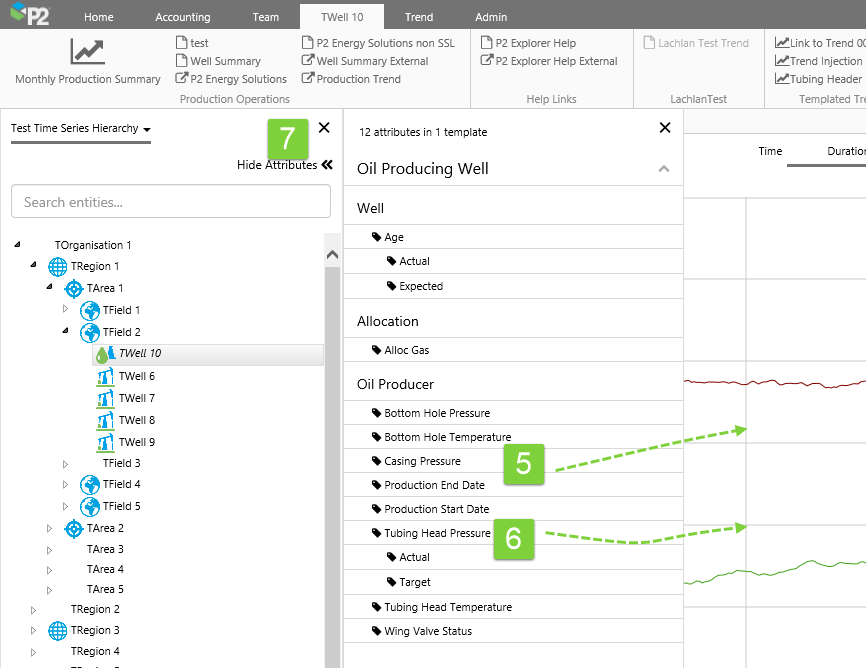
4. Click Show Attributes to open the Attributes Panel.
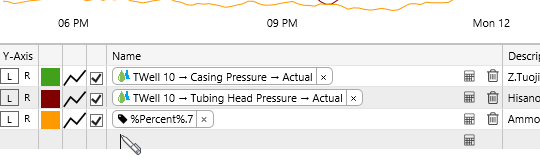
5. Select an attribute from one of the templates, and drag it onto the Trace Window (TWell 10[Water Producing Well]:Casing Pressure!Actual, in our example).
6. Now add another one in the same way (TWell 10[Water Producing Well]:Tubing Head Pressure!Actual, in our example).
7. Click Hide Attributes to close the Attributes Panel.
Adding a Tag
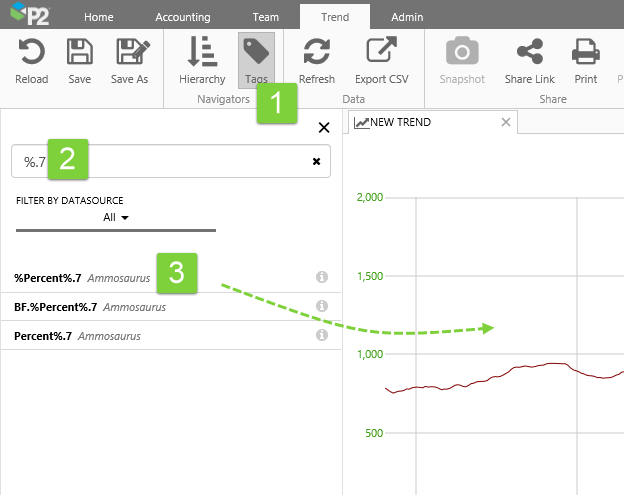
You can add a tag in a similar way to adding an attribute, however you would use the Tags Navigator instead of the Hierarchy Navigator.
1. Click Tags on the Trend tab.
2. Search for tags in the Tags Navigator that appears on a panel on the left.
3. Drag and drop a tag (%Percent%.7, in our example) onto the Trace Window.
Using the Trace Table
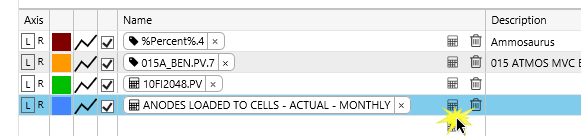
You can add an attribute value, tag, calculation, or templated attribute directly into the Trace Table.
Click in the Name column in a new row in the Trace Table.
Typing in the name: If you know a tag or attribute name, you can type this directly into the name column, always surrounding the tag or attribute name in {curly brackets}. You can also type in a calculation, with the tag or attribute also surrounded by curly brackets{}, for example: {TWell 1:Tubing Head Pressure} + 20, or add a calculation to to an attribute or tag that you dragged onto the trend, by editing the value in the Trace Table. Here are some examples:
| Tag | {Silver} | |
| Calculation with a tag | {Silver} * 2 | |
| Fully qualified attribute value | {TWell 1[Oil Producing Well]:Age!Actual} | |
| Partially qualified attribute value | {TWell 1:Age} | The primary template (Oil Producing well) and the default attribute value (Actual) are supplied by P2 Server. |
| Templated attribute value | {entity[Oil Producing Well]:Age!Actual} | Read more about templated attributes, below. |
Using Auto-Complete: When you start typing a name directly into the Name column for a new item in the trace table, a list of tags, calculations and entities appears, where the name or description matches the search text. You can select one of these items to insert into the trace table.
Using the Calculation Editor: You can add a new item, or edit an existing one, using the Calculation Editor. Each item in the trace table has a calculator icon ![]() in the Name column, linking to the Calculation Editor. Click the calculator icon to open the Calculation Editor and build an expression which can be immediately inserted into the trend.
in the Name column, linking to the Calculation Editor. Click the calculator icon to open the Calculation Editor and build an expression which can be immediately inserted into the trend.
To edit a calculation from the trend, or save to a new calculation, click the corresponding calculator icon in the trace table.
Templated Attributes and Entities: This variation of an Attribute definition uses the entity keyword. The keyword is replaced by the entity clicked on the hierarchy navigator (although not updated in the definition). A trend that uses the entity keyword is often called a templated trend.
For example, if you add a templated attribute {entity[Oil Producing Well]:Age!Actual}, then the attribute values for TWell 1 are retrieved and traced when you click TWell 1 in the Hierarchy Navigator.
You can type this manually into the name field, or use the Calculation Editor to substitute the actual entity name with the entity keyword.
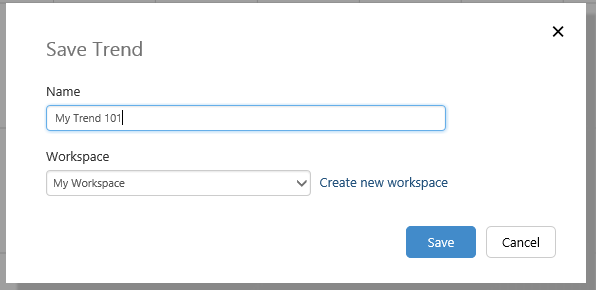
Step 3. Save the Trend
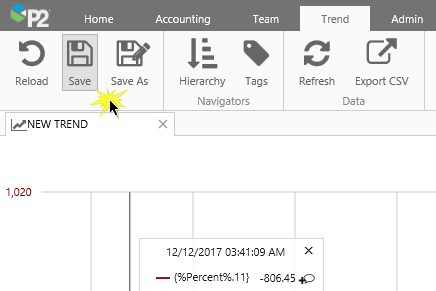
1. On the Trend ribbon tab, click Save.
2. In the Save Trend window, type in a Name for your trend, and save to My Workspace.
Tutorial 2: Trend Controls
In this tutorial, we'll experiment with changing the trend controls. Note how these changes affect the trend, and also how some of the control selections are interdependent.
Using some basic examples, we'll demonstrate how the trend changes when different controls are selected. There are many different combinations you can try out on your own trend. Be aware that your selections (for example, a long duration with a small sample interval) may require a large data fetch which will affect performance.
Step 1. Changing the Duration
Here we have selected a duration of 1 week. Note the dates and times on the X-Axis, spanning a week until the current date (Now).
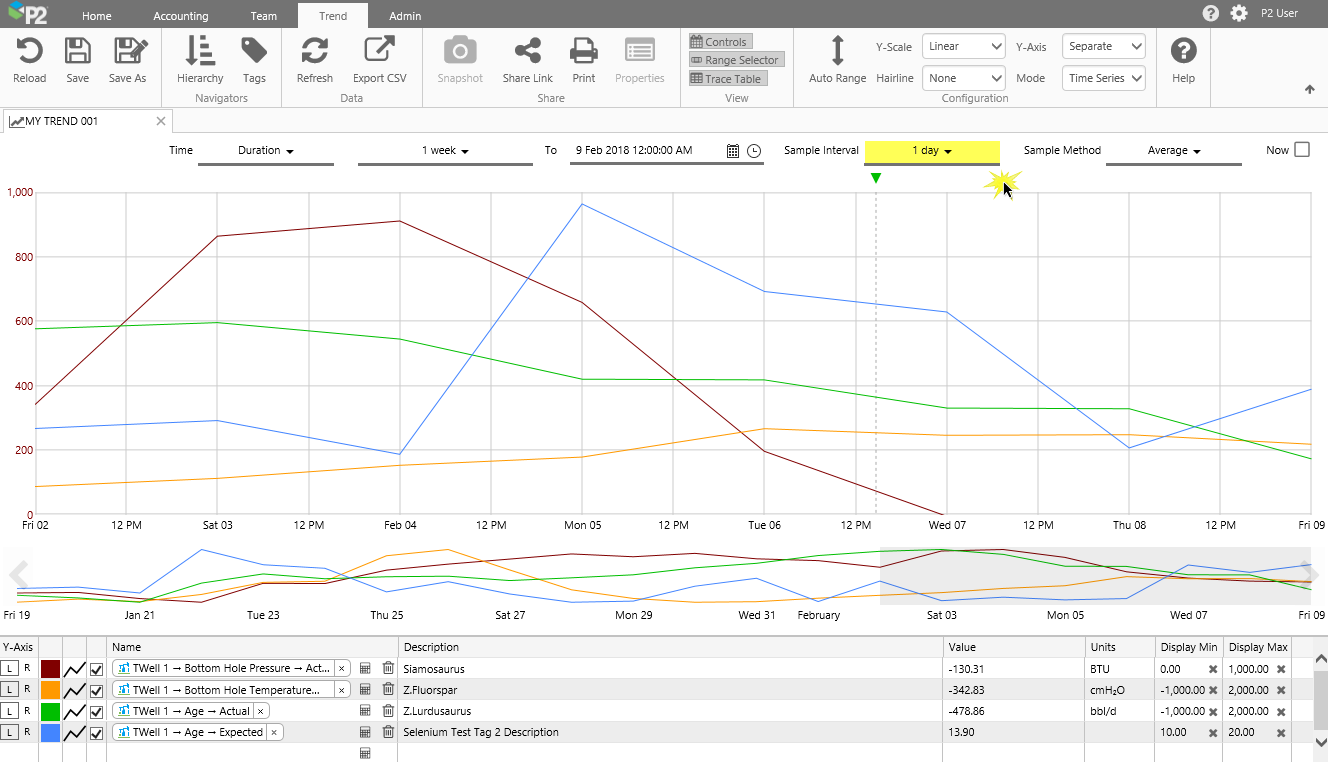
Step 2. Changing the Sample Interval
Here we have selected a 1 day sample interval. Note how the data points are at one day intervals.
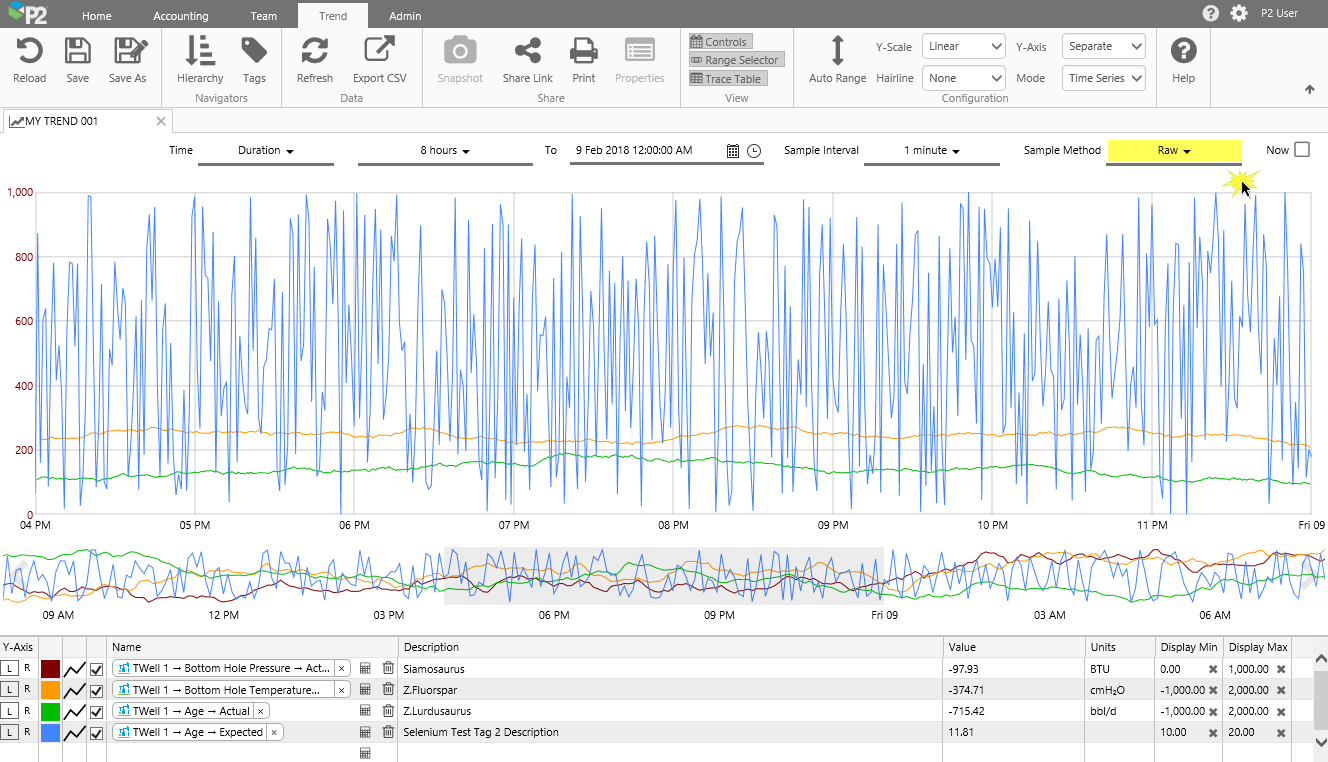
Step 3. Changing the Sample Method
Here we have selected the Raw sample method. Note how the duration and sample interval change for this.
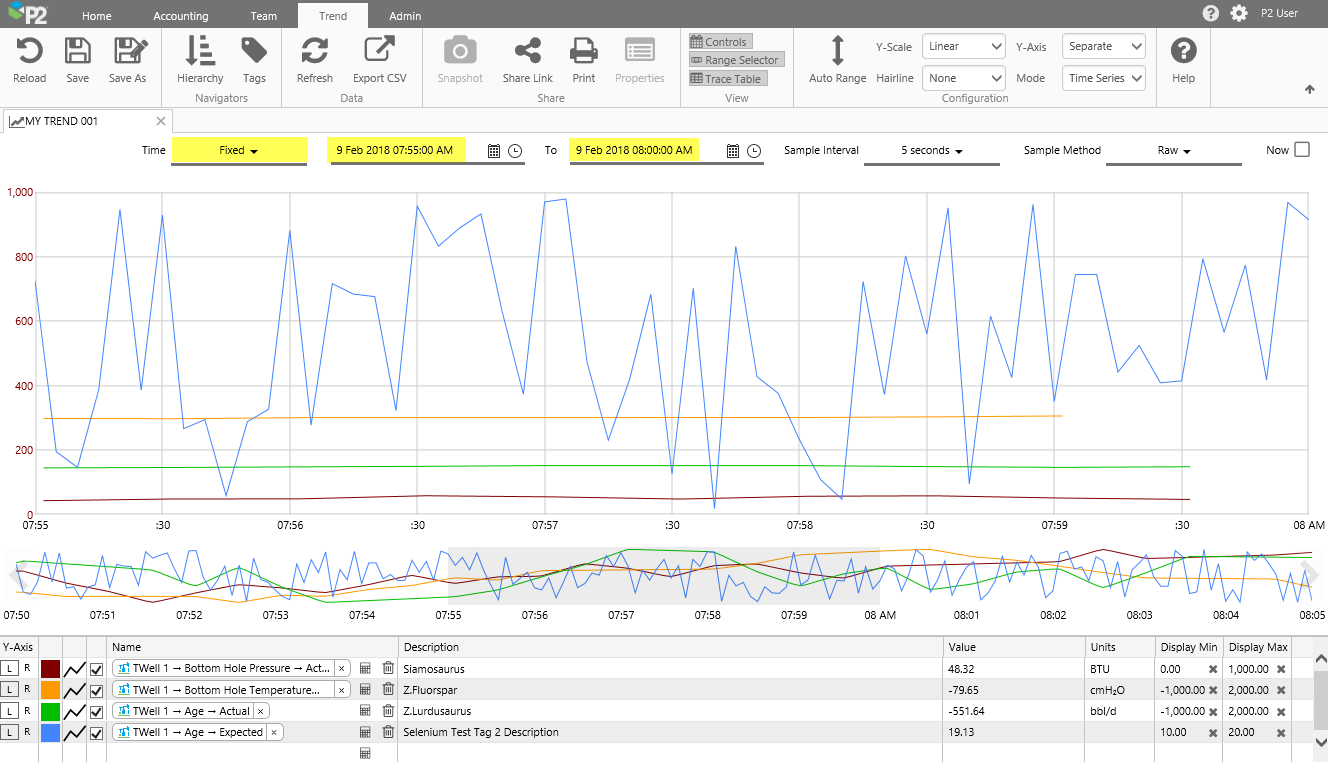
Step 4. Selecting Fixed Times
Here we have selected a period of 9 Feb 2018 07:55:00 AM to 9 Feb 2018 08:00:00 AM.
Tutorial 3: Range Selector
In this tutorial, we will change the time selections using the Range Selector, located below the Trace Window. The Range Selector works interchangeably with the Time trend controls to set your trend time range. The range selector has a highlighted section that matches the time range set by the date pickers, with double that time period shown before the selection if Now is selected (for example, for a new trend).
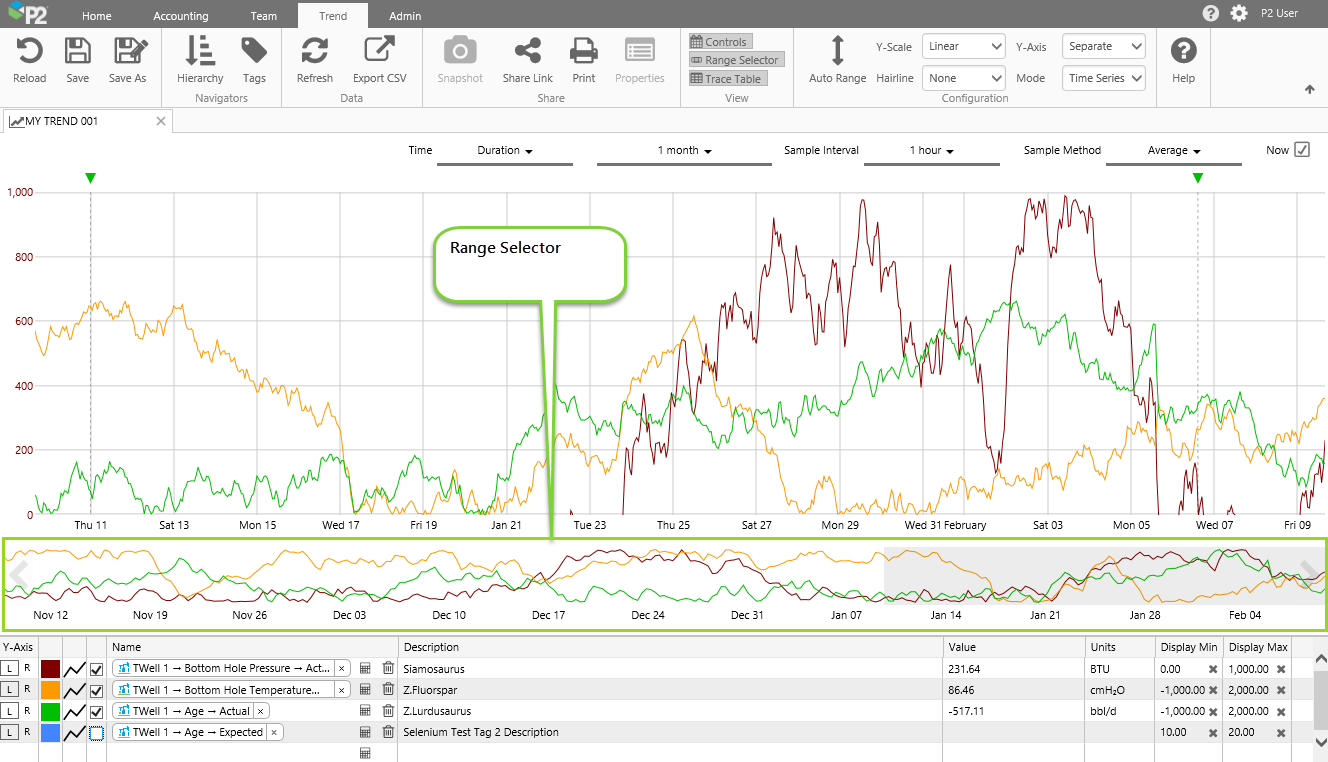
Resizing the highlighted section
1. Hover the mouse over the left or right edge of the highlighted section, until you see the mouse horizontal resize pointer ![]() .
.
2. Now click and drag to left or right. Note how the trend start and end time changes.
Moving the highlighted section
1. Hover the mouse over the central portion of the highlighted section, until you see the mouse move pointer ![]() .
.
2. Now click and drag the whole highlighted section to left (earlier) or right (later). Note how the trend start and end time changes.
Changing the Range Selector start and end dates
- Click the left or right arrow to move the start and end date of the range selector.
Note that the dates on the highlighted section do not change; the highlighted section just moves across (to left or right) in relation to the changing start and end dates of the range selector.

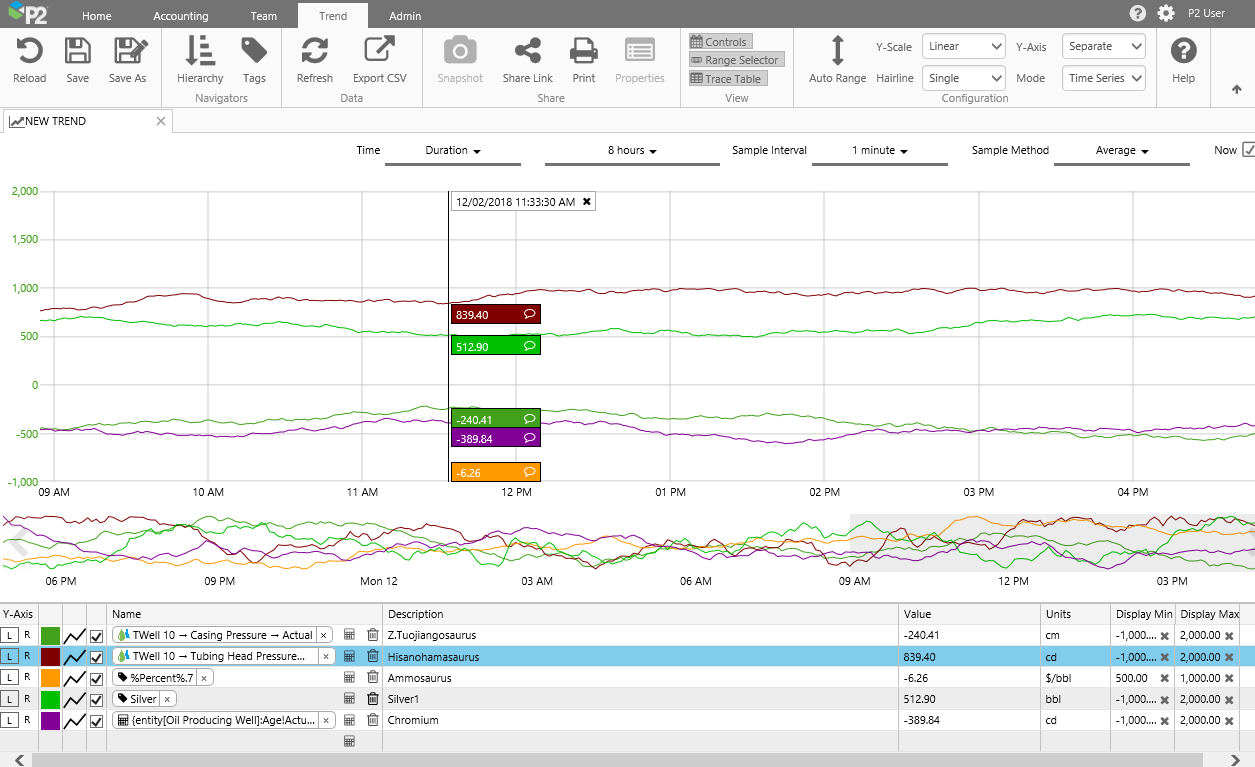
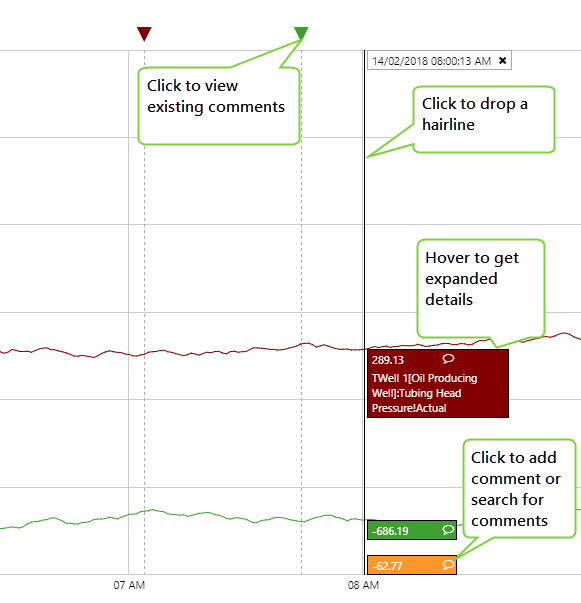
Tutorial 4: Hairline and Comments
1. On the ribbon, select a hairline mode (not None).
2. Click to add a hairline.
Note that existing comments can be viewed, irrespective of whether there is a hairline, but if you want to add a comment or search for one over a period, you need a hairline.
Tutorial 5: XY Mode
Changing to XY Mode can be done in a single step. In this tutorial we'll start by adding some items to the trend. Then we'll change the mode to see how the trend changes in XY Mode. Next, we'll select a different X-Axis from the two trace items.
1. Drag and drop two attributes onto the trend.
We've used TWell 1[Oil Producing Well]:Casing Pressure!Actual and TWell 1[Oil Producing Well]:Bottom Hole Pressure!Actual, in our example.
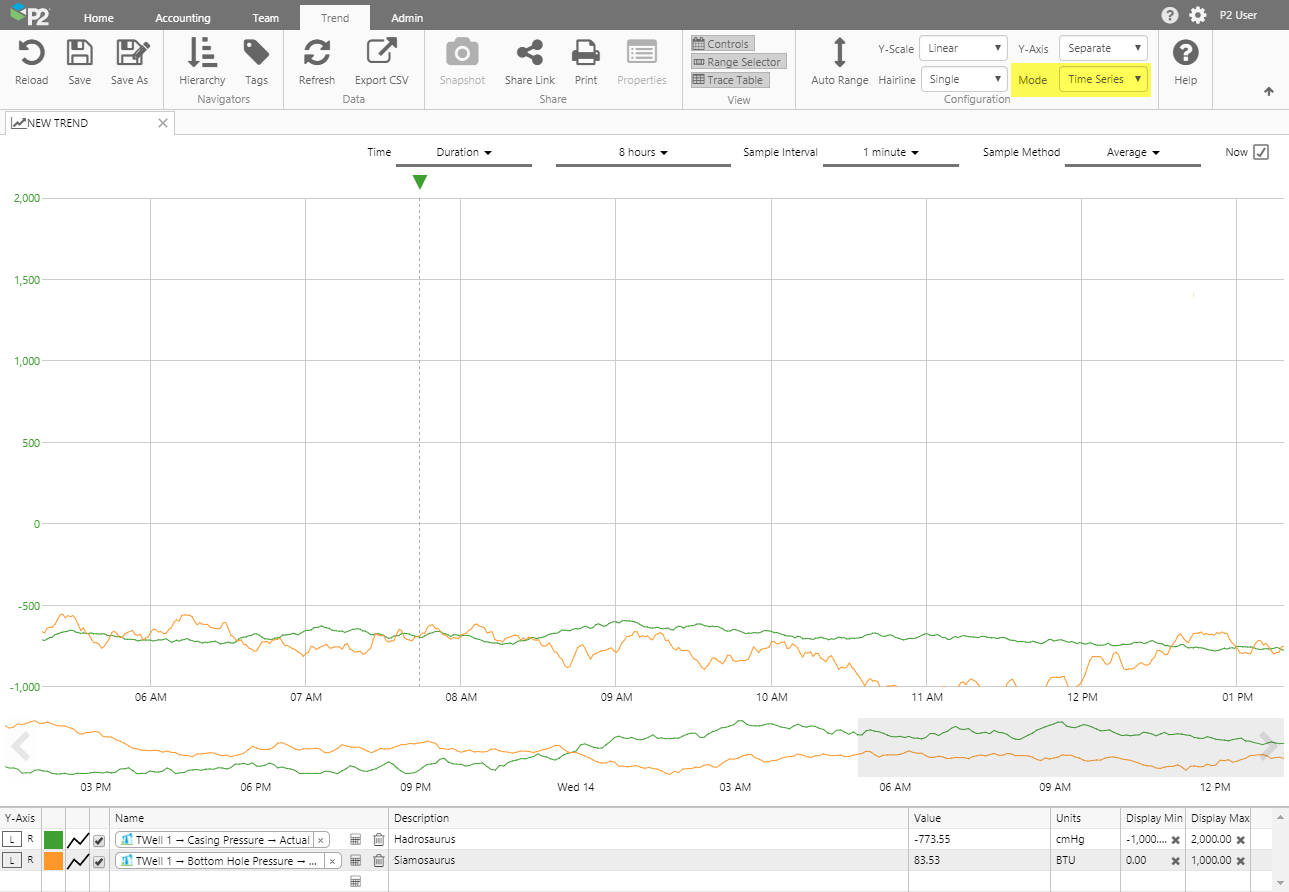 |
| The default mode for a trend is Time Series. Note how the times for the range selection are plotted along the X-Axis. |
2. Change the Mode to XY in the Configuration section of the ribbon.
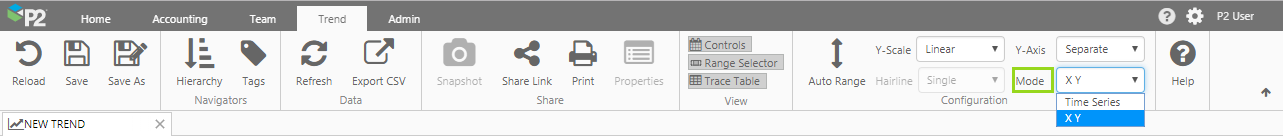
Note how the trace lines become dots. Also, note the changes in the Trace Table (the Trace Style and Value columns have been removed, and there is a new column for X-Axis).
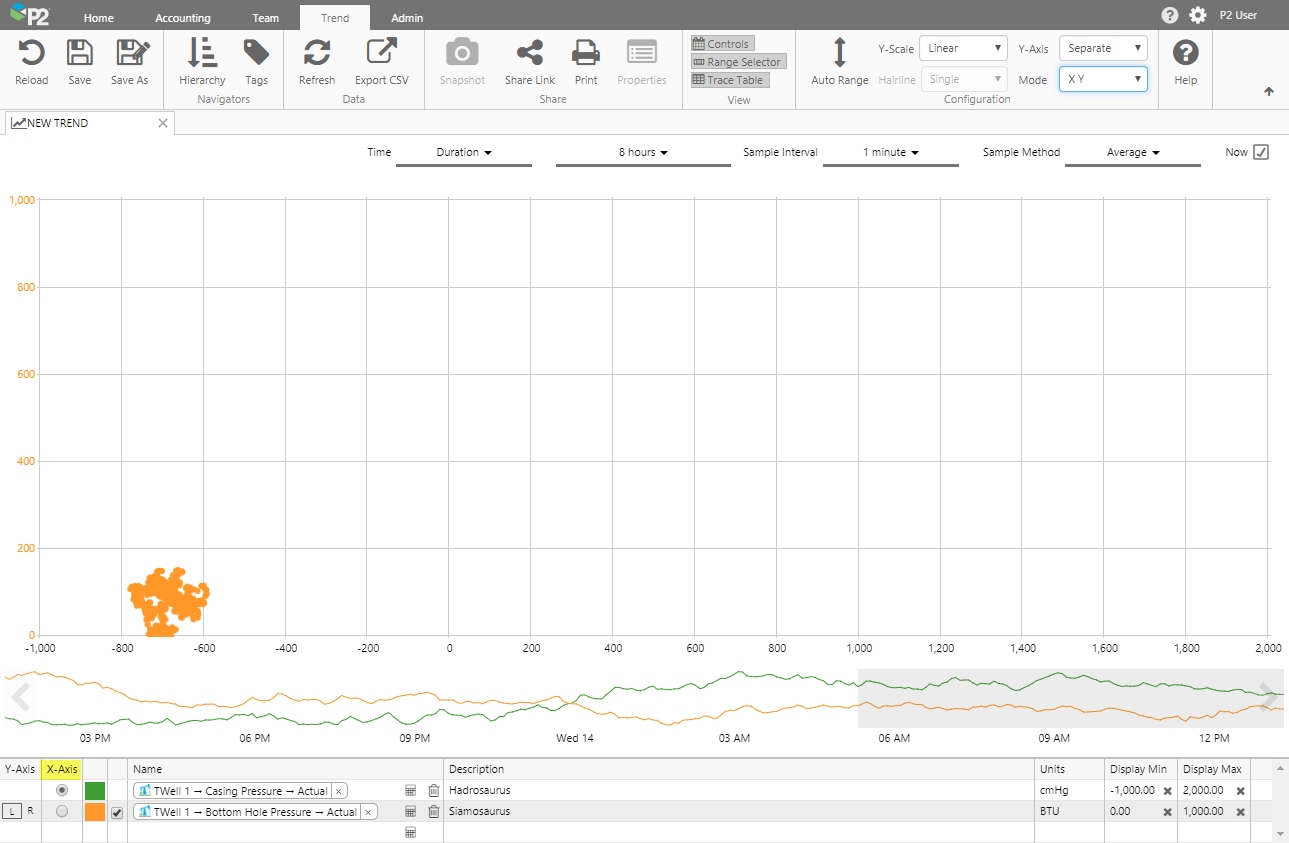 |
| In XY Mode, one of the trace items' values is used as the X Axis. Each dot on the chart is positioned at the XY co-ordinate of the Y trace item and the X trace item. |
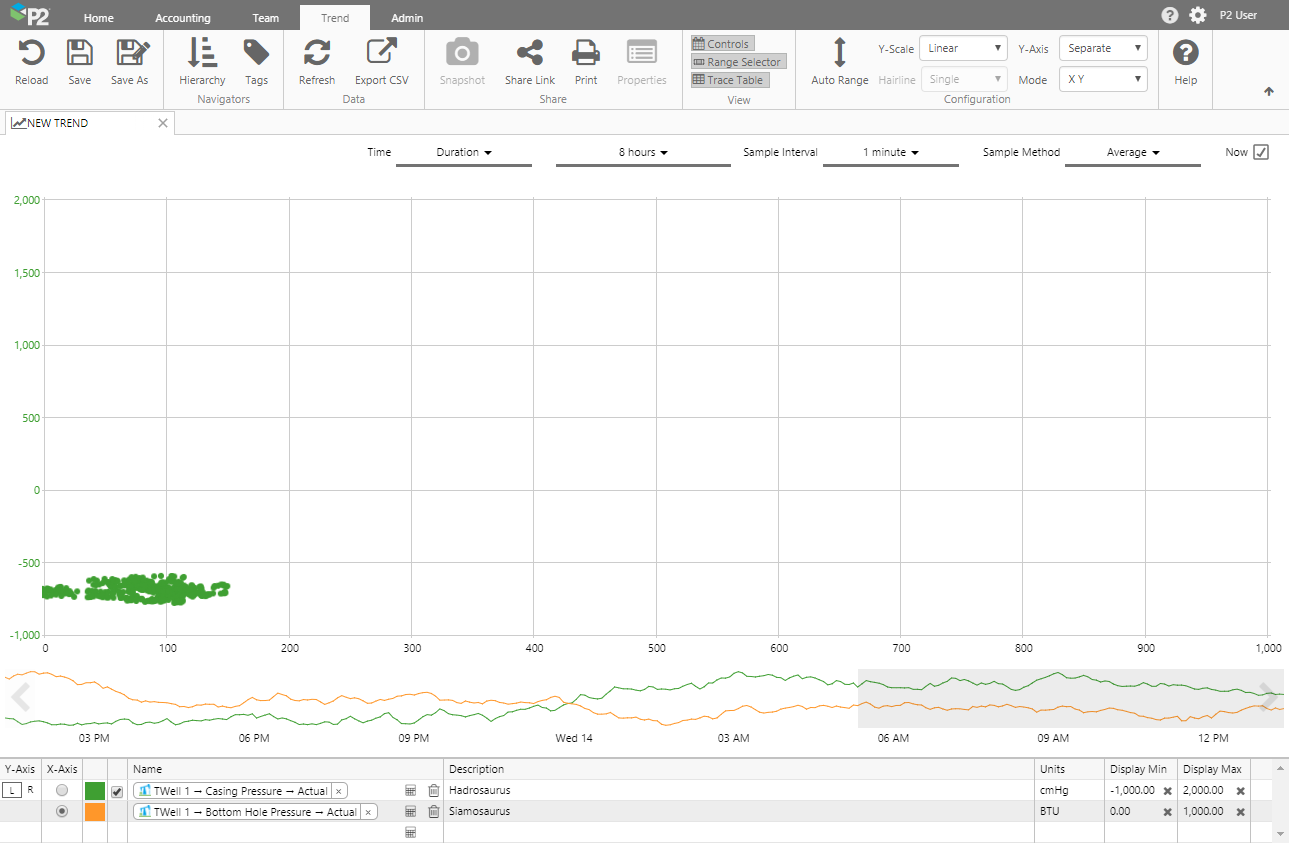
3. Click the X-Axis radio button next to the second trace item, and note how the chart changes.
Release History
-
Creating a Trend 4.5.5 (this release)
- 'Mode' option has been added in the Trend ribbon tab.
- Hairline appearance has changed.
-
Creating a Trend 4.5.4:
- There is a new Sample Method, called Adaptive Raw.
- Wildcard filtering in the trace table look-up.
- The Trend Ribbon now has a Save As as well as a Save button.
- The trend Sample Intervals, which are limited depending on the selected Time Range and Sample Method used, have had these limitations relaxed.
-
Creating a Trend 4.5.3:
- Trend ribbon tab has changed to include a View group and a Configuration group.
- Trend controls have inter-dependant options, for performance considerations.
- The display minimum and display maximum values can be reset to their stored values.
- Keyboard shortcuts are available for the trace table.
- The trace table layout has changed.
- The range selector and the controls bar are narrower, allowing more space for the trace window.
-
Creating a Trend 4.5.2:
- Trend ribbon tab has changed to include a View group and a Configuration group.
- Trend controls have inter-dependant options, for performance considerations.
- The display minimum and display maximum values can be reset to their stored values.
- Keyboard shortcuts are available for the trace table.
- The trace table layout has changed.
- The range selector and the controls bar are narrower, allowing more space for the trace window.
-
Creating a Trend 4.5:
- Trace name showing display name.
- Auto-complete tags and attributes for the trace name.
- In-line link to the Calculation Editor.
- Hairline information box positioning.
-
Creating a Trend 4.4.6:
- Trace Table layout and column changes (single trace table, value column, display min and max).
- Determining the Y-Axis (manual adjustments to display min and max, separate Y-Axes, Auto Range).
- Zero in Log Scale Plots.
-
Creating a Trend 4.4.5:
- You can add a templated attribute to the trace table.
-
Creating a Trend 4.4.4:
- The trace table now includes a description for tags and attribute values.
- Hover over a name or description in the trace table to see the full name/description in a tooltip.
-
Creating a Trend 4.3.2:
- Auto-refresh to 'Now'
- Show/Hide Trend controls
- Trace Table split into Left Y Axis and Right Y Axis
- Multiple hairlines available
- Creating a Trend 4.3.1