ON THIS PAGE:
Overview
The Trend Controls can be found at the bottom of the Trace Window.
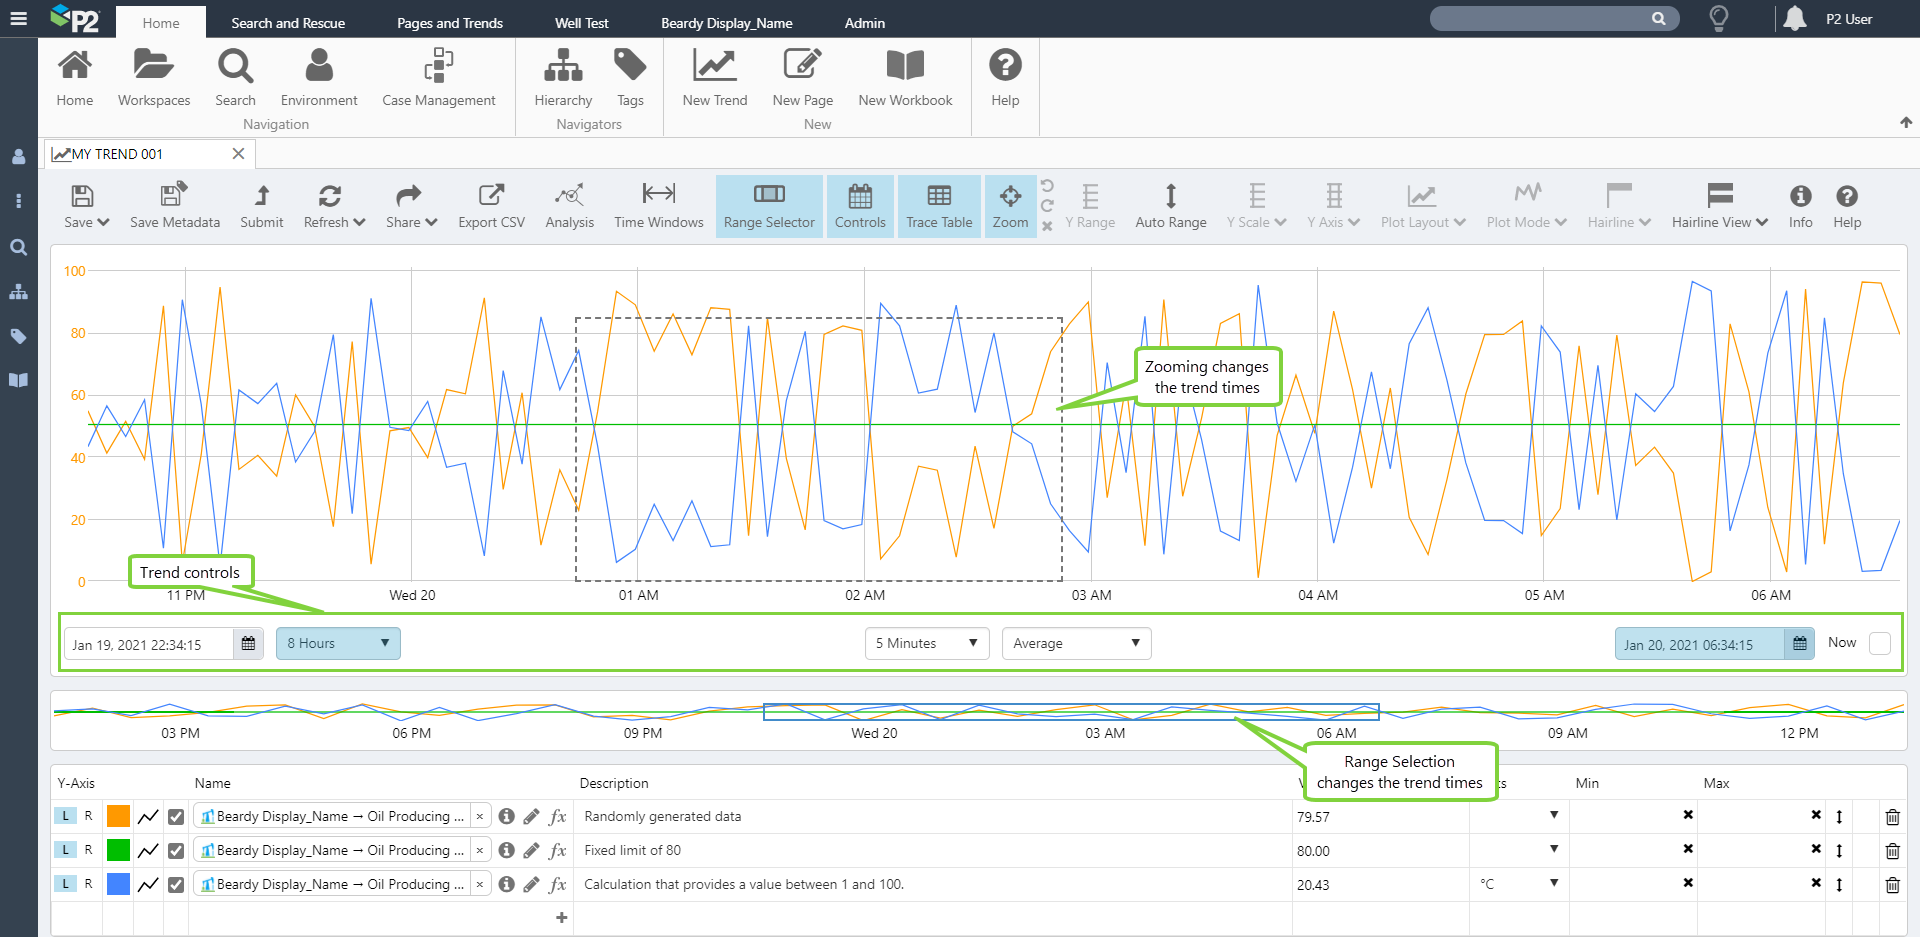
The Trend Controls is a group of controls that you use to change the trend period, as well as the sample interval and sample method, and is made up of:
- Time selectors
- Sample Interval selector (options include: 30 seconds, 1 minute, 2 minutes, 1 hour, 1 month, 3 months, etc.), depending on the other selections you have made
- Sample Method selector (options include: Average, Last Known Value, Linear Interpolate, Adaptive Raw, and Raw)
- The 'Now' option, which causes the trend to auto-refresh, when selected
Here is an example of trend control selections:
![]()
Notes on the Trend Controls
For performance reasons, the options available in the controls are interdependent.
If Raw is selected, the time setting becomes Auto and the duration is selected as 8 hours. The limit of 8 hours can be updated in Explorer's web.config file (MaximumRawDuration). You can choose a different duration from the available options, which also vary depending on the Sample Method.
The available Sample Intervals change depending on the trend's selected time range, or the selected Duration. The longer the trend's time range, the larger the available sample intervals are. This prevents too much data being requested (for example, you cannot request one year of data at a 20 seconds sample interval).
The Trend Control Selections
As well as being able to change the selections using the controls, you can also change the selection by using the range selector, or the zoom function.
Changing the Trend Control Selections
The selections you make on the Trend Controls affect the time range of the trend, as well as the data collection method (Sample Method) and interval (Sample Interval).
With 'Now' Selected
For a new trend, Now is pre-selected and the end time is set to the current time and date. This is how the controls look with Now selected:

| 1. | Start Time | This is starting time of the trend. Only one start time option can be selected, either Start Time or Duration - the selected option is highlighted in light blue. |
| 2. | Duration | This is the duration leading up to the current date and time (Now). To change the duration, select from the drop-down list (e.g. 8 hours, 3 days, 1 year). See Note above on how sample method and duration work together: Notes on the Trend Controls. |
| 3. | Sample Interval | This is the sample interval (for example, 1 hour) that P2 Server uses to collect the trend data. See Note above for how the sample interval is calculated based on the trend's time range. |
| 4. | Sample Method | This is the sample method (for example, Average) that P2 Server uses to collect the trend data. See Note above on sample method and duration, and how they work together. |
| 5. | End Time | This is the end time of the trend and with Now selected it is the current time. |
| 6. | Now | When you select Now, the trend end time is the current time and it refreshes at the Sample Interval rate (with 30 seconds as the lowest refresh rate). You can also click the Refresh button on the ribbon for an immediate refresh. |
With 'Now' Unselected
If you clear Now, the time controls change so that the end time is selectable. The End Time button changes to blue.
![]()
or:

| 1. | Start Time | Select the range start date and time from the Date/Time Picker. Only Start Time or Duration can be selected- the selected option is highlighted in light blue. |
| 2. | Duration or Start Time | If the time setting is Duration, then this is the duration leading up to the trend end time. To change the duration, select from the drop-down list (e.g. 8 hours, 3 days, 1 year). See Note above on how sample method and duration work together: Notes on the Trend Controls. |
| 3. | Sample Interval | This is the sample interval (for example, 1 hour) that P2 Server uses to collect the trend data. |
| 4. | Sample Method | This is the sample method (for example, Average) that P2 Server uses to collect the trend data. See Note above on sample method and duration, and how they work together. |
| 5. | End Time | This is the trend end time. To change the end time, select a date and time from the Date/Time Picker. |
| 6. | Now | When you select Now, the trend end time is the current time. This refreshes at the Sample Interval rate (with 30 seconds as the lowest refresh rate). You can also click the Refresh button on the ribbon for an immediate refresh. (The table above this one shows the controls where Now is selected.) |
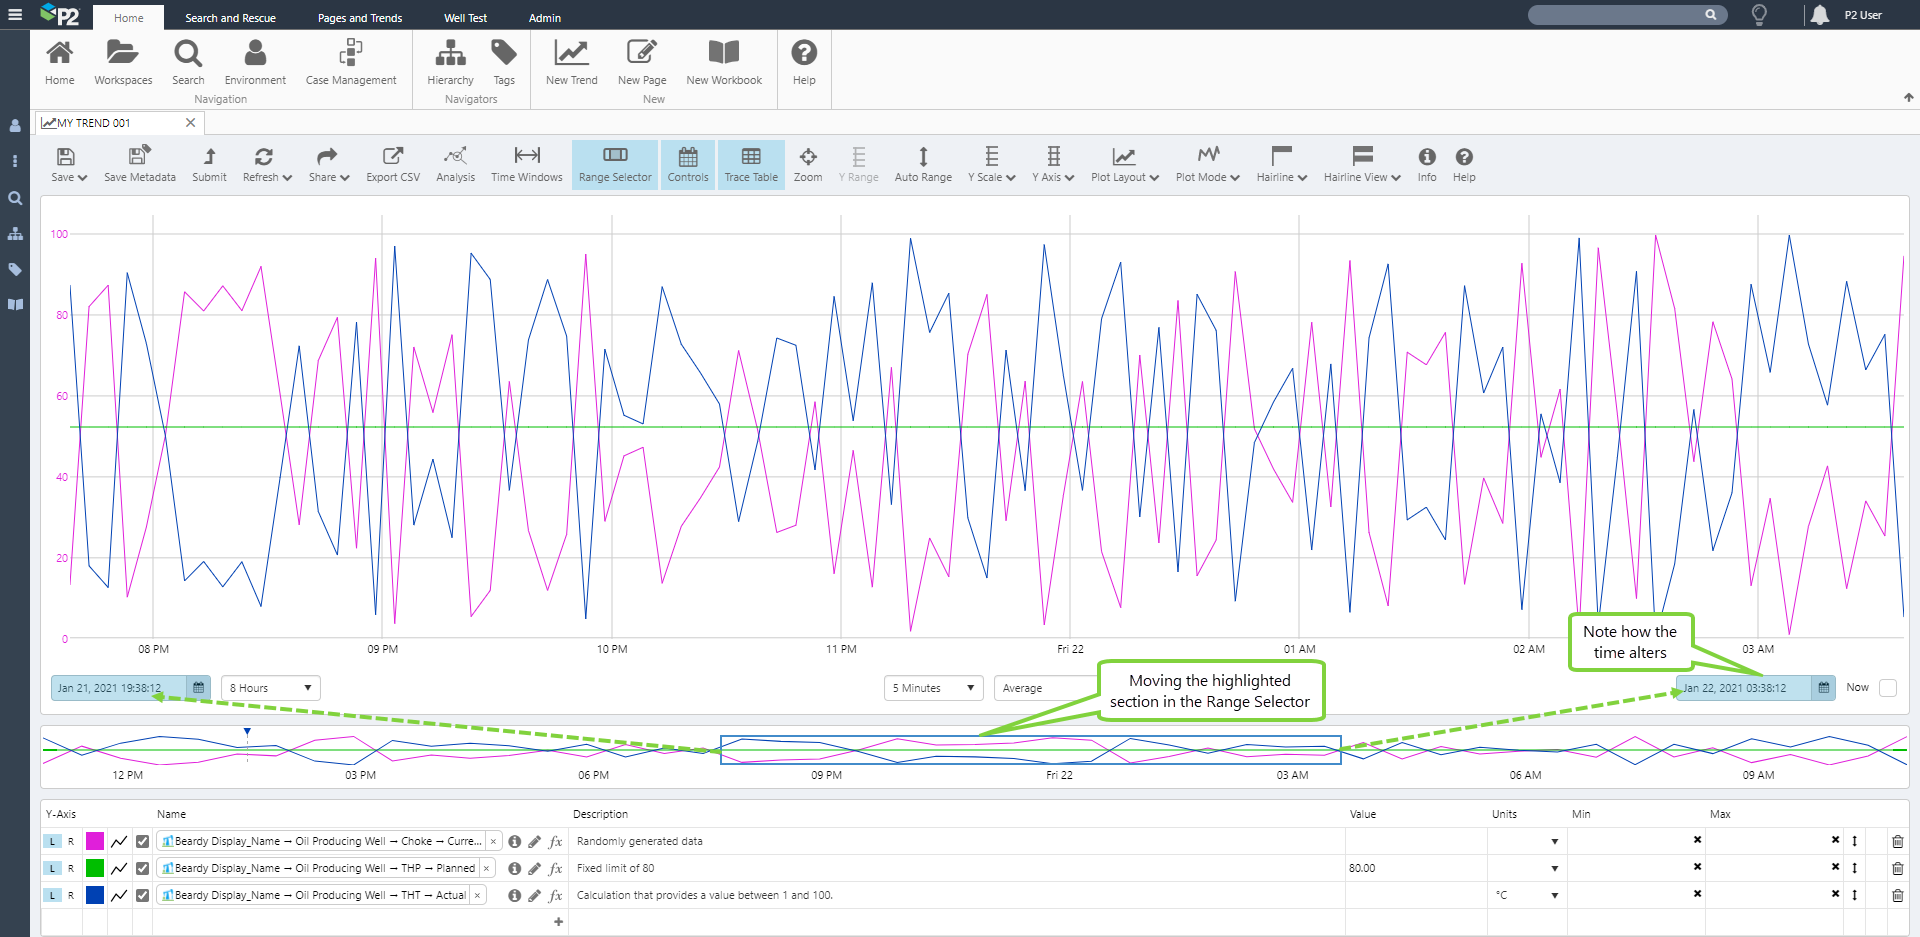
Changing your Time Selection with the Range Selector
The Range Selector, located below the Trace Window, works interchangeably with the Trend Controls to set your trend time range. The Range Selector has a highlighted section that matches the time range set in the Start Time and End Time selectors, with double that time period shown before the selection if Now is selected (for example, for a new trend).
Resizing the highlighted section
1. Hover the mouse over the left or right edge of the highlighted section, until you see the mouse horizontal resize pointer ![]() .
.
2. Now click and drag to left or right. Note how the trend start and end time changes.
Moving the highlighted section
1. Hover the mouse over the central portion of the highlighted section, until you see the mouse move pointer ![]() .
.
2. Now click and drag the whole highlighted section to left (earlier) or right (later). Note how the trend start and end times change.
Changing your Time Selection with the Zoom Feature
If there is a particular portion of the trace that you want to see in more detail, for example an unexpected spike in values, you can zoom into this to get a closer look, rather than using the Trend Controls.
Zooming changes the selected time range and sample interval, to give you an optimal view of the section you are interested in.
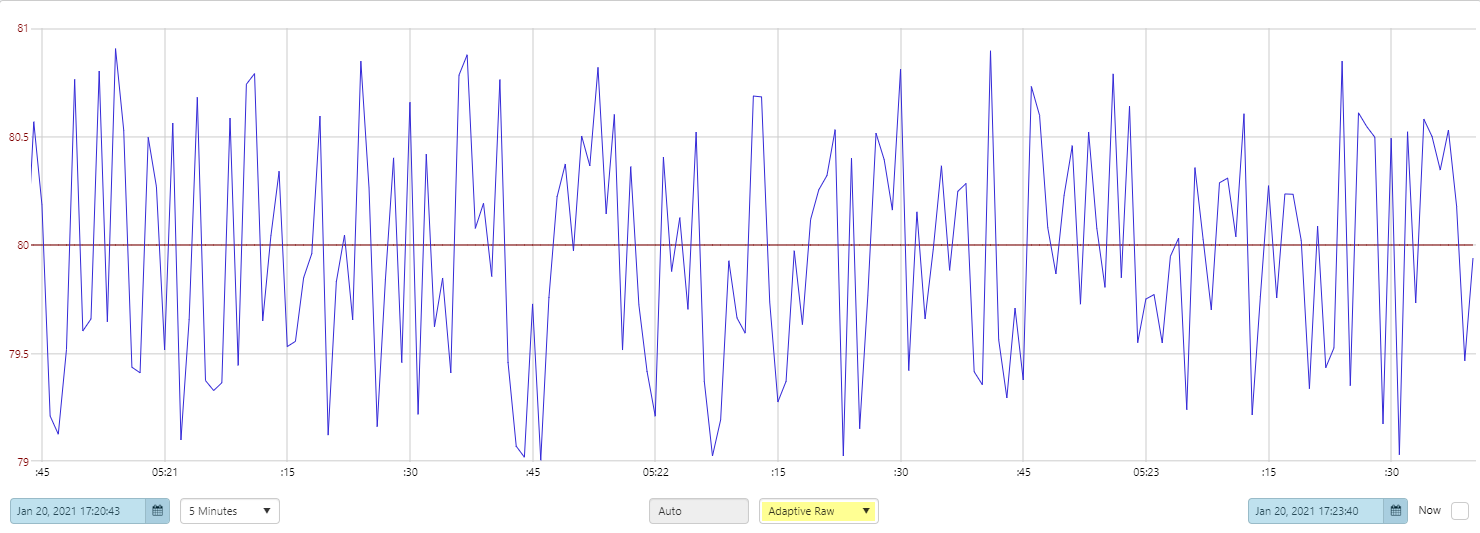
The Adaptive Raw Sample Method
The Adaptive Raw sample method works differently from the other sample methods.
Adaptive Raw fetches far fewer data points from P2 Server (a maximum of 2000 points), yet renders a trend that is virtually identical to that produced when using the ‘Raw’ sample method (you may need to adjust the Sample Interval for Raw, to notice this).
The Adaptive Raw method renders the trend much faster than the ‘Raw’ method does. The Sample Interval cannot be selected for this method; it is called ‘Auto’, and is determined automatically to deliver the optimal number of data points. Server fetches the raw data points from the Historian, then uses an algorithm within its calculation engine to reduce the number of points, before sending these on to Explorer for the trend. (Please note that when you export to CSV, these are the same points that are exported; not the raw points from the Historian.)
Using the Adaptive Raw method, you can view granular trends over up to two years, rather than up to eight hours when using the Raw method.
The duration of data can be limited to reduce the sample size retrieved from the data source . This can be configured in Explorer’s web.config file by site administrators, using a setting (MaximumAdaptiveRawDuration) that limits the duration dropdown in the Trend to only include options less than or equal to a configured maximum. For example, if this is set to 6 months, then options for 9 months, 1 year, and 2 years will not be available for selection in the Trend.
Note: When the Adaptive Raw sample method is selected, the trend will only export the rendered data, not all of the raw data.
Release History
- Trend Controls 4.9.4 (this release)
- Optional data limit in adaptive raw sampling
- Trend Controls 4.9.0
- Trend sampling controls updated and moved to below the graph
- Trend Controls 4.6
- Trend Controls 4.5.5
- Trend Controls 4.5.4