ON THIS PAGE:
All the work in Sentinel revolves around monitors. Monitors watch over entities for compliance with specified limits or conditions. When limits are exceeded, or conditions change, Sentinel raises an event and performs actions.
A monitor consists of a collection of tests, each having its own process. The tests all belong to the same category, which is defined in the monitor. They share a trigger and run concurrently.
Monitors also have actions, which are assigned to tests. Actions are performed when the specified limits or conditions of a test are met, raising an event.
What Does a Monitor Do?
Monitors contain tests, each of which runs through a specified process which raises events when pre-defined limits are exceeded, or when pre-defined states are reached.
Setting up the monitor
You can perform the following actions on a monitor:
- Add a new monitor.
- Copy an existing monitor.
- Edit a monitor.
- Remove the monitor from Sentinel.
- Move a monitor to a different folder, or to a different workspace.
- Approve or reject a monitor version.
Note: Approval and rejections functionality is part of Change Management, and is only applicable if Sentinel has been configured to use Change Management. - Re-run a monitor.
Results of a monitor
After running a monitor, you can do the following:
- Delete a monitor’s events and cases, and reset the states.
- View the latest events for the monitor.
- View asset report for assets that are used by the monitor.
- View the monitor status.
Parts of a Monitor
A monitor has the following parts:
| Monitor Details | The name, category, description, and status of the monitor. |
| Trigger | The trigger defines when the tests are started. |
| Tests | Tests are the activity hub of the monitor. Each monitor uses at least one test. Each test evaluates one or more entities against predefined limits (states or values), by using one of the Sentinel processes. The test results can cause events of particular states (each state being configured to a severity level), which in turn cause predefined actions to trigger. |
| Actions | The activity that occurs as a result of a Sentinel event. A standard Sentinel action is an email or SMS notification, or a web service action. Sentinel can also be configured to allow A-Plus actions. Actions may be added to the monitor and assigned to the various tests. |
| Post Process | When the monitor finishes running, Sentinel calls a web service, if this has been selected in the Post Process section of the monitor. Note: The web service needs to be specified in the Sentinel Configuration file. |
| Versions | Every time the monitor is updated and saved; a history of the changes is retained. |
For more details on the monitor components, see below.
Monitor Details
The monitor’s name and description defines the monitor. The monitor’s name is a label for the monitor in the hierarchy of the Workspace panel.
Any open tabs in the Main panel that relate to the monitor have the monitor’s name as a header. For example, the monitor status tab and the monitor event tab both use the monitor’s name as a header.
The monitor category is used in reporting, and in the selection of the forms used when a case is raised.
You can disable or enable a monitor in the monitor details section. The monitor is enabled by default unless it is a copied monitor.
If you don’t want to store events relating to the monitor, select the Disable Event Storage check box.
Monitor Category
The monitor category is used in reporting and when Case Management is enabled. Some examples of available categories are:
- Financial
- Operational
- Environmental
- Occupational Health and Safety
- Maintenance
There may be additional or different categories, depending on your installation.
When Case Management is enabled the monitor category is used to filter the list of the available case forms that can be used when a case is raised.
Triggers
Every monitor has a trigger. The trigger defines when the initial and subsequent monitor tests are processed. All tests within a single monitor share a single trigger.
There are four different types of triggers:
- Periodic trigger
- Date trigger
- Monitor Chaining trigger
- Application trigger
For all trigger types, the sample data is collected at the current trigger time, for the whole processing period. The processing period is the time between the last trigger time (last run finish time), and the current trigger time.
For the first trigger time, the processing period is the time between the monitor start date and time, and the first trigger date and time.
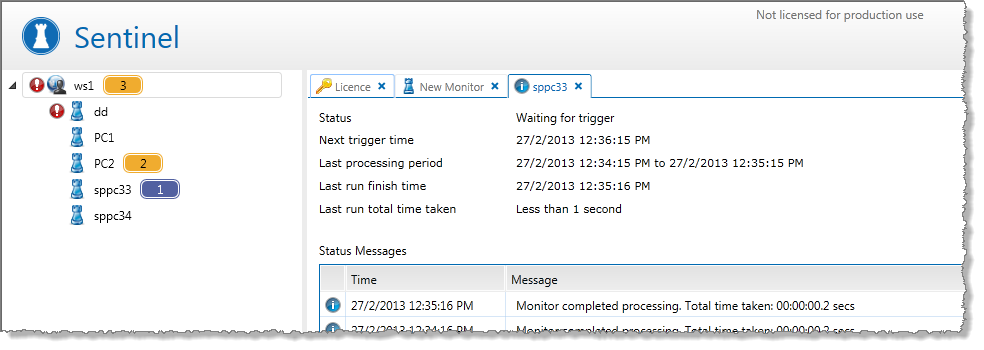
The status page for a monitor displays the following information:
- Status
- Next trigger time
- Last processing period
- Last run finish time
- Last run total time taken
- Current processing period
Note: The current processing period only appears when a monitor is currently processing data.
Periodic Trigger
For periodic triggers, the tests are processed at set intervals. You define a start time (immediately or sometime in the future), and a repeat interval (for example, every minute, every two minutes, every hour, every week or every two hours, every two days, and so on). The periodic trigger can also be quantised.
Quantised Periodic Trigger
The quantise option is only available for the periodic trigger type. The quantised periodic trigger can affect the outcome of events for normal processing and also for catch-up processing.
Catch-ups
A process catch-up occurs when the Sentinel engine has stopped for a period of time, and is then restarted. After the engine is restarted, processes need to catch up processing data for the period that the engine was stopped. A process catch-up also occurs when a monitor is re-run. Catch-up processing for a monitor that uses a periodic trigger is performed in chunks determined by trigger intervals, the processing parameters (MinCatchUpMonitorRunMinutes and MaxCatchUpMonitorRunMinutes), and the total run period.
Using the Quantise Option
If the quantise option is selected for a periodic trigger, this ensures that the monitor is triggered at exact intervals from the start time.
For example, if the start time is on Monday at 12:38 pm, and the quantised period trigger is set to run every day, then the monitor runs on Monday at 12:38 pm (trigger start time), Tuesday at 12:38 pm (trigger start time plus trigger interval), Wednesday at 12:38 pm (last trigger time plus trigger interval), Thursday at 12:38 pm (last trigger time plus trigger interval), Friday at 12:38 pm (last trigger time plus trigger interval), and so on.
In the same example, if the quantise check box is not selected, the monitor will still attempt to run at set intervals; that is, on Monday at 12:38 pm(trigger start time), Tuesday at 12:38 pm (trigger start time plus trigger interval), Wednesday at 12:38 pm (last trigger time plus trigger interval), Thursday t 12:38 pm (last trigger time plus trigger interval), Friday at 12:38 pm (last trigger time plus trigger interval), and so on.
However, if there is any lag at all, the trigger intervals might not be exact; this is a factor of Sentinel’s optimisation functions.
So, for example, there may be trigger times of: Monday at 12.38 pm, Tuesday at 12:38 pm, Wednesday at 12:38 pm, Thursday at 12:38 pm, Friday at 12:39 pm (slipped by a minute), Thursday at 12:40 pm (slipped by another minute), and so on.
When a monitor is re-run, or when the Sentinel engine is restarted (prompting catch-up processing), further problems may occur if quantised is not selected. The catch-ups may be conducted in smaller intervals (for example, half-hour intervals to catch up one day), possibly causing more events than what a one-day trigger interval would normally produce.
For example, a Sentinel process using 24-hour periodic trigger produces a single event. During a catch-up, the un-quantised periodic trigger causes the process to produce an event every hour, as it is catching up in one hour chunks.
For quantised triggers, this sort of variance in behaviour is also affected by the MinCatchUpMonitorRunMinutes and MaxCatchUpMonitorRunPeriodMinutes parameters.
To manage how catch-ups are performed, you need to understand the different rules defined in the following section.
Quantised Triggers and Catch-Up Parameters
Sentinel has different process catch-up behaviours, depending on the values in the Sentinel configuration parameters MinCatchUpMonitorRunMinutes and MaxCatchUpMonitorRunMinutes.
Catch-up behaviour is further determined by the value of the quantised periodic trigger (where applicable), as well as the total run period (the period that needs to be caught up).
Note: We recommend that the quantised trigger interval is an exact multiple of the MaxCatchUpMonitorRunMinutes.
Rule 1: Catch Up with MaxCatchUpMonitorRunMinutes Overriding Quantised Trigger Interval
If the quantised trigger interval is greater than MaxCatchUpMonitorRunMinutes, then MaxCatchUpMonitorRunMinutes overrides the quantised trigger interval (that is, processing will occur in time chunks the size of MaxCatchUpMonitorRunMinutes, rather than the quantised trigger interval).
Example:
MaxCatchUpMonitorRunMinutes is 24 hours. Quantised trigger interval is 48 hours. The catch-up is processed in 24-hour chunks.
Note: The default value for MaxCatchUpMonitorRunMinutes is 1440 (24 hours).
Rule 2: Catch Up with MinCatchUpMonitorRunMinutes Overriding Quantised Trigger Interval
If the quantised trigger interval is less than MinCatchUpMonitorRunMinutes and the total run period is greater than MaxCatchUpMonitorRunMinutes, then MinCatchUpMonitorRunMinutes overrides the quantised trigger interval (that is, processing will occur in time chunks the size of MinCatchUpMonitorRunMinutes, rather than the quantised trigger interval).
Example:
MaxCatchUpMonitorRunMinutes is 24 hours. Quantised trigger interval is five minutes. MinCatchUpMonitorRunMinutes is one hour. Total run period is 26 hours. The catch-up is processed in one-hour chunks.
Note: The default value for MinCatchUpMonitorRunMinutes is 60 (One hour).
Rule 3: Catch Up with Quantised Trigger Interval
If the quantised trigger is not overridden due to conditions described in Rule 1 and Rule 2, above, the catch-up occurs in data chunks the same size as the quantised trigger interval.
Example 1:
MaxCatchUpMonitorRunMinutes is 24 hours. Quantised trigger interval is five minutes. MinCatchUpMonitorRunMinutes is one hour. Total run period is 12 hours. The catch-up is processed in five-minute chunks.
Example 2:
MinCatchUpMonitorRunMinutes is one hour. Quantised trigger interval is two hours. The catch-up is processed in two-hour chunks.
How Does the Quantised Periodic Trigger Affect Events?
Because the quantised periodic trigger processes data at exact intervals, events (if these occur) can also be expected to relate to these exact intervals (occurring between the start and end of an interval).
So, if you have set up a daily trigger to go off at 1:00pm, for example, all events viewed from after 1:00pm onwards on any day will have occurred up until 1:00pm on that day, and not after. That is, if you view a day’s worth of events at 1:15pm on Tuesday, those events will be from 1:00pm on Monday until 1:00pm on Tuesday, and no later.
If your periodic trigger is not quantised, the trigger period may not be as accurate. Here, if you view a day’s worth events from 1:00pm on Monday, these may include events from 1:10pm on Tuesday, or even later.
Example: Quantised Versus Un-Quantised Periodic Triggers
In the following example, events from the five trigger periods leading up to 2.30pm are used for reporting. Using a quantised hourly trigger period, set to run on the hour every hour, the last five trigger periods are at exactly 10:00am, 11:00am, 12:00pm, 1:00pm and 2:00pm (see Figure 1).The events that take place during this time are events 1, 2, 3, 4 and 5.
Using the exact same data, but running off an un-quantised periodic trigger (see Figure 2), the actual events are the same, yet those that occurred over the last five trigger periods form a slightly different group. This is because the trigger has shifted forward by half an hour (in this example, for the purpose of illustrating the potential behaviour of non-quantised period triggers).
The last five trigger periods are thus 10.30am, 11:30am, 12:30pm, 1:30pm and 2:30pm. The events that take place during this time are events 2, 3, 4, 5 and 6. Note that event 1 falls outside of the range of the last five trigger intervals, and that event 6 has taken place (whereas for the quantised trigger period this has not been processed yet).
Summary:
- Quantised Periodic Trigger used for the monitor
- Looking at the last five intervals
- The trigger interval is 1 hour
Key:
| Current time (2.30pm) | Events (1 through 6) | Trigger interval | |||
| Data item | The periods between intervals (looking at the last four from 10:00am) | ||||
Figure 1. Using a quantised periodic trigger, on the hour:
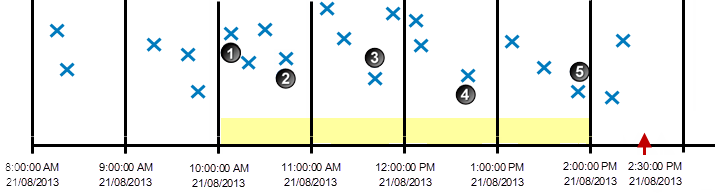
Figure 2. Using an un-quantised periodic trigger:
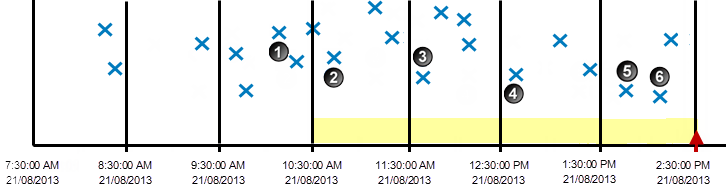
Note how the trigger times have shifted, yet the data and the events remain the same.
Date Trigger
For date triggers, the test processes can be set to run at daily, monthly, or yearly intervals at a set time. As with the periodic trigger, you can set a date trigger to start immediately, or at a specified time in the future.
Note: Monitors that use a periodic trigger or a date trigger are started as soon as they have been saved and approved (if enabled).
Monitor Chaining Trigger
States raised by a test within a monitor can be set to trigger a different monitor. To achieve this outcome, the triggered monitor needs a monitor chaining trigger; any test within the triggered monitor should use the Monitor Chaining Source as its source, in order to be triggered by states.
The monitor chaining trigger can be activated by various selected states, from a selected test within another monitor.
The monitor that is triggered by monitor chaining can also be linked to another monitor for monitor chaining, and this one can be linked too, and so on, resulting in several linked monitors.
Application Trigger
The application trigger causes the monitor to be started by an external application. There is no next start time. The next trigger time (if any) is dependent on the external application.
In order to activate the trigger, you need to make a call from an external application to the Monitor Triggering Service using the SOAP, the HTTP GET or the HTTP POST request method, using the applicable URL, as shown below.
SOAP Request Method
- Make a SOAP request to the following URL:
https://Sentinel/Server Name]:[Sentinel Server Port]/Sentinel/MonitorTriggeringService
HTTP GET Request Method
- Make an HTTP GET request to the following URL:
https://[Sentinel Server Name]:[Sentinel Server Port]/Sentinel/Trigger/MonitorName=[Monitor Name]
HTTP POST Request Method
- Make an HTTP POST request to the following URL:
https://[Sentinel Server Name]:[Sentinel Server Port]/Sentinel/Trigger/TriggerMonitorNameWithPostData - Type the name of the triggering monitor in the body of the HTTP POST request.
The application trigger activates every time a call is made from an external application.
Monitor Status
The monitor always has a current status. The monitor starts as soon as you have created and saved it, with a started status.
The monitor status can include any of the following:
- Started
- Stopped
- Waiting for trigger
- No approved version
- Disabled
- Running
- Re-running
- Deleting events
Note: Where an application trigger is used, the monitor only starts when an external application makes a call to the service.
You can view current monitor status information, as well as a history of monitor status messages, on the View Status page. This is explained in the section Viewing Monitor Status.
Note: If a monitor is running, this is indicated by a rotating processing icon in the workspace panel.
Monitor Behaviour
Once a monitor has been set up, each of its tests will behave in the following manner.
Data moves through the Sentinel test flow, following these steps:
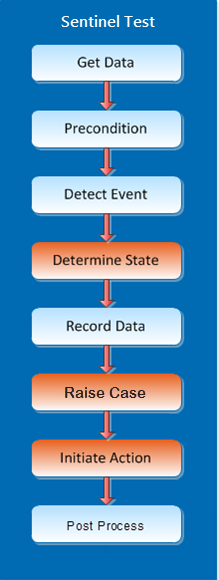
Get Data: Sentinel fetches time-series data directly from Explorer.
Precondition: If a precondition is defined, each portion of data must pass the precondition rules before it is tested any further.
Detect Event: An event is defined according to conditional logic. The event depends on the process used, and on the data values.
Note: Sometimes there is no data at all. For tests using a discrete data process, such as the Discrete Min Max process, this causes a No Data event. For tests using a continuous data process, this may cause three different possible outcomes, depending on what has been configured in the Sentinel configuration file (parameter NoDataBehaviour):
- Error: This causes a monitor error. A monitor may stop after a certain number of monitor errors have occurred (as defined in the configuration file).
- Ignore: This has no effect on the processing. There will be a gap in the event data.
- Suppress: A Suppressed event is raised with the following message: Processing was suppressed because no data was returned for <entity-name>.
Determine State: The Sentinel Engine determines the state based on the event. If the state changes, a new event is raised. States can be renamed if preferred, and can be mapped to different severity levels.
Record Data: Sentinel maintains a database with the history of events across the lifetime of the system. Information is used in Sentinel reporting and is displayed in the Sentinel Event Log; it can also be published into Explorer for analysis. Note that you have the option to disable event storage, in the configuration tab of a monitor.
Note: Comments can be added to event data. These are also saved to the database.
Raise Case: If Sentinel is configured to use Case Management and if the state for this test is configured to raise a case then, depending on the case options for the test, a case is raised. Actions may be deferred, depending on the state’s configuration.
Initiate Action: Sentinel will notify specified personnel (using email or SMS actions), or call a web service (using a web service action), when a particular state has been reached. This is all configured when the monitor is created. Other actions that trigger further processing can also be added to the Sentinel installation.
Note: If Case Management is enabled, actions may be deferred until the case is confirmed. This depends on the state’s configuration.
Post Process: When the monitor finishes running, Sentinel calls a web service, if this has been selected in the monitor configuration tab.
Change Management of Monitors
Privileges: To submit a monitor for approval (or to unsubmit it) you need a security role that has the Sentinel Workspaces Edit privilege.
The change management process ensures that new monitor versions are approved before they can run. The current approved version of the monitor continues to run, until the new approved version is ready.
Change management is optional in Sentinel, and is disabled by default. It can be enabled in the Sentinel configuration file.
Scenarios of Changes to Monitors Under Change Management
Figure 1: Changes are saved, submitted for approval, and approved.
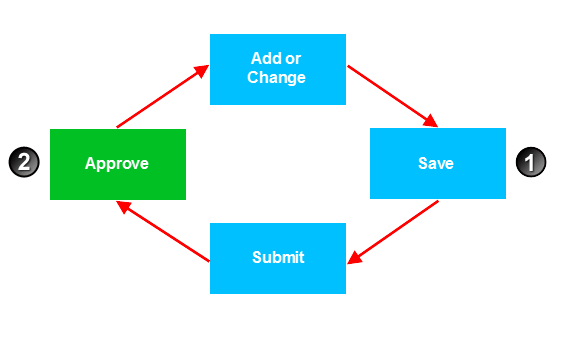
Figure 2: Changes are saved, submitted for approval, and rejected.
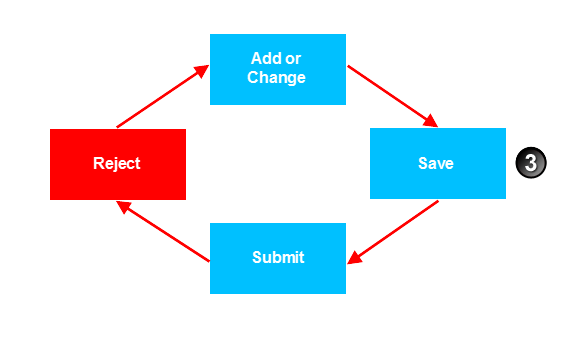
Figure 3: Unsubmit changes. Run on previous major version.
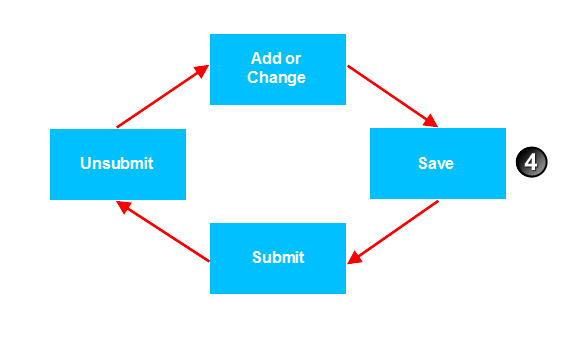
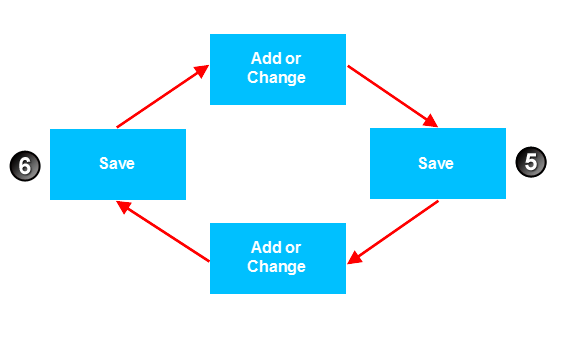
Figure 4: Changes are saved, changed, and then saved again. Monitors are run on the previous major version.
|
Figure |
What has happened |
Version Outcome |
|
|
Figure 1 |
Changes are saved, submitted for approval, and approved. |
|
New Minor version created. New Major Version created. |
|
Figure 2 |
Changes are saved, submitted for approval, and rejected. |
|
New Minor version created. |
|
Figure 3 |
Changes are saved, submitted for approval, and unsubmitted. |
|
New Minor version created. |
|
Figure 4 |
Changes are saved, changed, and then saved again. |
|
New Minor version created. New Minor version created. |
Monitor Change Management Process
If change management is in place, the following steps need to be taken before the monitor runs at the new version:
- Submit monitor for approval: The person making the changes to the monitor submits the monitor for approval after saving changes. The monitor is assigned with the next minor version number. If it is an existing monitor, it continues running at the previous major version.
- Awaiting approval: After submission, the monitor awaits approval. The monitor details appear in the My Tasks panel task list of personnel who have approver privileges for the workspace in which the monitor is stored. Note: You cannot edit the monitor while it is awaiting approval. To edit, first unsubmit the monitor.
- Approve or reject monitor: A person with approver privileges for a particular workspace can view pending approvals for that workspace, and can approve or reject the relevant monitors. Note: Personnel with approver privileges have a list of monitors requiring approval in their My Tasks queue.
- New version: As soon as the monitor is approved, it acquires a new major version number, and continues running at the new major version. Rejected monitor changes must be revised before the change management process is repeated.
- Refresh: When you try to edit or view a monitor that has had a major version change, you need to refresh the latest version changes before you can save any further changes.
Major and Minor Versions
Minor versions are only used if the installation is configured to use change management.
Versions with change management enabled:
When change management is in place, monitors are saved with a new minor version number, whereby the digit after the decimal point is incremented by 1 (for example version 3.1 moves to version 3.2 after a save, and then to version 3.3, and so on).
After the new monitor version is approved, the next version number is a major version number, replacing the last minor version number (for example, minor version number 3.5 becomes major version number 4.0). The major version number is incremented by 1 (for example, if the last major version number was 3.0, the next major version number is 4.0).
Versions without change management:
When there is no change management, the version numbers are whole integers that increment by one with every new save.
Approvers
The Approvers role only applies if change management is in place.
Privileges: To approve submitted monitors, you either need a security role that has the Workspaces Approve privilege (allowing you to approve any submitted monitor), or you need privileges to approve monitors within a specified workspace.
Approvers for a workspace are personnel belonging to any of the selected roles, for example, Sentinel Administrators, that have been assigned to the Approvers list for that workspace.
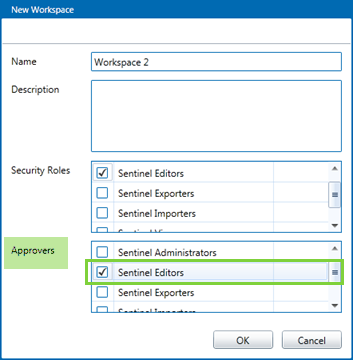
In the example above, Workspace 2 has the Sentinel Editors role selected as approvers. Users that have this role can approve any submitted monitors in this workspace.
When a monitor has been changed and is awaiting approval, approvers can view the monitor and approve or reject the new minor version.