This page lists the videos relating to P2 Explorer, used throughout the Help Center. Please note that most of these videos do not have audio.
Jump to one of the groups below:
Getting Started
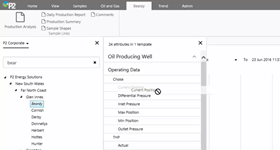
Opening the Point Detail
How to open point details for a tag or attribute value by using Ctrl+Click. [0:24]
Opening the Primary Link
How to open the primary link of an entity by using Ctrl+Click. [0:19]
Searching from the Search Page
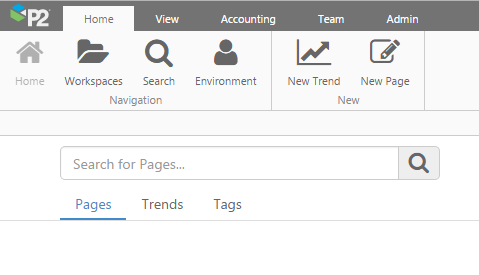
How to search for pages, trends and tags on the Search Page [1:16]
Trends
Trace Table Functionality
See some of the trace table functionality in action. [1:26]
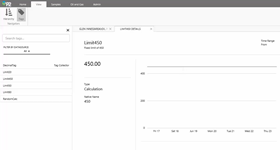
Adding a Tag
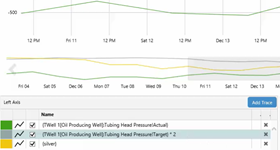
How to type in a tag name, and how to add a calculation to an attribute in the trace table. [0:24]
Using Trend Controls
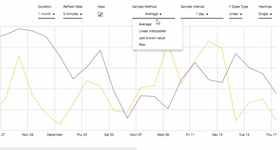
How changing the controls can affect what is displayed in the trend. [0:57]
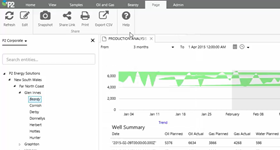
Using the Range Selector
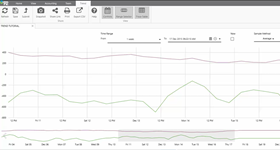
How to use the range selector. Clicking Refresh resets the time range. [0:32]
Using the Components on a Page
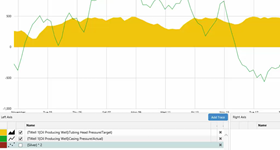
Charts
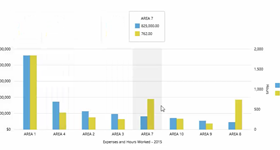
How to select the left or right Y-axis by hovering over the axis. [0:13]
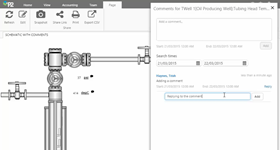
Comments - How Context Works
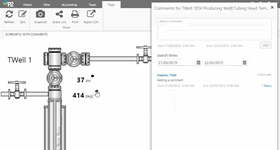
How comments with context work on a page. [0:54]
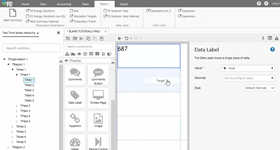
Data Label
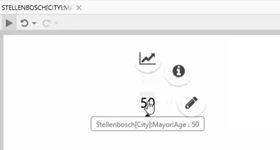
Demonstrates the functionality available on the data label's radial menu. [1:25]
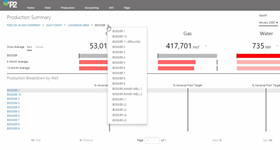
Entity Selector
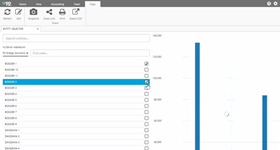
how to use the entity selector to change what is displayed on a chart. In this instance, the user is only allowed to select a maximum of 3 entities. [0:56]
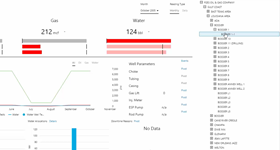
Gauge
The types of indicators available on the gauge and meter process shapes. [0:19]
Hierarchy
How choosing entities from the hierarchy can change what is displayed on a page. [0:34]
Hotspots
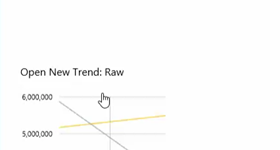
See what happens when you click a hotspot that opens a new trend. This hotspot passes the selected Sample Method to the new trend. [0:15]
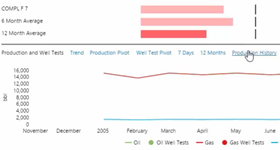
Pie Chart
How the pie chart sections interact when different months and products are selected, and how a selected pie section changes the bar chart. [0:21]
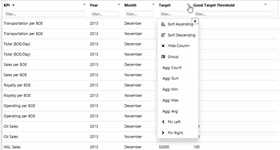
Pivot Table
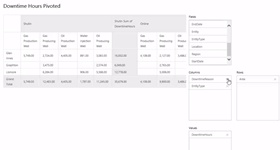
How to re-configure a pivot table. Note how the page refresh reverts the pivot table to its original configuration. [0:43]
Selectors
Examples of how the Explorer page changes with different selections. [0:29]
Text Label
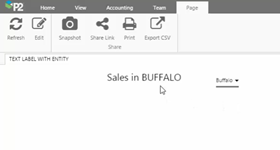
Example of a text label that displays the name of the entity selected from a combo box. [0:14]
Designing Pages in Explorer Studio
Building a Page
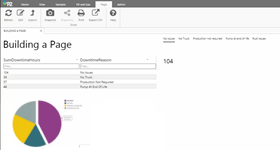
How to build a page in Explorer 4.4 in less than 5 minutes. [4:34]
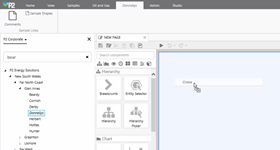
Adding a Component
Discover 3 ways to add a component to a page in Studio. [0:26]
Box Plot
How data shown in the Data Table is presented in the corresponding Box Plot. [0:46]
Chart
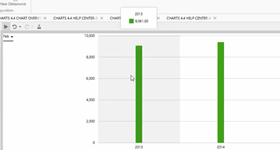
How combo box selections can change a chart's data, in preview mode. Note how the value changes each time a different month is selected. [0:16]
Chart
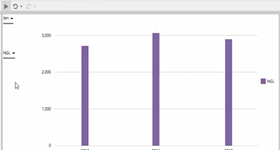
How combo box selections can change a chart's data, in preview mode. Note how the chart colour and values, as well as the legend, change as different products are selected from the combo box. [0:10]
Chart
See how text label contents are updated each time a bar in a chart is clicked, in preview mode. [0:07]
Combo Box
See how data is selected for a combo box. First we use a dataset column, and next we use values. [1:07]
Current Date/Time Toggle
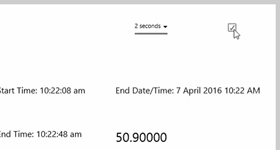
How the tag value and the End Time text label update at the selected refresh rate, when the current date/time toggle is switched on. Note that Start Time does not update. [0:17]
Data Table
How the dataset query is selected for a Data Table component. [0:23]
Date/Time Picker
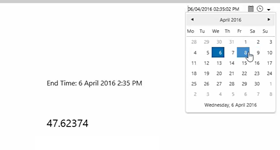
How the text label and tag value change when a user selects different dates and times. [0:14]
Date/Time Range Picker
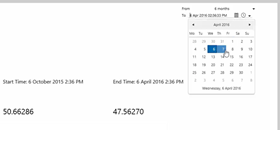
How the text labels and the two tags (the first using start time and the second using end time) change when different dates or ranges are selected. [0:30]
Duration Picker
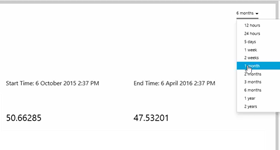
How the text label and the tag for start time change when different durations are selected. [0:17]
Image
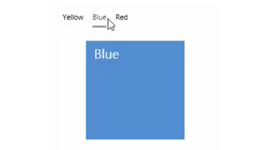
How a text label and image change when different colours are selected from the option links. [0:05]
Level Meter
How the level meter's appearance changes as the value is updated. [0:14]
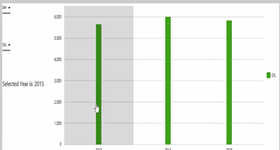
Month Picker
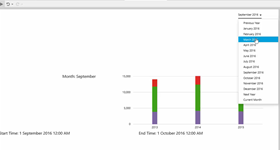
How the chart and the text label update every time a new month is selected, and how the start and end dates change in the text labels. [0:12]
Pressure Meter
How the pressure meter's appearance changes as the value is updated. [0:18]
Temperature Meter
How the temperature meter's appearance changes as the value is updated. [0:17]
Calculations
Calculation Editor - Entities
How to add entities and associated templates, attributes, and attribute values to a calculation. [0:21]
Calculation Editor - Templates
How to add templates and associated attributes and attribute values to a calculation. [0:16]