Every event is caused by the monitor item reaching certain values during a test process, to exceed a defined limit or to reach a predefined state.
These values, along with event comments, are stored in the Sentinel database, and can be viewed from the events grid.
Note: Events are not stored for a monitor if you have selected Disable Event Storage.
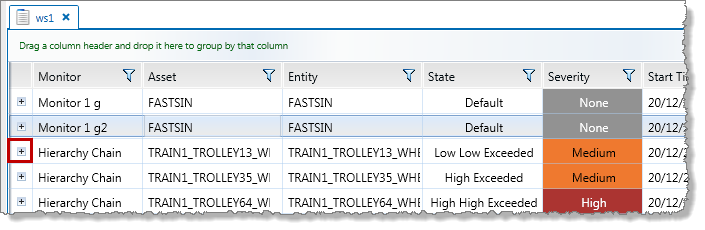
To view the event history and comments:
- Click the expand
 button in the left-most column of the event grid.
The event history is displayed below the row, on a separate panel (the event history panel).
![]() The event grid
The event grid
![]() The event
The event
![]() Event history table
Event history table
![]() Comment box
Comment box
![]() Comment history
Comment history
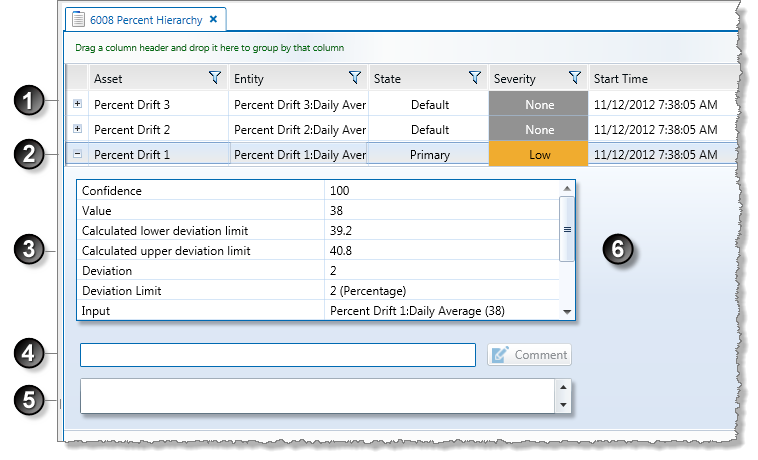
![]() The event history panel
The event history panel
The events history panel is positioned between two rows in the events grid, and consists of the following components:
Events history table
This is a table showing the state of the test entity at the time that the event was reached. Depending on the type of process used, various different fields are described. These may include the following:
- Confidence: The confidence value of the test entity data.
- Value: The value of the test entity data.
- Event Values Relating to Process: These values depend on the process used, and also on the current state for this event. Some examples are:
- High High Limit: The value of high high limit at the time of the event.
- High Limit: The value of high limit at the time of the event.
- Min: The value of min at the time of the event.
- Max: The value of max at the time of the event.
- Integral: The integral at the time of the event.
- First Primary State Time: The start time of the primary state which preceded the current state; or, if this is currently a primary state, the start time of the event.
- First Secondary State Time: The start time of the secondary state which preceded the current state; or, if this is currently a secondary state, the start time of the event.
- Potential Impact: If the state configuration for this state outcome of the monitor test has a Potential Impact, this is stored and displayed.
- Recommended Action: If the state configuration for this state outcome of the monitor test has a Recommended Action, this is stored and displayed.
- State Reason: If the state configuration for this state outcome of the monitor test has a Reason for State, this is stored and displayed.
- Auxiliary Data: Any auxiliary data that has been added to the test is displayed in the format of Token, Auxiliary Data (for example Pressure, 80).
- Original State: The state that the test entity reached to cause the event; this row is only shown if there is a state override in the test's state configuration.
Comment box
The input area for an event comment.
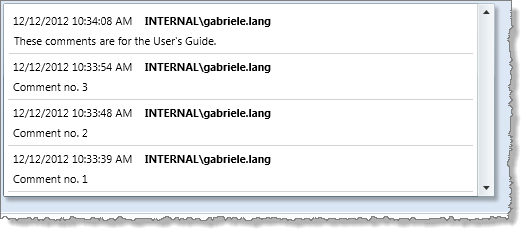
Comment History list
This is a list of all comments that have been added for this event. The most recent comment is first on the list.
Each comment has the following:
- Date and time: The date and time that the comment was added.
- User name: The user name of the person who added the comment.
- Comment: The comment that was added.
Suppressed Events
If an event is suppressed the event history table show the suppression reason, as illustrated in the example screen image below:
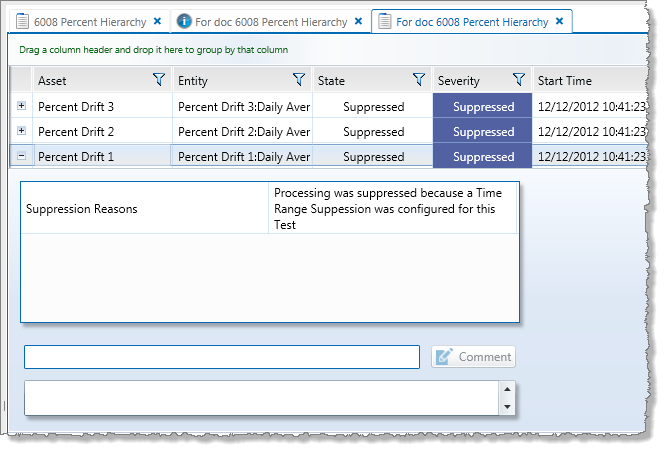
For suppressed events, the event history shows a suppression reason, which may be one of the following:
- Time Suppression: Processing was suppressed because a Time Suppression was configured for this Test.
- Precondition Suppression: Processing was suppressed due to a precondition that was met.
- Missing Data Suppression: Processing was suppressed because no data was returned.
- Standard Precondition Out of Suppression Delay: Processing was suppressed for an additional period after a precondition suppression, based on an Out of Suppression Delay setting.
- Bad Data: Bad Data (Low Confidence data).
- Monitor Chaining: Processing was suppressed because the test configured for Chaining was not in the configured state.
For more information on suppressed data, refer to Sentinel States.
Close Event History
To close the event history and comments tab:
- Click the collapse
 button of the event row.
Export Event History
To export the event history details, follow these steps:
1. Open the history and comment details for an event.
2. Hover the mouse over the event history table.
An Export to Excel button appears on the upper right of the events history table.
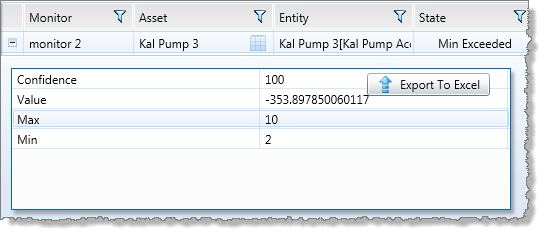
3. Click on Export to Excel to export to a Microsoft Excel spreadsheet.
The event history is exported to a Microsoft Excel spreadsheet.
4. Click the collapse ![]() button of the event row, to close the event history and comments tab.
button of the event row, to close the event history and comments tab.