ON THIS PAGE:
The Alarm process is used for testing continuous data for a monitor item. The sample data is tested against high limits (High and High High), and against low limits (Low and Low Low).
The process can be specified to test against both high and low limits (High, High High, Low and Low Low), just against High limits (High and High High), or just against Low limits (Low and Low Low).
Events
When a new state is reached then a new event is raised. The severity for that state is specified in the state configuration panel of the test.
Values for the Limits
The High High, High, Low, and Low Low limits can be defined as one of the following:
- A fixed numerical value (Fixed Value)
- A variable input value defined as one of:
- Attribute (if the test’s Source is Entity or Hierarchy)
- Source Tag (if the test’s Source is Tag)
- Calculation
- Tag
- Entity Attribute
Optional Process Parameters
This feature allows Sentinel to use process limits of assets with missing attributes. To do this, set the UnconfiguredLimitString parameter in the Sentinel Configuration File.
State Transition Rules
The Alarm process has clearly defined state transition logic paths. Transition from one state to another is equally dependent on the current evaluation of data, and on the current state.
State transitions cause events to be raised, allowing for the escalation of actions via the Sentinel framework. Different actions can be assigned to different state outcomes.
In the Alarm process, any state can transition to any other state.
For example, the default state can transition to the high high state or the high state.
Test Outcomes
The following outcomes are possible when the Alarm process is executed:
| Default State | Data is not in an erroneous state and is within the operating envelope. |
| High Exceeded State | Data is measured against a high limit. If it exceeds the high limit, a High Exceeded State is reached. |
| High High Exceeded State | Data is measured against a high high limit. If it exceeds the high high limit, a High High Exceeded State is reached. |
| Low Exceeded State | Data is measured against a low limit. If it is lower than the low limit, a Low Exceeded State is reached. |
| Low Low Exceeded State | Data is measured against a low low limit. If it is lower than the low low limit, a Low Low Exceeded State is reached. |
| Suppressed State | The monitor has been suppressed. For example, if the precondition has not been met. |
Conditional Logic
The Alarm process provides the following conditional logic.
Note: All of the example graphs in the following sections show tests that have used the Last Known Value sample method.
High Limit Monitoring
The monitor item is monitored for upper limits on entities. The monitor item value is checked against the configured high value, and against the configured high high value.
- If the high value is exceeded, then a high exceeded event occurs and a high exceeded state is reached.
- If the high high value is exceeded, then a high high exceeded event occurs and a high high exceeded state is reached.
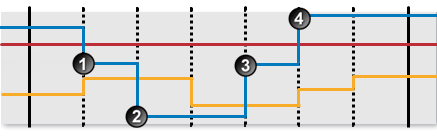
In the following example, High Limit Monitoring is used to detect when a value rises above a variable high limit, and when it rises above a fixed high high limit.
 |
|
The following events are depicted in the graph:
| The data item value is greater than the high limit. A high exceeded state is reached, and a high exceeded event is raised. | |
| The data item value is no longer greater than the high limit. A default state is reached, and a default event is raised. | |
| The data item value is greater than the high limit again. A high exceeded state is reached, and a high exceeded event is raised. | |
| The data item value is greater than the high high limit. A high high exceeded state is reached, and a high high exceeded event is raised. |
Low Limit Monitoring
The monitor item is monitored for lower limits on entities. The monitor item value is checked against the configured low value, and against the configured low low value.
- If the data goes below the low value, then a low exceeded event occurs and a low exceeded state is reached.
- If the data goes below the low low value, then a low low exceeded event occurs and a low low exceeded state is reached.
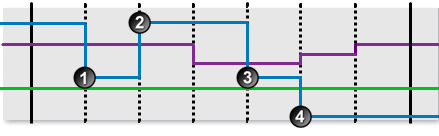 |
The following events are depicted in the graph:
| The data item value is lower than the low limit. A low exceeded state is reached, and a low exceeded event is raised. | ||
| The data item value is no longer lower than the low limit. A default state is reached, and a default event is raised. | ||
| The data item value is lower than the low limit again. A low exceeded state is reached, and a low exceeded event is raised. | ||
| The data item value is lower than the low low limit. A low low exceeded state is reached, and a low low exceeded event is raised. |
High and Low Limit Monitoring
The monitor item is monitored for upper and lower limits on entities. The monitor item value is checked against the defined high value, the high high value, the low value and the low low value.
- If the high value is exceeded, then a high exceeded event occurs and a high exceeded state is reached.
- If the high high value is exceeded, then a high high exceeded event occurs and a high high exceeded state is reached.
- If the data goes below the low value, then a low exceeded event occurs and a low exceeded state is reached.
- If the data goes below the low low value, then a low low exceeded event occurs and a low low exceeded state is reached.
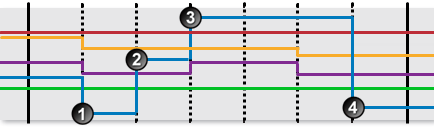 |
The following events are depicted in the graph:
| The data item value is lower than the low low limit. A low low state is reached, and a low low exceeded event is raised. | |
| The data item is between the low limit and the high limit. A default state is reached, and a default event is raised. | |
| The data item value is higher than the high high limit. A high high exceeded state is reached, and a high high exceeded event is raised. | |
| The data item value is lower than the low low limit. A low low state is reached, and a low low exceeded event is raised. |
Adding an Alarm Process
Every test uses a specific type of process, and each process has different limits to define; some of these limits are optional.
The Alarm Process is used for testing continuous values for a monitor item.
In the Test page:
1. Expand the Process ![]() panel.
panel.
The Process panel appears as shown in the following screen image:
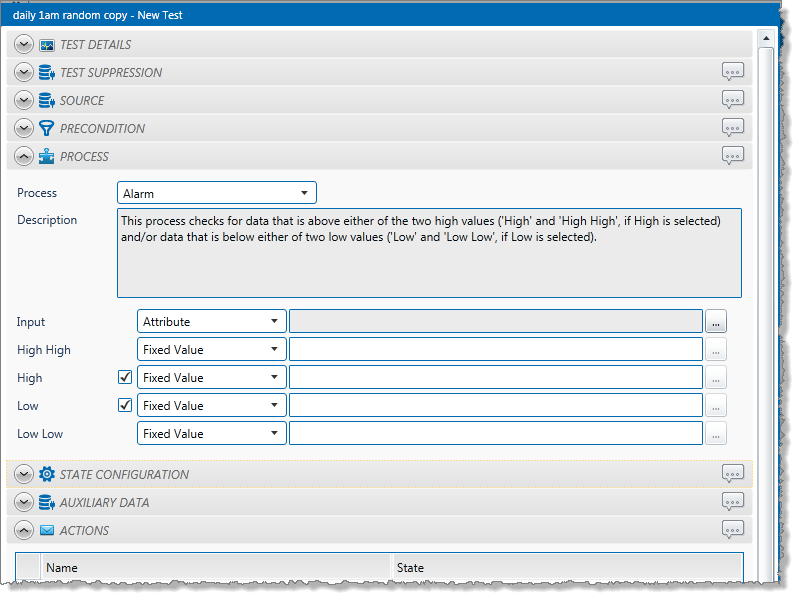
2. In the Process drop-down list, select Alarm.
3. From the Input drop-down list, select an input from the following:
Attribute: This option is only available if the Source Type is Entity or Hierarchy.
Click the ellipsis ![]() button to select an attribute. You are limited to selecting an attribute of the test source monitor items. This attribute of each of the monitor items is a separate process input.
button to select an attribute. You are limited to selecting an attribute of the test source monitor items. This attribute of each of the monitor items is a separate process input.
Source Tag: This option is only available if the Source Type is Tag. If you select this option, then each of the tag monitor items is used as separate process input.
Calculation: Click the ellipsis ![]() button to open the Edit Calculation window.
button to open the Edit Calculation window.
- If the Source Type is Entity or Hierarchy: Type a calculation, prefixed by ‘this’ as the Source Entity token, for example: {this:THP} + 34.
- If the Source Type is Tag: Type a calculation, prefixed by ‘this’ as the Source Tag token, for example: {this} * 2.
Entity Attribute: Click the ellipsis ![]() button to select an entity. From here, select an attribute, or attribute value, for the selected entity.
button to select an entity. From here, select an attribute, or attribute value, for the selected entity.
4. With an Alarm process, you can choose to define high values, low values, or both.
To define High values:
- Select the High check box.
- Specify the High value (see “Available Low and High Values” below).
- Specify the High High value (see “Available Low and High Values” below).
To define Low values:
- Select the Low check box.
- Specify the Low value (see “Available Low and High Values” below).
- Specify the Low Low value (see “Available Low and High Values” below).
Note: At least one pair of test limits, High or Low, must be specified for this process.
5. To add comments to the process panel click the comment ![]() button, at the top right of the panel.
button, at the top right of the panel.
Available Low and High Values
These are the values that you can specify for Low or High:
- Fixed Value: Type in a numerical value.
- Attribute: This option is only available if the test’s Source Type is Entity or Hierarchy. Click the ellipsis
 button to select an attribute of the source entities.
 - Source Tag: This option is only available if the Source Type is Tag.
- Calculation: Click the ellipsis
 button to open the Edit Calculation window.
If the Source Type is Entity or Hierarchy: Type a calculation, prefixed by ‘this’ as the Source Entity token, for example: {this:THP} + 34.
If the Source Type is Tag: Type a calculation, prefixed by ‘this’ as the Source Tag token, for example: {this} * 2.
- Tag: Click the ellipsis
 button to select a tag.
 - Entity Attribute: Click the ellipsis
 button to select an entity. From here, select an attribute, or attribute value for the selected entity.
Configuring States
For the Alarm process, you can configure the following states, each with an optional state override and comments:
- High High Exceeded
- High Exceeded
- Low Exceeded
- Low Low Exceeded
- Suppressed
You cannot change the severity of the Default state; however, you can add a state override and comments.
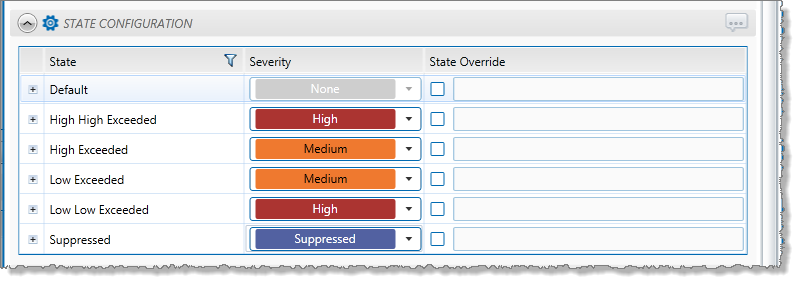
Note: Only configure states where you have set a limit.