ON THIS PAGE:
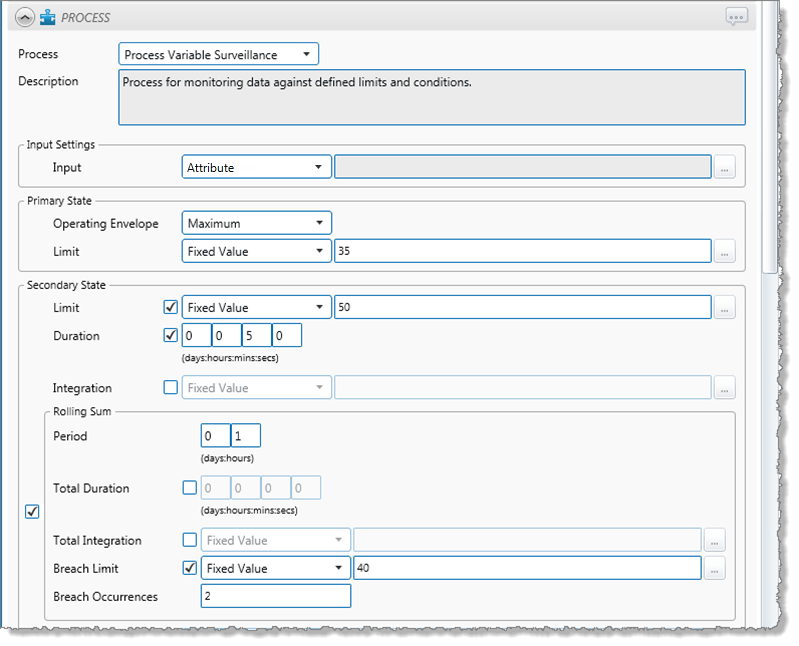
The Process Variable Surveillance process compares process variable data against defined limits and conditions.
Process Variable Surveillance is a complex process capable of concurrently monitoring multiple conditions such as transgression of limits, state duration, and movement between states.
State Transition Rules
The Process Variable Surveillance process has clearly defined state transition logic paths. Transition from one state to another is equally dependent on the current evaluation of data, and on the current state.
State transitions cause events to be raised, allowing for the escalation of actions via the Sentinel framework. Different actions can be assigned to different state outcomes.
The following table outlines the allowable state transitions of the Process Variable Surveillance process.
| This state can transition to | This state | |
| Default | Primary | |
| Primary | Secondary | |
| Tertiary* | ||
| Default | ||
| Secondary | Tertiary | |
| Default | ||
| Tertiary | Default |
*Note: Primary State can only transition to Tertiary State if the Tertiary Limit is breached, and not for any other conditions.
The following diagram outlines the state transition logic of the Process Variable Surveillance process.
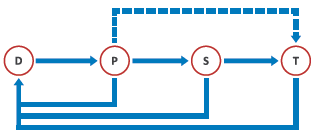 |
D Default P Primary S Secondary T Tertiary |
Test Outcomes
A number of outcomes are possible when the Process Variable Surveillance process is executed:
| Default State | Data is not in an erroneous state and is within the operating envelope. |
| Primary State | Data is measured against a primary limit (fixed or variable). If it exceeds the primary limit (for a Maximum Operating Envelope), or if it is lower than the primary limit (for a Minimum Operating Envelope), a Primary State is reached. |
| Secondary State | A number of possible conditions can cause a secondary state. These are explained in more detail in the Secondary State section. |
| Tertiary State | As with the secondary state, a number of conditions can cause a tertiary state. These are explained in more detail in the Tertiary State section. |
| Suppressed State | The monitor has been suppressed. For example, if the precondition has not been met. |
Output Status Tag
For tertiary and secondary states, you can set an output status tag.
This tag is an entity attribute, or a tag, either as it is, or as part of a calculation. If a secondary output status tag is set, the tag will show a status of one within Explorer when a secondary state is reached, and zero for any other state. Similar behaviour applies to the tertiary output status tag (one for tertiary state, zero for any other state). Within Explorer, the status tag can be observed, for example altering a shape's appearance to indicate whether the monitor's data item is in a secondary / tertiary state or not.
Conditional Logic
The Process Variable Surveillance process provides the following conditional logic.
Note: All of the example graphs in the following sections show tests that have used the Last Known Value sample method.
Rolling Sum Period
A secondary state rolling sum period can be defined for evaluating some of the secondary state conditions; likewise, a tertiary state rolling sum period can be defined for evaluating some of the tertiary state conditions.
The rolling sum period is a defined period (specified in days and hours). At every sample interval, the rolling sum period is that period preceding the sample interval. So, for example, if the secondary state rolling sum period is set at 1 day 2 hours then at 3pm on Friday 3 August, the secondary state rolling sum period is from 1pm on Thursday 2 August (covering the last 1 day and 2 hours). Any evaluations relating to that sample interval's secondary state rolling sum period conditions must fall within that time.
Operating Envelope
Defines whether the maximum or minimum operation envelope is used for all conditions of the process.
- If a minimum operating envelope is used, then excursions occur when values drop below a defined limit.
- If a maximum operating envelope is used, excursions occur when values exceed the defined limits.
Primary State Limit
The primary limit must be set for the process to work.
If the configured primary state limit is breached, a primary event occurs, and a primary state is reached.
The following chart demonstrates a breach of the primary limit, causing a primary event to occur. The operating envelope is set to minimum.
 |
The following events are depicted in the graph:
| Data is below the primary limit. A default state is reached, and a default event is raised. | |
| Data is above the primary limit. A primary state is reached, and a primary event is raised. | |
| Data is below the primary limit. A default state is reached, and a default event is raised. |
Secondary State
There are several ways to reach the secondary state outcome, in the Process Variable Surveillance process:
- Limit
- Duration
- Integration
- Rolling Sum Total Duration
- Rolling Sum Total Integration
- Rolling Sum Total Breach Occurrences
You can choose to set one or more conditions to set the secondary state.
For example, a test may have a variable secondary limit defined, as well as configured variables for determining secondary state rolling sum breach occurrences.
Secondary State Limit
If the configured secondary limit is breached, a secondary event occurs, and a secondary state is reached.
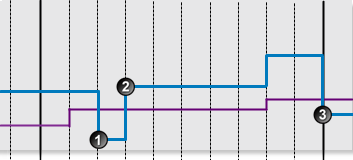
The graph demonstrates a breach of the secondary limit (with an Operating Envelope of Maximum), causing a secondary event to occur.
 |
The following events are depicted in the graph:
| Data is below the primary limit. A default state is reached, and a default event is raised. | |
| Data is above the primary limit. A primary state is reached, and a primary event is raised. | |
| Data is above the secondary limit. A secondary state is reached, and a secondary event is raised. |
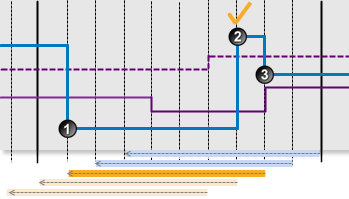
Secondary State Duration
Monitor for a specified continuous duration of the primary state.
If the primary state endures for longer than specified in the secondary state duration limit, a secondary event occurs, and a secondary state is reached.
The graph demonstrates how the duration of the primary limit causes a secondary event to occur:
 |
The following events are depicted in the graph:
| Data is below the primary limit. A default state is reached, and a default event is raised. | |
| Data is above the primary limit. A primary state is reached, and a primary event is raised. | |
| The continuous primary state duration exceeds the secondary state duration limit. A secondary state is reached, and a secondary event is raised. |
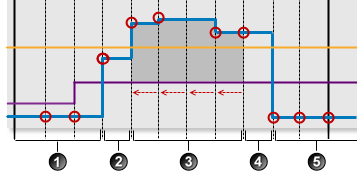
Secondary State Integration
Monitor the data integral (from the primary limit as a base) while data is continuously in the primary state, for transgression against a configured limit.
The integral is calculated as the area under the data line, between a data point and its preceding data point if both data points are above the primary limit, as shown in the diagram below:
 |
An explanation of whether or not the different segments are used in integration.
| Data points in this segment fall below the primary limit, therefore there is no integration. | |
| The first data point in this segment falls below the primary limit, therefore there is no integration. | |
| In this segment, data points and their respective preceding data points are above the primary limit, therefore there is integration. | |
| For this segment, the data point is below the primary limit, even though its preceding data point is above the limit, therefore there is no integration. | |
| All data points in this segment fall below the primary limit, therefore there is no integration. |
If the integral exceeds the configured secondary state integration value, a secondary event occurs, and a secondary state is reached.
The following graph demonstrates the data integral exceeding the secondary state integral limit.
 |
The following events are depicted in the graph:
| Data is below the primary limit. A default state is reached, and a default event is raised. | |
| Data is above the primary limit. A primary state is reached, and a primary event is raised. | |
| The total primary state integral exceeds the secondary state integration limit. A secondary state is reached, and a secondary event is raised. |
Secondary State Rolling Sum Total Duration
Monitor for a specified accumulated duration of all periods of primary state within the preceding specified secondary state rolling sum period.
If the accumulated duration of all primary states within the rolling sum period is longer than the specified secondary state rolling sum total duration, a secondary event occurs, and a secondary state is reached. Note how each sample interval has its own rolling sum period.
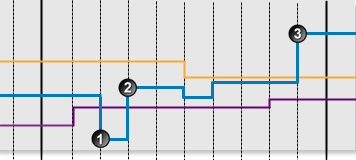
The following chart demonstrates how a secondary state can be reached by secondary state rolling sum duration.
 |
The following events are depicted in the graph:
| Data falls below the primary limit. A default state is reached, and a default event is raised. | |
| The primary limit is exceeded. A primary state is reached, and a primary event is raised. | |
| Data falls below the primary limit. A default state is reached, and a default event is raised. | |
| The primary limit is exceeded. A primary state is reached, and a primary event is raised. | |
| The rolling sum accumulated duration over this sample interval’s preceding rolling sum period exceeds the rolling sum duration limit. A secondary state is reached, and a secondary event is raised. |
Secondary State Rolling Sum Total Integration
Monitor for a specified accumulated integration of all periods of primary state within the preceding specified secondary state rolling sum period.
The integral is calculated as the area under the data curve, where both data points are above the primary limit.
If the integral exceeds the configured secondary state rolling sum total integration value, a secondary event occurs, and a secondary state is reached.
 |
The following events are depicted in the graph:
| Data is below the primary limit. A default state is reached, and a default event is raised. | |
| Data is above the primary limit. A primary state is reached, and a primary event is raised. | |
| Data is below the primary limit. A default state is reached, and a default event is raised. | |
| Data is above the primary limit. A primary state is reached, and a primary event is raised. | |
| In the preceding secondary state rolling sum period, the secondary rolling sum accumulated integral exceeds the secondary state rolling sum total integral limit. A secondary state is reached, and a secondary event is raised. |
Secondary State Rolling Sum Breach Occurrences
Monitor whether a set number of values has traversed the configured breach limit, during the preceding specified secondary state rolling sum period.
The process counts the number of times that the secondary state rolling sum breach limit is breached within a secondary state rolling sum period. If this number is equal to the secondary state rolling sum breach occurrences number, and if the current state is primary, a secondary event occurs, and a secondary state is reached.
 |
The following events are depicted in the graph:
| Data is below the primary limit. A default state is reached, and a default event is raised. | |
| Data is above the primary limit. A primary state is reached, and a primary event is raised. | |
| Data has traversed the breach limit three times during the preceding rolling sum period. In this example, the secondary state breach occurrences is set to 3. Thus, a secondary state is reached, and a secondary event is raised. |
The following scenario demonstrates how the current value of the data item does not need to be over the secondary state breach limit in order for the secondary state to be triggered.
 |
The following events are depicted in the graph:
| Data is below the primary limit. A default State is reached, and a default event is raised. | |
| Data is above the secondary state breach limit. In this example, secondary state breach occurrences is set to 1. Because the current state is default and the data is over the primary limit, a primary state is reached, and a primary event is raised. This follows the State Transition Rules, whereby the state cannot transition from default to secondary. | |
| Data has traversed the breach limit once during the preceding rolling sum period. In this example, secondary state breach occurrences is set to 1. Thus, a secondary state is reached, and a secondary event is raised, even though the data is currently below the secondary state breach limit. The transition from primary state to secondary state is allowable according to the state transition rules. |
Tertiary State
There are several ways to reach the tertiary state outcome, in the Process Variable Surveillance process:
- Limit
- Duration
- Integration
- Rolling Sum Total Duration
- Rolling Sum Total Integration
- Rolling Sum Total Breach Occurrences
Depending on the complexity required, you can set one or more conditions to set the tertiary state. For example, a test may have a variable tertiary limit defined, as well as configured variables for determining tertiary state rolling sum breach occurrences.
Tertiary State Limit
If the configured tertiary limit is breached, a tertiary event occurs, and a tertiary state is reached.
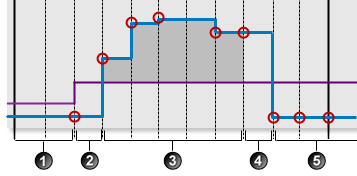
The following chart demonstrates a breach of the tertiary limit (with an Operating Envelope of Maximum), causing a tertiary event to occur:
 |
The following events are depicted in the graph:
| Data is below the primary limit. A default state is reached, and a default event is raised. | |
| Data is above the primary limit. A primary state is reached, and a primary event is raised. | |
| Data is above the tertiary limit. A tertiary state is reached, and a tertiary event is raised. |
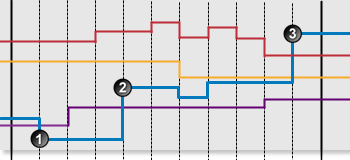
Note: In this example, the state has transitioned from primary to tertiary. This transition is allowed when the tertiary limit has been breached, according to the State Transition Rules.
Tertiary State Duration
Monitor for a specified continuous duration of the secondary state.
If the secondary state endures for longer than specified in the tertiary state duration limit, a tertiary event occurs and a tertiary state is reached.
The following graph demonstrates how the duration of the secondary state causes a tertiary event to occur:
 |
The following events are depicted in the graph:
| Data is below the primary limit. A default state is reached, and a default event is raised. | |
| Data is above the primary limit. A primary state is reached, and a primary event is raised. | |
| Data is above the secondary limit. A secondary state is reached, and a secondary event is raised. | |
| The continuous secondary state duration exceeds the tertiary state duration limit. A tertiary state is reached, and a tertiary event is raised. |
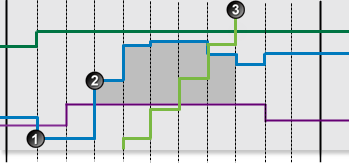
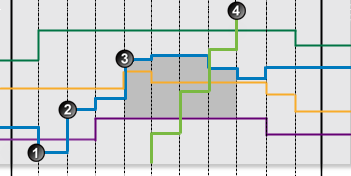
Tertiary State Integration
Monitor the data integral (from the primary limit as a base) while data is continuously in the secondary state, for transgression against a configured limit.
The integral is calculated as the area under the data line, only if both data points are in a secondary state, as shown in the diagram below:
 |
An explanation of whether or not the different segment are used in integration.
| Data points in this segment fall below the secondary limit, therefore there is no integration. | |
| The first data point in this segment falls below the secondary limit, therefore there is no integration. | |
| In this segment, data points and their respective preceding data points are above the secondary limit, therefore there is integration (calculated from the primary limit as a base). | |
| For this segment, the data point is below the primary limit, even though its preceding data point is above the limit, therefore there is no integration. | |
| All data points in this segment fall below the primary limit, therefore there is no integration. |
If the integral exceeds the configured tertiary state integration value, a tertiary event occurs and a tertiary state is reached.
The following graph demonstrates the data integral exceeding the tertiary state integral limit.
 |
The following events are depicted in the graph:
| Data is below the primary limit. A default state is reached, and a default event is raised. | |
| Data is above the primary limit. A primary state is reached, and a primary event is raised. | |
| Data is above the secondary limit. A secondary state is reached, and a secondary event is raised. | |
| The total secondary state integral exceeds the secondary state integration limit. A tertiary state is reached, and a tertiary event is raised. |
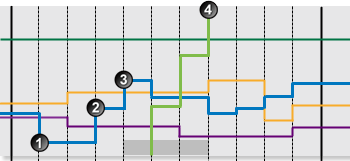
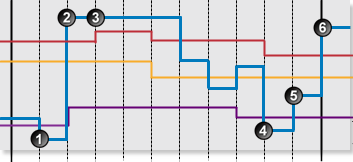
Tertiary State Rolling Sum Total Duration
Monitor for a specified accumulated duration of all periods of secondary state within the preceding specified tertiary state rolling sum period.
If the accumulated duration of all secondary states within the rolling sum period is longer than specified in the tertiary state rolling sum total duration, a tertiary event occurs and a tertiary state is reached. Note how each sample interval has its own rolling sum period.
The following graph demonstrates how a tertiary state can be reached by tertiary state rolling sum duration.
 |
The following events are depicted in the graph:
| Data is below the primary limit. A default state is reached, and a default event is raised. | |
| The primary limit is exceeded. A primary state is reached, and a primary event is raised. | |
| The secondary limit is exceeded. A secondary state is reached, and a secondary event is raised. | |
| Data is below the primary limit. A default state is reached, and a default event is raised. | |
| The primary limit is exceeded. A primary state is reached, and a primary event is raised. | |
| The secondary limit is exceeded. A secondary state is reached, and a secondary event is raised. | |
| The rolling sum accumulated duration over this sample interval’s preceding rolling sum period exceeds the rolling sum duration limit. A tertiary State is reached, and a tertiary event is raised. |
Tertiary State Rolling Sum Total Integration
Monitor for a specified accumulated integration of all periods of secondary state within the preceding specified secondary state rolling sum period.
The integral is calculated as the area under the data curve, for periods of secondary state.
If the integral exceeds the configured tertiary state rolling sum total integration value, a tertiary event occurs and a tertiary state is reached.
 |
The following events are depicted in the graph:
| Data is above the primary limit. A primary state is reached, and a primary event is raised. | |
| Data is above the secondary limit. A secondary state is reached, and a secondary event is raised. The integral is calculated from this point, until the state changes again. | |
| Data is below the primary limit. A default state is reached, and a default event is raised. | |
| Data is above the primary limit. A primary state is reached, and a primary event is raised. | |
| Data is above the secondary limit. A secondary state is reached, and a secondary event is raised. The integral is calculated from this point, until the state changes again. | |
| In the preceding tertiary state rolling sum period, the tertiary rolling sum accumulated integral exceeds the tertiary state rolling sum total integral limit. A tertiary state is reached, and a tertiary event is raised. |
Tertiary State Rolling Sum Breach Occurrences
Monitor whether a set number of values has traversed the configured breach limit, during the preceding specified tertiary state rolling sum period.
Counts the number of times that the tertiary state rolling sum breach limit is breached within a tertiary state rolling sum period. If this number is equal to the tertiary state rolling sum breach occurrences number, and if the current state is secondary, a tertiary event occurs and a tertiary state is reached.
 |
The following events are depicted in the graph:
| Data is below the primary limit. A default state is reached, and a default event is raised. | |
| Data is above the primary limit. A primary state is reached, and a primary event is raised. | |
| Data is above the secondary limit. A secondary state is reached, and a secondary event is raised. | |
| Data has traversed the breach limit twice during the preceding rolling sum period. In this example, the tertiary state breach occurrences is set to 2. Thus, a tertiary state is reached, and a tertiary event is raised. |
Additional Scenarios
This section describes scenarios that are more complex than the ones previously shown. The Process Variable Surveillance process is capable of assessing multiple conditions, whilst still following the state transition rules.
Multiple Ways to Reach a State
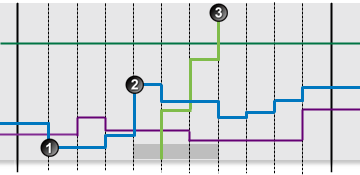
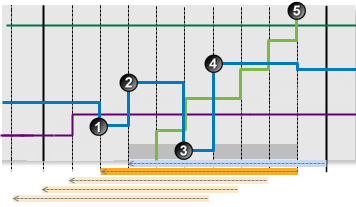
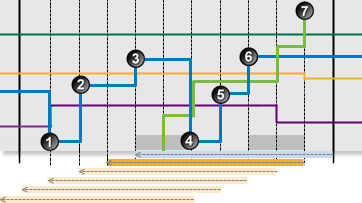
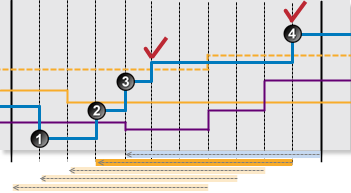
This example demonstrates how a secondary state is reached in 3 different ways:
- Secondary State Limit
- Secondary State Duration
- Secondary State Rolling Sum Breach Occurrences
The conditions are configured as follows:
Primary State
- Operating Envelope: Maximum is selected.
- Primary State Limit: A fixed limit, set at 35.
Secondary State
- Secondary State Limit: A fixed secondary state limit is set at 50.
- Secondary State Duration: A fixed secondary state duration limit is set at 5 minutes.
- Secondary State Rolling Sum Breach Occurrences:
- Rolling Sum Period is set at 1 hour.
- A fixed breach limit is set at 40.
- Breach occurrences is set to 2.
 |
The following events are depicted in the graph:
| Data is below the primary limit. A default state is reached, and a default event is raised. | |
| Data is above the primary limit. A primary state is reached, and a primary event is raised. | |
| The continuous primary state duration exceeds the secondary state duration limit. A secondary state is reached, and a secondary event is raised. | |
| Data is below the primary limit. A default state is reached, and a default event is raised. | |
| Data is above the primary limit. A primary state is reached, and a primary event is raised. | |
| Data has traversed the breach limit twice during the preceding rolling sum period. In this example, the Secondary State Breach Occurrences value is set to 2. Thus, a secondary state is reached, and a secondary event is raised. | |
| Data is below the primary limit. A default state is reached, and a default event is raised. | |
| Data is above the primary limit. A primary state is reached, and a primary event is raised. | |
| Data is above the secondary limit. A secondary state is reached, and a secondary event is raised. |
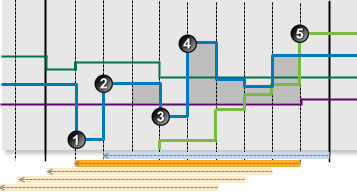
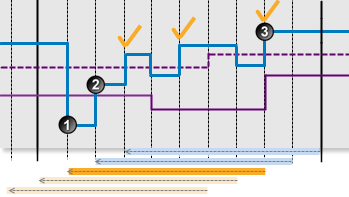
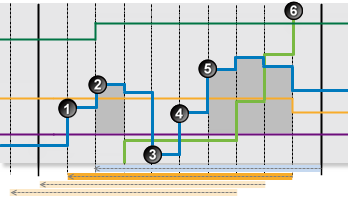
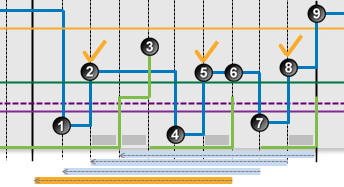
Demonstrating Allowable State Changes
The following graph shows how states cannot change unless the State Transition Rules are followed.

The graph demonstrates a breach of the secondary limit (with an Operating Envelope of Maximum), causing a secondary event to occur:
 |
| The following events are depicted in the graph: | State transition rule affecting state outcome: | |
| Data is below the primary limit. A default state is reached, and a default event is raised. | Any state can move to the default state. | |
| Data is above the tertiary limit. A primary state is reached, and a primary event is raised. | Default to tertiary is not allowed. Default can transition to the primary state. | |
| Data is above the tertiary limit. A tertiary state is reached, and a tertiary event is raised. Note that the data has not changed, but a new state is reached at this interval. | Transition from primary state to tertiary state is allowed where the tertiary limit is in breach (and for no other conditions). | |
| At the next few sample intervals, there are no events, and the tertiary state persists. | A state cannot move to a lower state, unless it moves to a default state. | |
| Data is below the primary limit. A default state is reached, and a default event is raised. | Any state can transition to the default state. | |
| Data is above the primary limit. A primary state is reached, and a primary event is raised. | Transition from default state to primary state is allowed. | |
| Data is above the tertiary limit. A tertiary state is reached, and a tertiary event is raised. | Transition from primary state to tertiary state is allowed where the tertiary limit is in breach (and for no other conditions). |
Adding a Process Variable Surveillance Process
The Process Variable Surveillance Process compares process variable data against defined limits and conditions. If a limit or condition is breached when the process is executed, a new state is reached and an event is raised.
Setting Process Limits
Part of setting up the Process Variable Surveillance process involves selecting limits, such as the primary limit, secondary state limit, tertiary limit, breach limits and so on. Limits can either be fixed values, or they can be variable data taken from entities.
The following limits are available. Select a limit type from the drop-down list, then type in or select a limit.
- Fixed Value: Type in a numerical value.
- Source Tag: This option is only available if the Source Type is Tag.
- Attribute: This option is only available if the test’s Source Type is Entity or Hierarchy.
Click the ellipsis button to select an attribute of the source entities.
 - Calculation: Click the ellipsis
 button to open the Edit Calculation window.
 - If the Source Type is Entity or Hierarchy: Type a calculation, prefixed by ‘this’ as the Source Entity token, for example: {this:THP} + 34.
- If the Source Type is Tag: Type a calculation, prefixed by ‘this’ as the Source Tag token, for example: {this} * 2.
- Tag: Click the ellipsis
 button to select a tag.
 - Entity Attribute: Click the ellipsis
 button to select an entity. From here, select an attribute, or attribute value, for the selected entity.
Adding the Process
In the Sentinel Test page:
1. Expand the Process ![]() panel.
panel.
2. Select Process Variable Surveillance from the drop-down list.
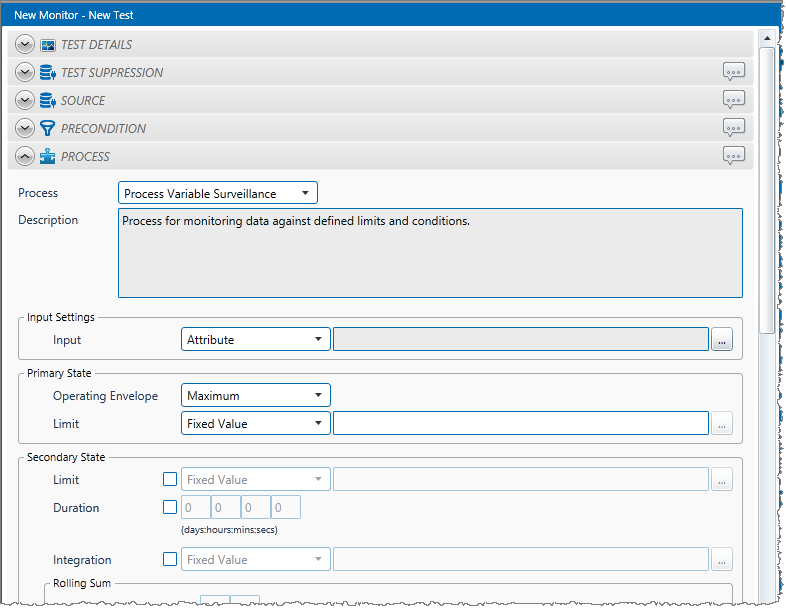
A. Input Settings
From the Input drop-down list, select an input from the following:

- Attribute: This option is only available if the Source Type is Entity or Hierarchy.
Click the ellipsis button to select an attribute. You are limited to selecting an attribute of the test source monitor items. This attribute of each of the monitor items is a separate process input.
 - Source Tag: This option is only available if the Source Type is Tag. If you select this option, then each of the tag monitor items is used as separate process input.
- Calculation: Click the ellipsis
 button to open the Edit Calculation window.
- If the Source Type is Entity or Hierarchy: Type a calculation, prefixed by ‘this’ as the Source Entity token, for example: {this:THP} + 34.
- If the Source Type is Tag: Type a calculation, prefixed by ‘this’ as the Source Tag token, for example: {this} * 2.
- Entity Attribute: Click the ellipsis
 button to select an entity. From here, select an attribute, or attribute value, for the selected entity.
B. Primary State
Define the Primary State limits and conditions.
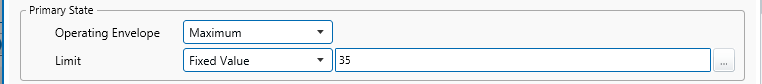
- Select an Operating Envelope (Maximum or Minimum) from the drop-down list.
- Specify a Limit in the drop-down list and the text box.
C. Secondary State
Define the Secondary State limits and conditions, in the Secondary State panel of the process. Secondary State Limits and Conditions that can be set:
- Limit
- Duration
- Integration
- Rolling Sum Period
- Rolling Sum Total Duration
- Rolling Sum Total Integration
- Rolling Sum Breach Occurrences
- Output Status Tag
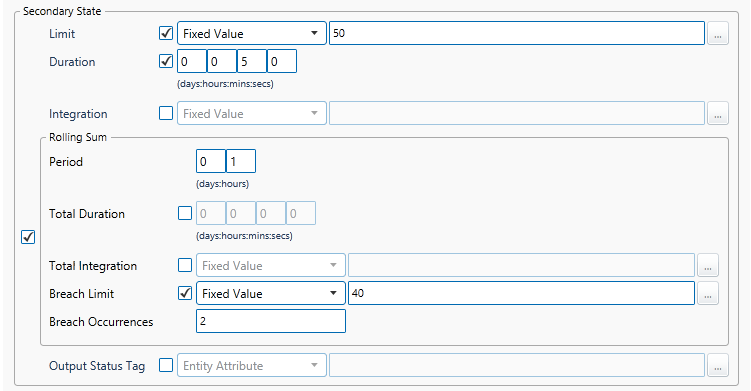
Limit:
- Select the Limit check box.
- Specify the Limit in the drop-down list and the text box (see “Setting Process Limits”, above).
Duration:
- Select the Duration check box.
- Type integer values in the days, hours, mins (minutes), and secs (seconds) Duration boxes to define a duration period. The default value is zero.
Integration:
- Select the Integration check box.
- Specify the Integration limit in the drop-down list and the text box.
Rolling Sum conditions:
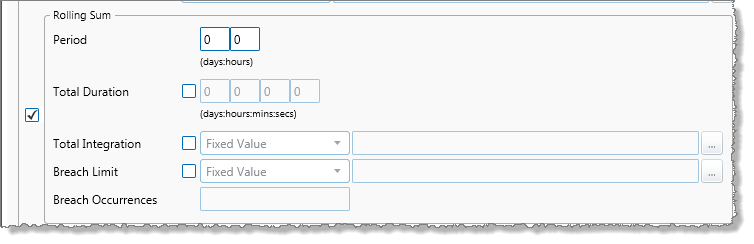
- Select the Rolling Sum check box (to the left of the Rolling Sum panel).
- Type integer values in the days and hours boxes to define the secondary state Rolling Sum Period.
Rolling Sum Total Duration:
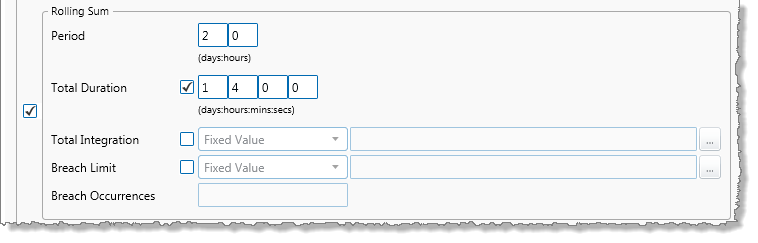
- Select the Total Duration check box.
- Type integer values in the days, hours, mins (minutes), and secs (seconds) in the Total Duration boxes to define the total duration period. The default value is zero.
Rolling Sum Total Integration:
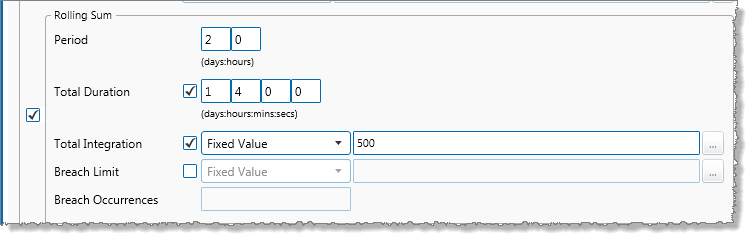
- Select the Total Integration check box.
- Specify the Total Integration limit in the drop-down list and the text box.
Rolling Sum Breach Occurrences:
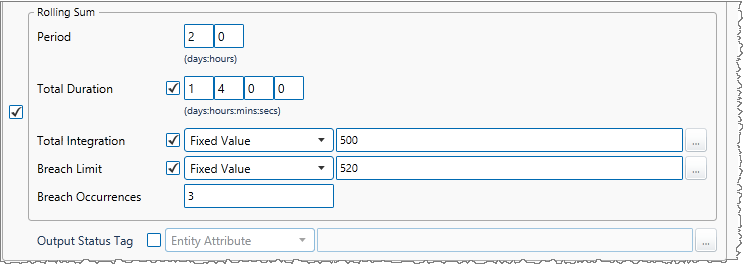
- Select the Breach Limit check box.
- Specify the Breach Limit in the drop-down list and the text box.
- In the Breach Occurrences text box, type the number of breach occurrences.
Output Status Tag:
![]()
- Select the Output Status Tag check box.
- From the drop-down list, select the output from the following:
- Attribute: This option is only available if the test’s Source Type is Entity or Hierarchy.
Click the ellipsis button to select an attribute of the source entities.
 - Tag: Click the ellipsis
 button to select a tag.
 - Entity Attribute: Click the ellipsis
 button to select an entity. From here, select an attribute, or attribute value, for the selected entity.
- Attribute: This option is only available if the test’s Source Type is Entity or Hierarchy.
D. Tertiary State
Define the Tertiary State limits and conditions, in the Tertiary State panel of the process. The limits and conditions can be added in the same way as for Secondary state.
Tertiary State Limits and Conditions that can be set:
- Limit
- Duration
- Integration
- Rolling Sum Total Duration
- Rolling Sum Total Integration
- Rolling Sum Breach Occurrences
- Output Status Tag

- To add comments to the process panel click the comment
 button, at the top right of the panel.
Configuring States
For the Process Variable Surveillance process, you can configure the following states, each with an optional state override and comments:
- Primary
- Secondary
- Tertiary
- Suppressed
You cannot change the severity of the Default state; however, you can add a state override and comments.
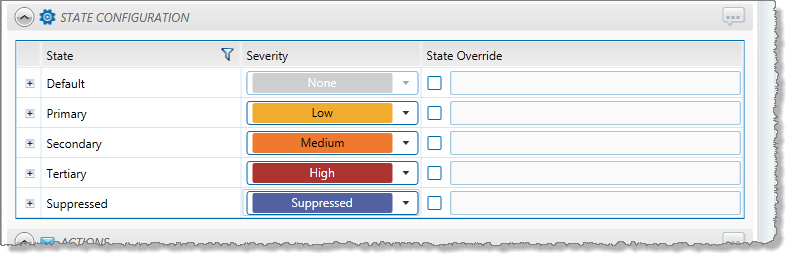
Note: Only configure states where you have set a limit.