The Statistics Report displays detailed information and statistics for the events raised against the entities of the reported asset.
In the Asset Report, you can filter the events using Time Selection, Category, and Monitor Name.
The report asset events are limited by the filtering options. You can further limit the report asset events by adjusting the time slider. The time slider works with the time selection.
- Click the Statistics tab in the Events pane to view the Statistics report.
The important features of the Statistics Report are:
|
|
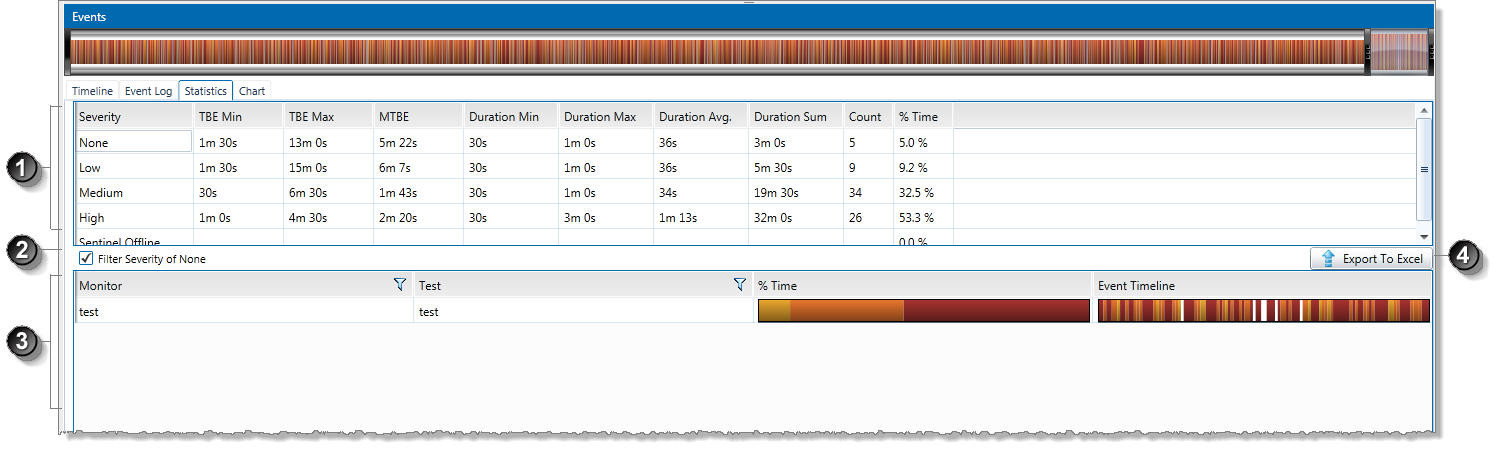
Severity table |
Displays statistics for the severity of events that have occurred for the defined time period, and is based on the filter options. It displays the following statistics:
The table also displays the percentage of time that Sentinel was offline (not running). |
|
|
Filter Severity of None |
Filters events so that those of severity None are not displayed in the event timeline. |
|
|
Time analysis |
Displays a magnified visual of the severity of events for the monitor tests during the specified time period.
|
|
|
Export button |
Export the severity table to an Excel file. |