Every asset in the event page, or event timeline report, has the following reports and tables:
- Timeline
- Event Log
- Statistics
- Chart
To view the reports for any asset:
- Open the events page or an event timeline report.
- In the events grid, locate the asset whose reports you want to view.
- Hover the mouse over the asset.
- Click the View Asset Report
 icon that appears.
A new page opens in the main panel. The page title consists of the asset icon, the asset name and the primary template name.
The important features of the Asset page are numbered in the screenshot below:
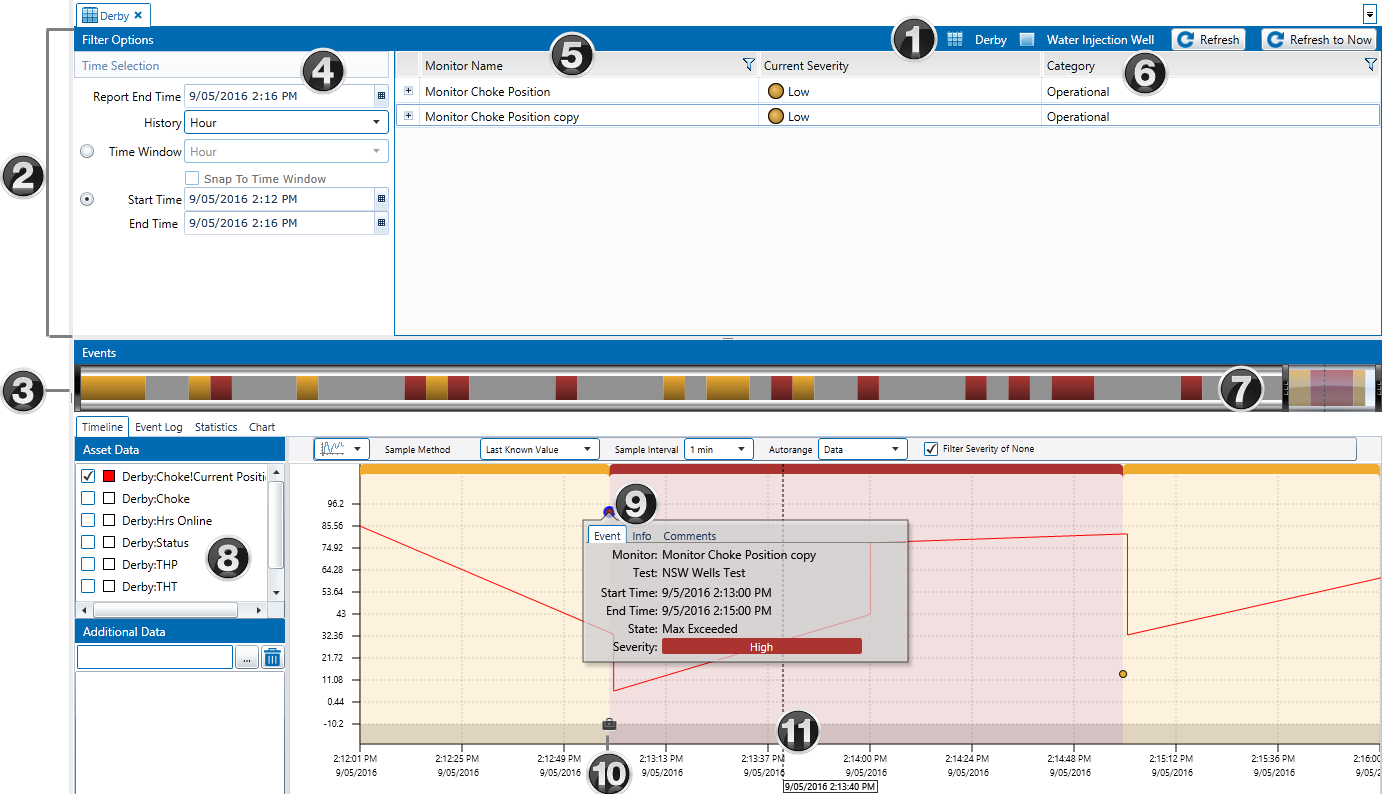
| Asset Report header | The Asset report header frames the page, and contains the asset name, as well as the primary template name. There is a refresh button on the far right. Click Refresh |
|
| Filter Options pane | The Filter Options section allows you to refine what is displayed in the Events pane. It includes the Time Selection, Category, and Monitor Name overview (see below for details). | |
| Events | A summary representation of the report events, for the History period. Each colour band represents a change in the maximum severity of all events (within the filtered group) over that portion of time. | |
| Time selection | The Time Selection panel allows you to specify the time period on which you want to report. | |
| Monitor Name | The Monitor Name lists the monitors that have the asset as a monitor item. You can filter the monitors to limit them in the report. | |
| Category | The Category panel displays the categories to which the monitors belong. You can filter the categories to limit the number displayed. Categories are defined in the monitor details panel of a monitor. | |
| Time slider | Allows you to change the start time and end time for the events to be displayed in the report. The slider, which spans the time range specified in the Start Time and End Time in the Time Selection Panel, provides a visual clue for you to detect where the events of most interest occur. Hover the mouse over the time slider to see a hairline. The hairline matches the hairline in the Event Timeline. | |
| Reports Pane | The Events pane contains the details of the event reports, and allows you to choose from four types of reports or logs:
|
|
| Event, Info and Comment screen | The details for the selected event are shown when the report opens. | |
| Case icon | Click the icon to see additional information about the case. | |
| Report Hairline Date/Time Label | The exact date and time on the graph at the point of the hairline. Click and drag the report hairline to zoom in and further refine what is shown on the graph. |