ON THIS PAGE:
The monitor status tab shows information on the current status of the monitor.
The monitor status can include any of the following:
- Started
- Stopped
- Waiting for trigger
- No approved version (The initial version of the monitor needs to be approved before it can be triggered. This only applies to installations that include Change Management.)
- Disabled
- Running
- Re-running
- Deleting Events
The monitor stops for the following reasons:
- Licence errors
- Engine errors
- Service errors
- Warnings
The Sentinel configuration file specifies when the monitor stops due to any of these reasons. For example, a monitor stops after five warnings if this is specified in the configuration file.
Status Message Types
There are four icons indicating the type of status message:
| Status Message Type | Example | |
| Information | Monitor has started. | |
| Warning | Error fetching data for entity. | |
| Engine Error | Error fetching source entities. | |
| Action Error | Error processing a Web Service Action. This could be due to the web service itself, or incorrect details entered in the URL and body section of the action. | |
| Licence Error | The licence for the process 'Alarm' has expired. Tests using this process will not run. |
Where a monitor has an error or warning status, the monitor name is preceded by an error or warning icon. The folder and workspace names are also preceded by an error or warning icon. You can detect an error or warning status from a high level, and then find the monitor with that status, by navigating through the folders on the workspace. It is also helpful to know the Sentinel status.
In this example the error is traced by following the error icon from the workstation to the folder to the monitor:
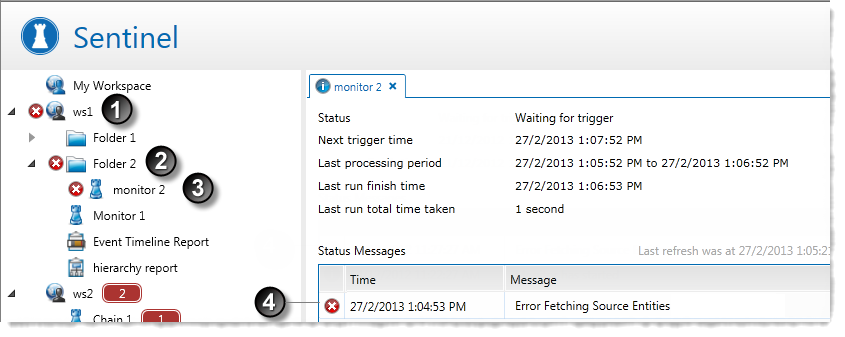
| Workspace with error icon | |
| Folder with error icon | |
| Monitor with error icon | |
| The monitor status message with error icon, on the monitor status page |
Viewing the Status
To view the monitor status:
- In the Workspace panel, locate the monitor you are interested in.
- Right-click on the monitor
 .
. - Click the View Status
 item.
item.
- Right-click on the monitor
- Alternatively, for monitors with an error or warning status, click the error or warning icon.
The Monitor Status page opens in the Main panel.
Monitor Status Page
The page title consists of the relevant status icon and the monitor name.
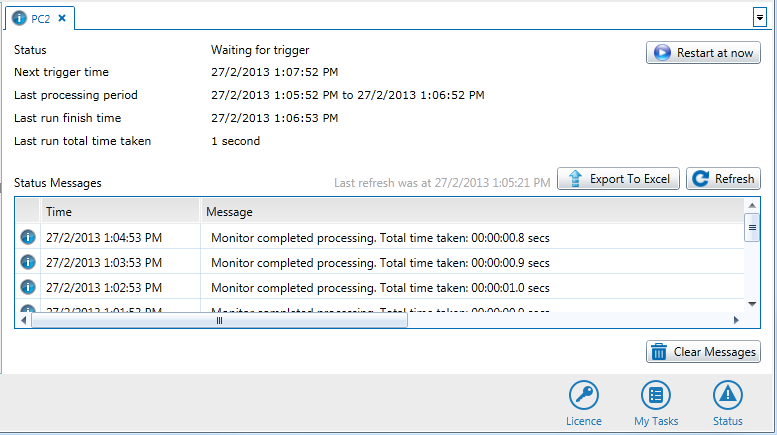
The status page features are:
Status: The current monitor status. Possible values are:
- Started
- Stopped
- Waiting for trigger
- No approved version
- Disabled
- Re-Running
- Deleting events
Next trigger time: The next time that the monitor tests are triggered; there is no next trigger time for disabled monitors. Instead, there is a message showing that the monitor is disabled.
Last processing period: The last period for which the monitor collected sample data and ran its tests.
Last run finish time: The last time that the trigger ran; this is left blank for monitors that have not triggered yet.
Last run total time taken: The time that was taken for all the monitor tests to run; this is rounded to the nearest second. For example a run that takes 00:00:00.8 seconds has a Last run total time taken of ‘Less than 1 second’.
Current processing period: The current period for which the monitor collects sample data and runs its tests. Note: The current processing period only appears when a monitor is currently processing data.
Licence Error: If the process that is used by this monitor has expired, a flashing message appears, containing the name of the expired process. Note: The licence expiry message only appears when the relevant Sentinel process has expired.
Status Messages: A log of all status messages, sorted by most recent status message. Note: The number of status messages stored and displayed is defined in the Sentinel configuration file.
Icon: The icon displays the type of status message; for example, an information ![]() icon.
icon.
Time: The date and time (to the second) that the monitor status was reached.
Message: A message to describe the status, which includes the total time taken for the current run time
Export to Excel: Click Export to Excel to export the status messages to a Microsoft Excel spreadsheet.
Refresh: Click Refresh ![]() to get the latest monitor status.
to get the latest monitor status.
Clear Messages: Click Clear Messages ![]() to clear all messages from the monitor status message log. Note: Only user groups with appropriate permissions can perform this function.
to clear all messages from the monitor status message log. Note: Only user groups with appropriate permissions can perform this function.
Restart: Click Restart ![]() to restart a monitor that has stopped. The monitor will process for the period from Last run finish time through Next trigger time, and then continue with the normal trigger periods. Note: This button is only displayed on the status page for stopped monitors.
to restart a monitor that has stopped. The monitor will process for the period from Last run finish time through Next trigger time, and then continue with the normal trigger periods. Note: This button is only displayed on the status page for stopped monitors.
Restart at now: Click the Restart at now ![]() button to restart a monitor. The monitor will process for the period from now (current time) through Next trigger time, and then continue with the normal trigger periods.
button to restart a monitor. The monitor will process for the period from now (current time) through Next trigger time, and then continue with the normal trigger periods.
Last Refresh: The date and time that the Refresh button was last clicked.
Error Messages on the Monitor Status Tab
For detailed information regarding error messages that appear on the Monitor Status page, see Troubleshooting, or contact Customer Support for assistance.