ON THIS PAGE:
P2 Explorer version 4.7 is a minor release that includes model-based analysis, which extends the capabilities of the Trend to leverage and fit models directly against trend data.
Our new Edge Adaptor provides the infrastructure to allow cloud-hosted implementations of P2 Explorer to get data from on-premise datasources, and also provides an avenue for addressing latency issues in some implementations.
Explorer 4.7 also provides the foundation for full integration of the new breed of Explorer modules, forming the cornerstone of our ‘single event’ philosophy.
Model Based Analysis
The new Analysis panel in the Explorer Trend extends the capabilities of the trend to enable the creation and visualization of complex model directly against any timeseries data in the system.
The first models that have been provided are line fitting methods (linear, polynomial, and logarithmic). These will be expanded to include many other types of models.
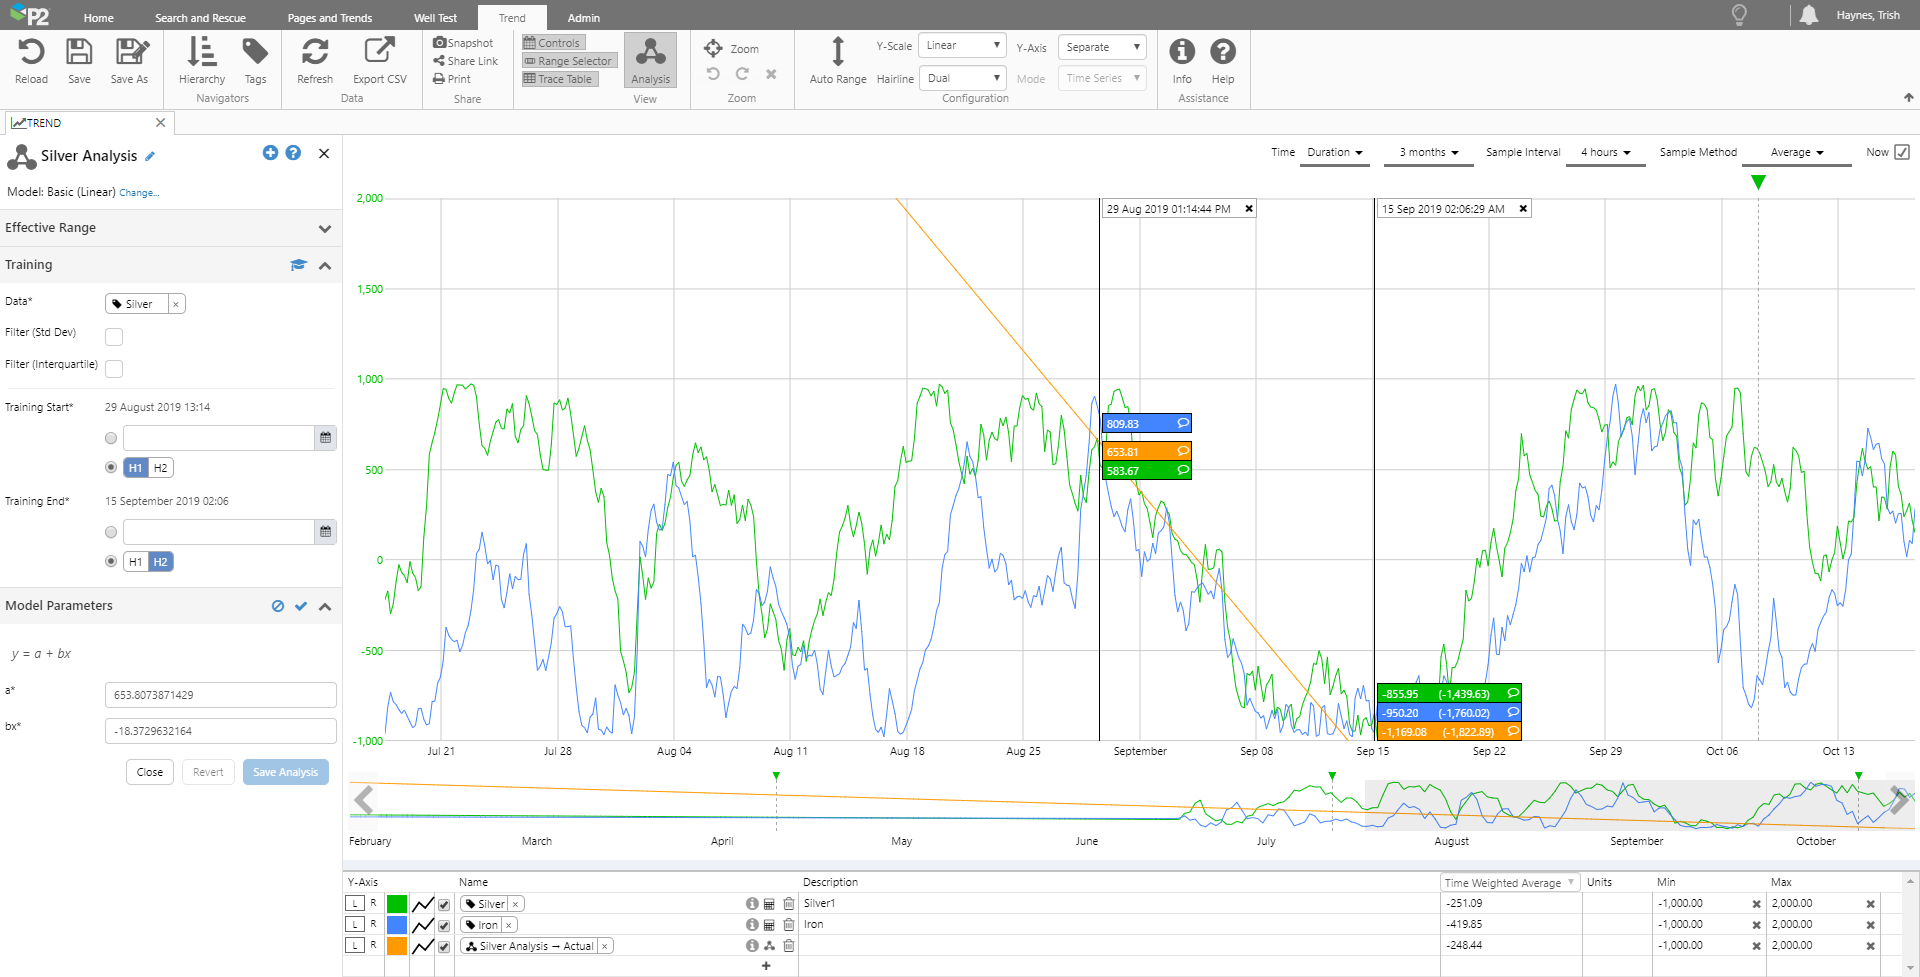
When an analysis has been created and is saved, the output of the model is saved as a data tag.
These tags can be used anywhere in the system where datasource tags are used, such as in calculations, on dashboards, or in Sentinel monitors. As an analysis is saved as a tag, you can also add comments to them.
The Analysis button in the ribbon allows you to toggle the Analysis panel on and off. You can also add a new analysis directly from the Trace Table by clicking the + button.
When adding a new analysis, first choose the model type. There are 3 default model types available: Linear, Logarithmic, and Polynomial.
The edit panel offers a 3-step process to training and executing an analysis:
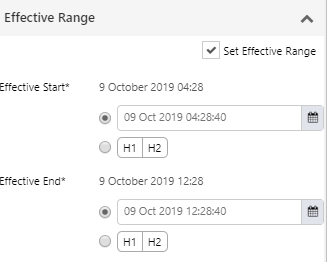
Effective Range
Effective Range allows you to specify the period of time for which this analysis is valid.
You can specify the exact dates manually, or you can use a hairline to provide the dates.
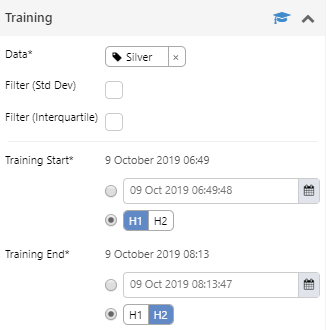
Training
The Training section is where you provide the data and the date range against which you want to train the model. As with Effective Range, you can specify the exact dates manually, or you can use a hairline to provide the dates.
There is also an option to filter the data – you can apply a standard deviation filter or an interquartile filter. This provides an easy way to exclude data outliers and ensure that only clean data is used in training.
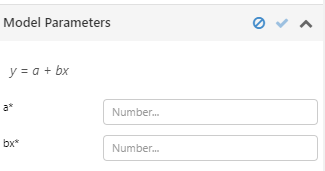
Model Parameters
The model parameters provide an opportunity to modify the polynomial coefficients after training, before executing the model. This provides a way to manipulate the data to determine the best result before executing the analysis.
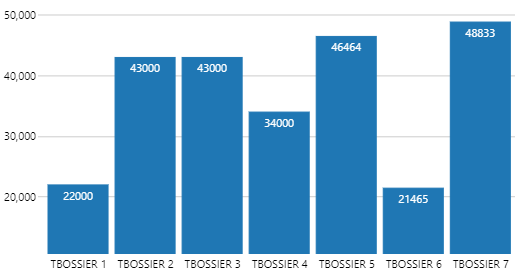
Labels in Bar Graphs
When configuring a bar chart, there is now an option to show the value of each bar. The bar value is displayed in white text at the top of the bar. Note that this is only available on bar charts.
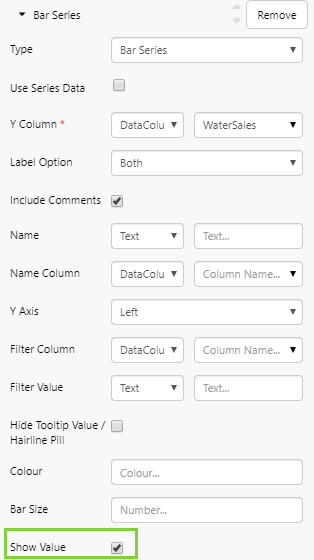
In Explorer Studio, when configuring the chart, this option is available as the ‘Show Value’ option for the series.
Note that if the value is too low, there will be no space for the number and the value will therefore be hidden.
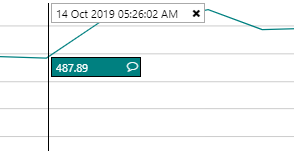
Hide Chart Tooltip Values
When configuring a chart, there is now an option to hide the values in tooltips, or hide the hairline pill. In charts with hairlines, this means that only the timestamp would be visible.
|
With values visible:
|
With values hidden:
|
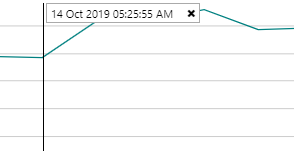
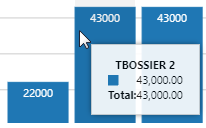
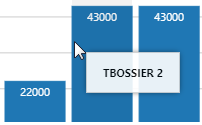
In charts with tooltips, all the Y values would be hidden and only the x-axis label value would be shown.
|
With values visible:
|
With values hidden:
|
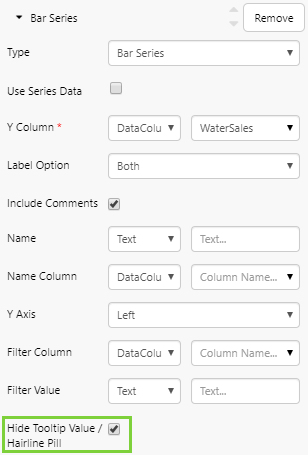
In Explorer Studio, when configuring the chart, this option is available as the ‘Hide Tooltip Value/Hairline Pill’ option for the series.
Edge Adaptor
The Edge Adaptor allows P2 Server Adaptors to be installed remotely from the main P2 Explorer machine.
The primary intended use of this new infrastructure is to allow P2 Explorer, hosted in the cloud, to securely get data from an on-premise datasource. It allows this without the requirement of a VPN, or opening a port into the on-premise network. The components installed into the on-premise environment makes calls to the cloud hosted machines, and then all bi-directional communications are made via this connection.
It is also useful in instances where there is a slow or high latency connection between the source data and the P2 Explorer machine, as the Adaptor can now be installed locally onto the data source machine. This means that all of the processing work can take place locally on the data source, and a smaller subset of processed data can be returned across that connection.
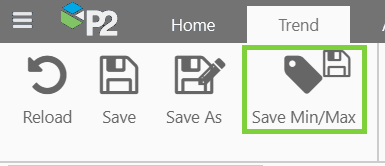
Save Option for Tags from the Trend
In P2 Explorer 4.7, you can save min and max tag and attribute values directly from the trend itself, without having to open P2 Server Management.
A new ‘Save Min Max’ button has been added to the Trend ribbon. This will appear if you have edit privileges on one or more tags in the trend. Clicking this button will save the Min and Max values for all tags and attribute values that are displayed in the trace table, for which you have privileges to save.
Configurable Security Token Expiry
A new ‘SecurityTokenExpiry’ setting has been added to the ServerConfig.xml configuration file, which allows the security token expiry time to be configured to anywhere between 1 hour and 3 days. The value is expressed in minutes. Recycle all application pools after updating this setting.
PI Adaptor High Availability
A new ‘Allow High Availability’ configuration setting has been added to the PI Adaptor, available on the Datasource configuration page in P2 Server Management.
This setting allows the PI Adaptor to connect to other PI servers within a collective of PI servers.

Info Zone
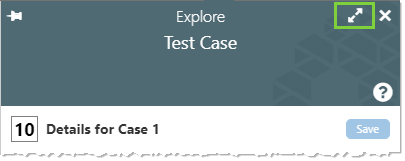
The ‘view more details’ icon in the Explore panel has moved to the right hand side.
In version 4.7:

In version 4.6.x: