ON THIS PAGE:
P2 Explorer version 4.9 is a minor release that redefines the Trending Tool technology and adds frequently requested enhancements to the trend. This release also improves the performance of the Data Table and supports further enhancements to Shift Log.
Explorer 4.9.1 introduces a new look for Case Management as well as other small enhancements. It has a new component that displays the status of Sentinel monitors, and minor updates to Trend functionality. This version also addresses issues found in previous releases.
Case Management Usability Updates
The Case Management app has new look and feel! This is the beginning of further capabilities to be added to Case Management and throughout the rest of Explorer, introducing a more unified user experience.
The main change is the removal of the Case Management ribbon tab. These functions have been moved to a Functional Toolbar, which contains the app functions, and the Filter Bar, which contains options for filtering the cases displayed in the table.
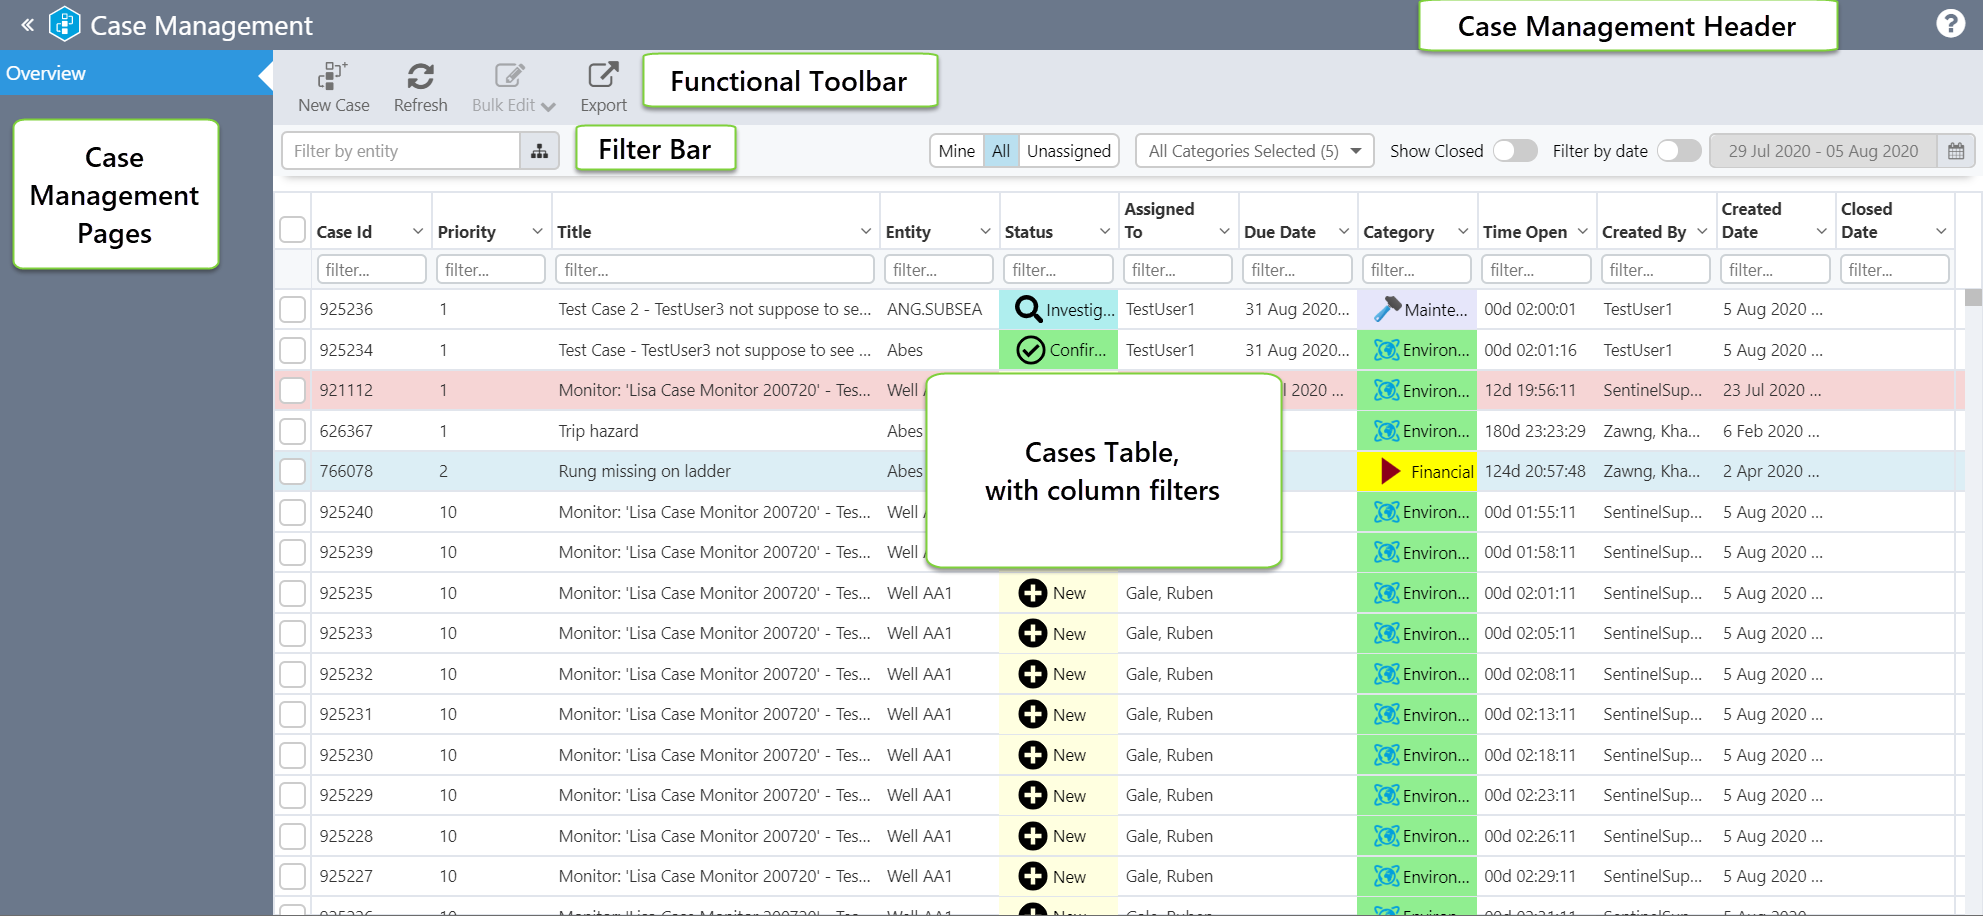
Case Management Header
The Case Management Header will contain buttons for application help, settings, and other app-wide features.
Functional Toolbar
The functional toolbar contains functions available for that page. In the Overview page, this is where you will see buttons to add a new case, refresh the table, bulk editing of cases, and export functions.
Filter Bar
The available filters have changed slightly to allow greater flexibility.
| Filter by entity | In previous versions of Case Management, you would turn on the Hierarchy Navigator and select an entity by which to filter the displayed cases. In this version, you can type directly into the entity filter in the filter bar, and select the entity from an autocompleted list. You can also click the hierarchy button to display the hierarchy on the page, for those who prefer to browse or work their way through a variety of entities. |
| Assigned | The three toggle buttons that allow you to filter assigned user are unchanged, you can still show all cases, or those only assigned to you, or all unassigned cases. |
| Category | The category selector is unchanged. |
| Status | You can choose to show only opened cases, or to also show cases that have been closed or deprecated. |
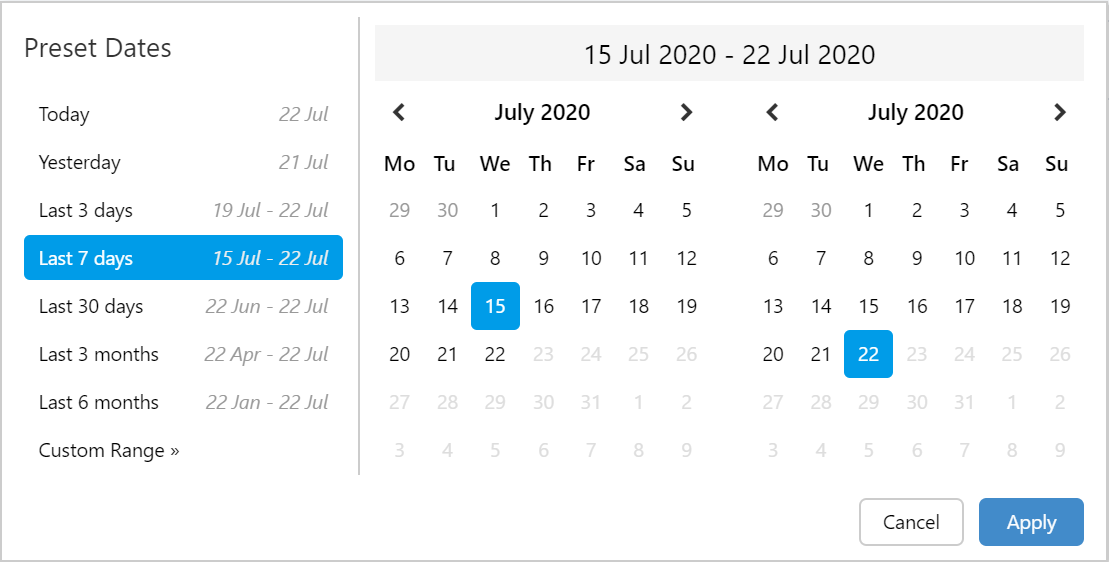
| Date | By default, the cases table only shows cases that are open within the last week. You can further choose to activate the date filter, which will allow you to select from a range of pre-defined dates, or you can choose a custom date range.
|
Cases Table
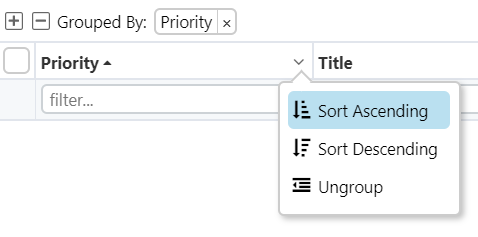
The cases table has been updated with a range of available functions. Within the table, you can now sort, group, and filter on columns.
Case Management Pages
In future versions of Case Management, we will have additional pages available which will be listed here.
Bulk Edit Cases
New to this version of Case Management is further expansion of bulk editing capabilities, where you can select multiple cases and edit them all at once.
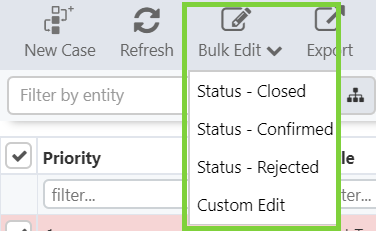
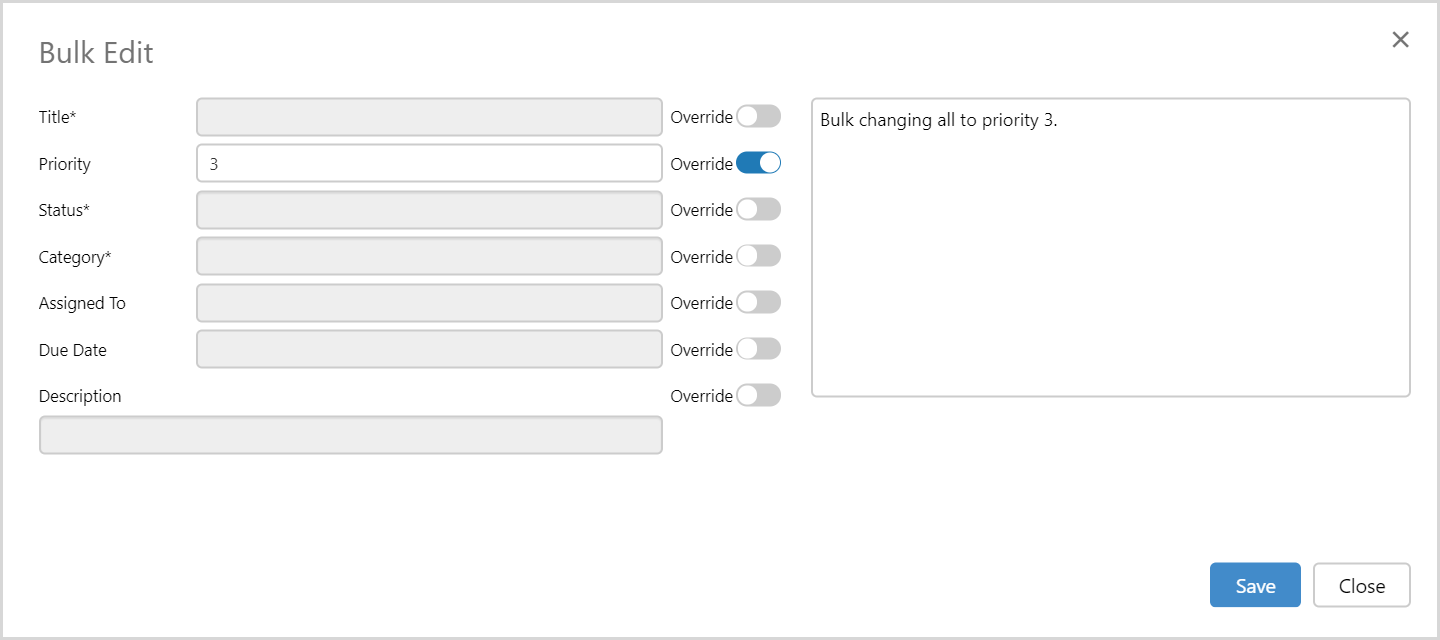
There are 3 shortcuts to change the status, plus a Custom Edit option where you can bulk edit additional fields and optionally add a relevant comment.
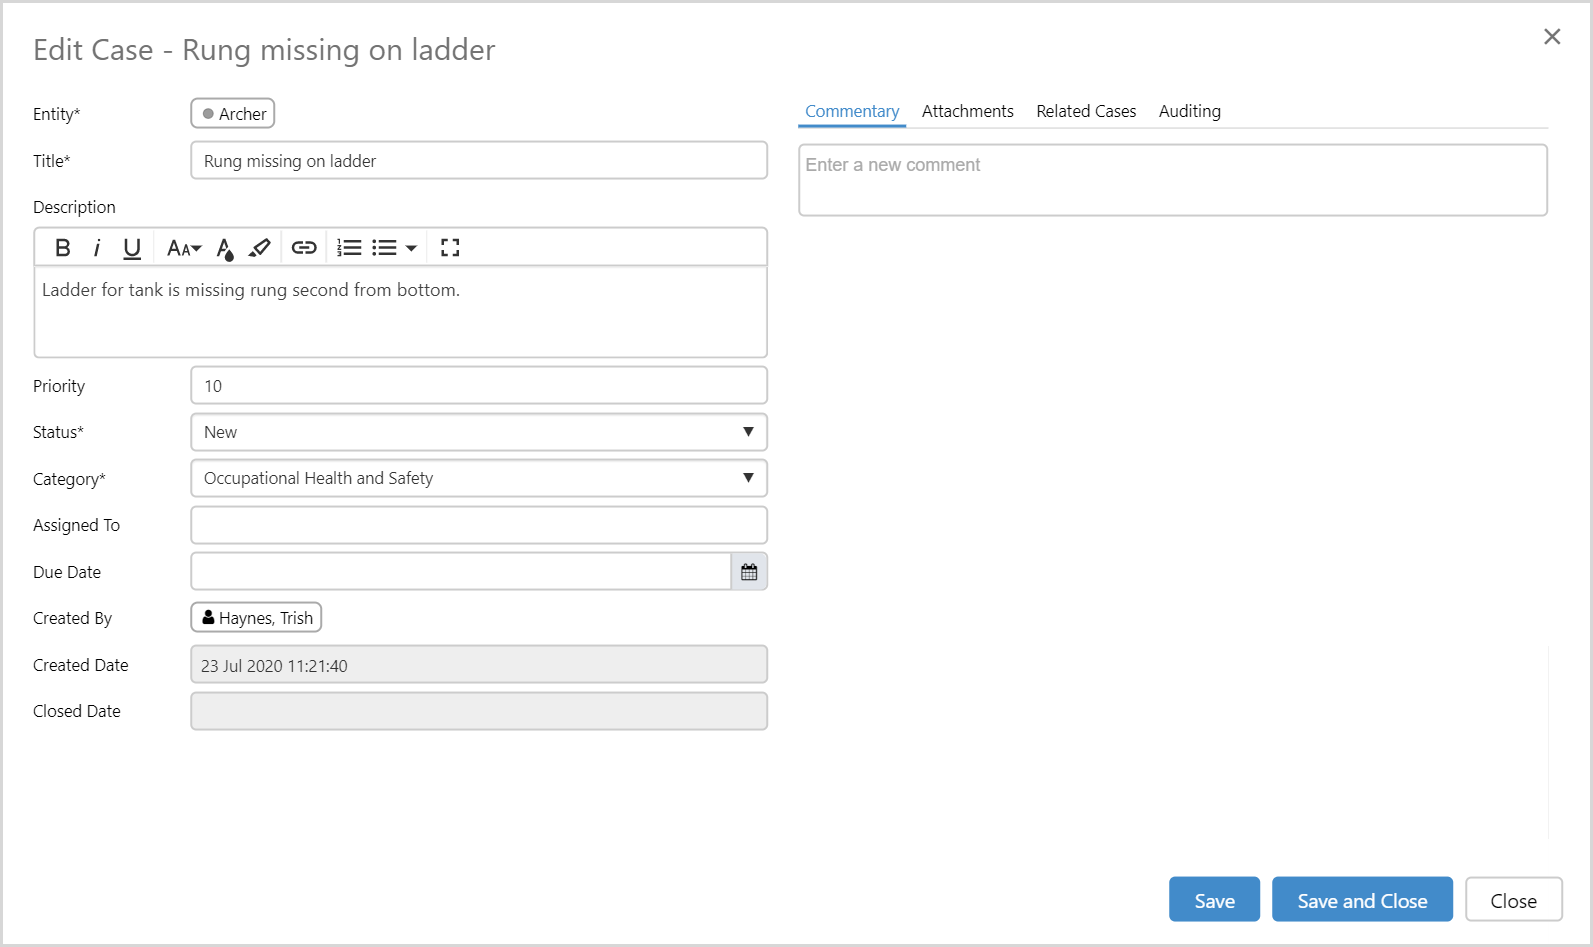
Creating/Editing a Case
When creating a new case or editing an existing case, the case editor now opens inside a dialog box. Auditing and related cases can be accessed from the tabs on the right.
New Component: Monitor Status
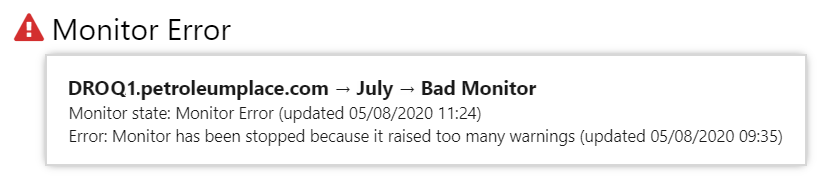
The Monitor Status component allows page designers to display the status of a monitor from P2 Sentinel. The status is displayed as an icon and a label, with further information available as a tooltip.
The status icon will obey Sentinel Security, so only users with the privileges to view Sentinel will be able to see the icon.
The monitor status display can be configured to show just the icon, or the icon and a message, with the message able to be aligned to above, below, left, or right of the icon.
Hovering over the icon displays the monitor name, state, and a more detailed error message.
Here is the full list of states:
| Monitor Error | |
| Monitor Stopped | |
| Monitor Warning | |
| Processing (Deleting Events) | |
|
|
| Waiting for Trigger | |
| Monitor Started | |
| Monitor Disabled | |
| No Approved Version | |
| Sentinel Offline | |
| Monitor Not Found |
In Design Mode:
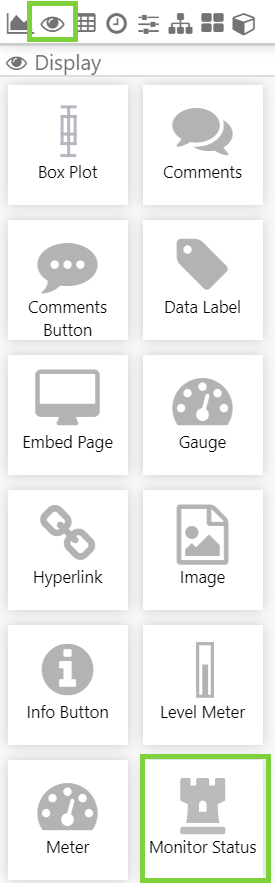
In Explorer Studio, the Monitor Status component has been added to the Display group in the Toolbox.
 |
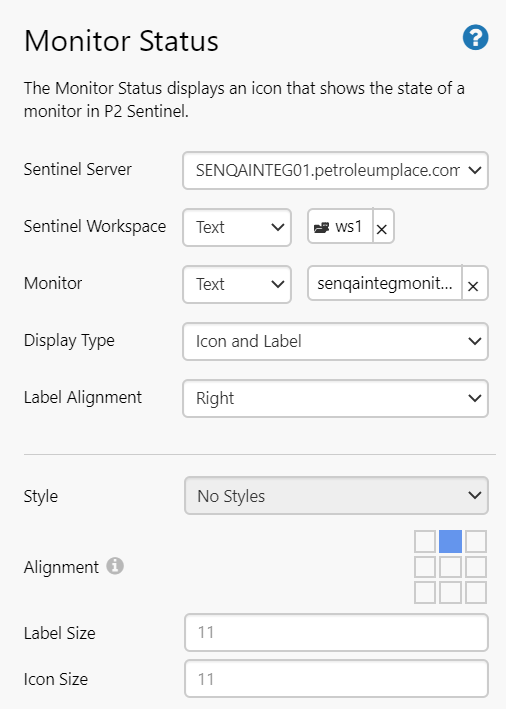 |
In design mode, the page designer specifies which monitor on the Sentinel Server they want to visualise. The Sentinel Server list will display only those Sentinel instances that are visible to Explorer.
Additionally, they can configure how to display the state (as a simple icon or an icon with a label). The label can be re-positioned if needed, and the whole thing can be re-aligned in its bounding box. The size of the icon and label can also be made bigger or smaller, if required.
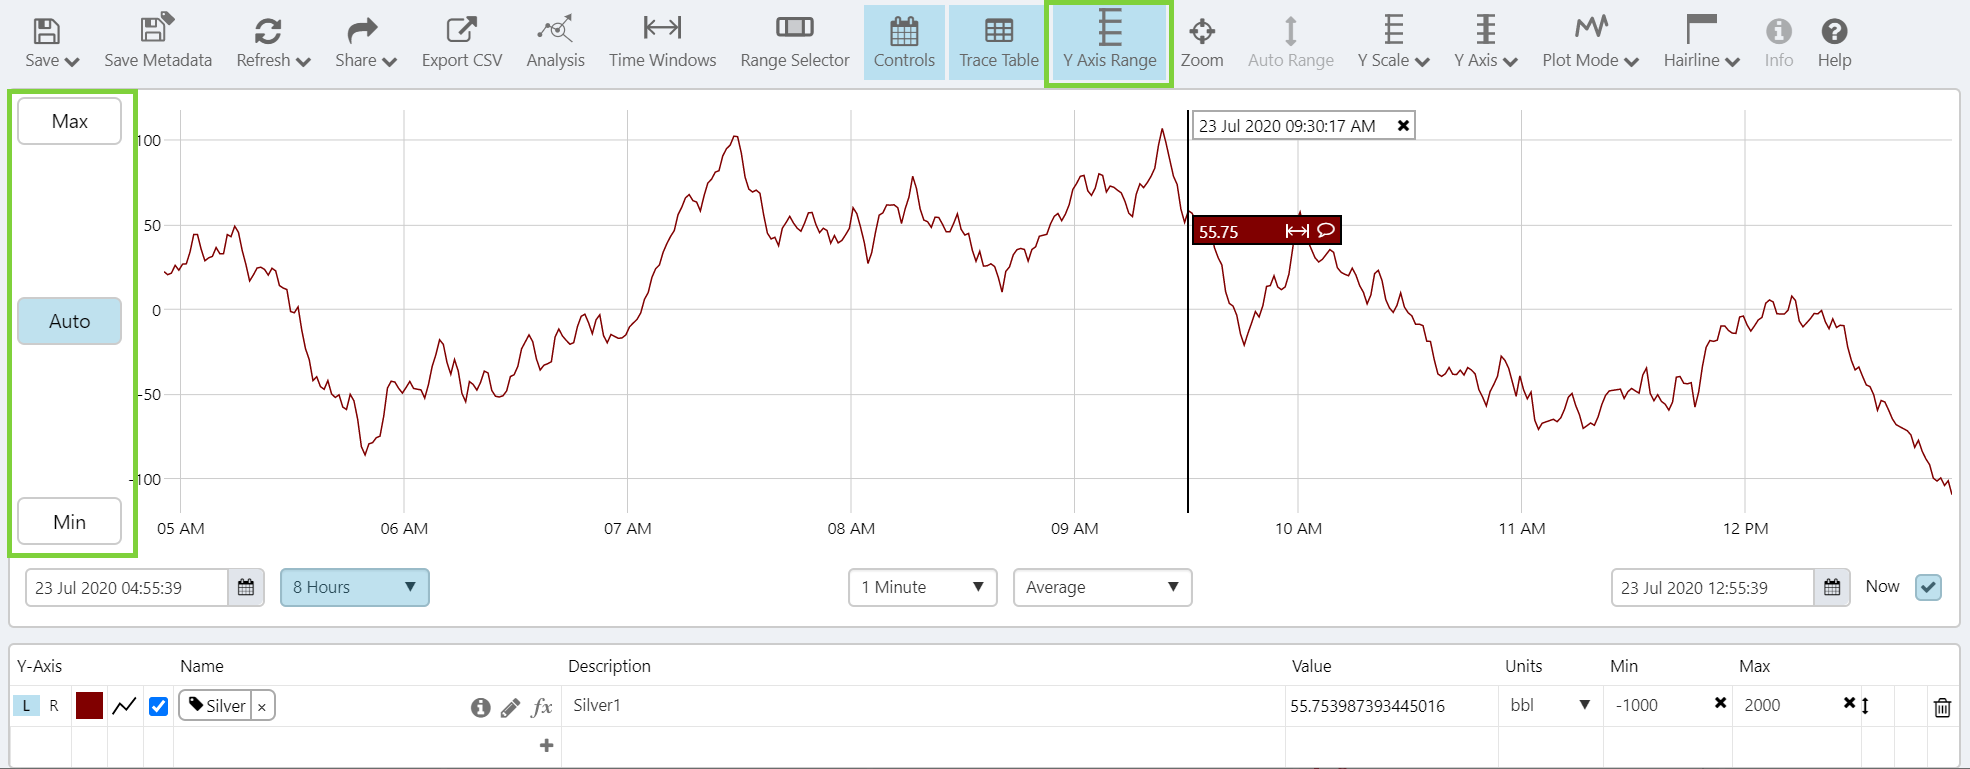
With the y-axis in shared mode, the Y Axis Range button in the toolbar allows you to set a minimum and maximum range on the y-axis. You can also revert this back to an automatic range.
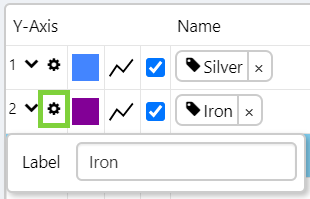
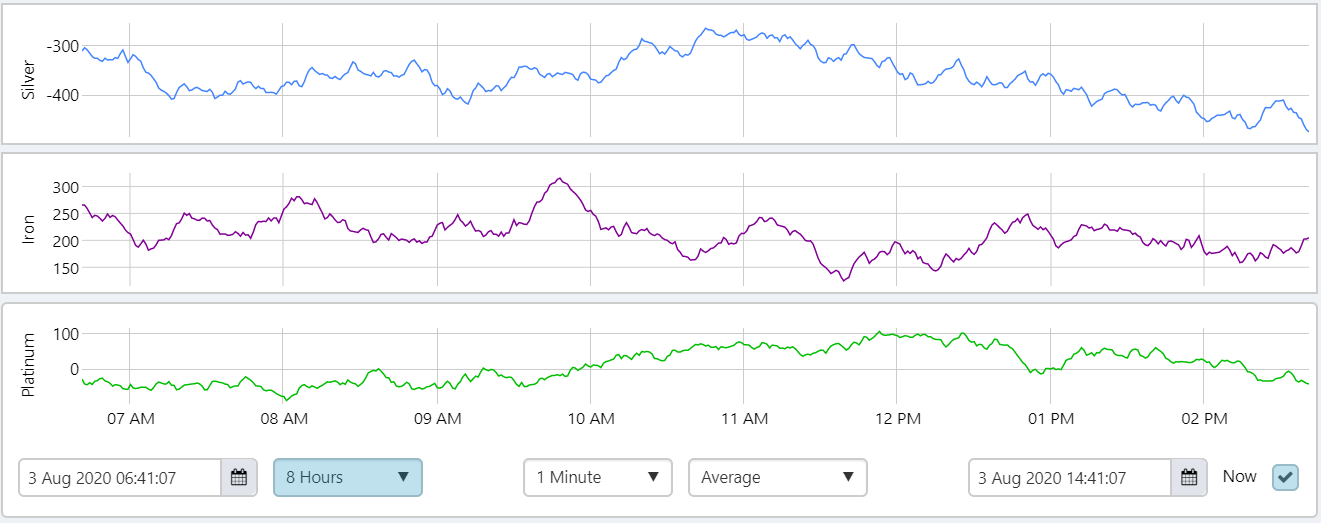
Stacked Trend Left Axis Labels
In the stacked trend mode, you now have the option of adding labels to the left axis, in order to better differentiate between the trends.
To do this, click the cog icon in the trace table, next to the Y-Axis number.
An entry box appears, where you can type the name of the label you wish to add.