ON THIS PAGE:
Overview
IFS OI Explorer Pivot Tables allow you to analyse and summarise data in any way you choose.
Would you like to group and summarise production figures by quarter? Or would you like to see annual production figures by region?
This article shows you how to group and summarise the data you have, in any way you choose.
Pivot Table Layout
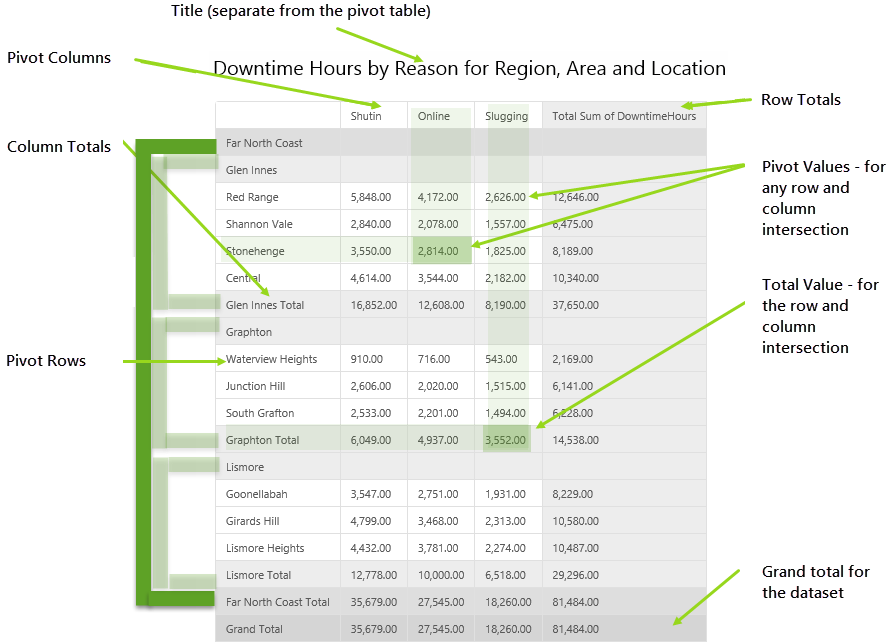
First of all, your Pivot Table will look something like this on your Explorer page.
Features of a Pivot Table
| Title: | The title here (not part of the pivot table) shows which columns, headers and fields have been used. |
| Pivot Columns: | These may vary depending on the pivot table's dataset. In this example, the field selected for this pivot table column is DowntimeReason, and the dataset has three different values for DowntimeReason: 'Shutin', 'Online' and 'Slugging'. |
| Column Totals: | Totals are grey. Column totals also refer to the row. In this example, column totals for the row 'Glen Innes' are: 16,852.00 for 'Shutin', 12,608.00 for 'Online' and 8,190.00 for 'Slugging'. The grand total for these three columns are: 35,6749.00, 27,545.00 and 18,260.00 respectively. |
| Pivot Rows: | These may vary depending on the pivot table's dataset. In this example, the fields selected for this pivot table rows are Region, Area and Location, in that order, and the dataset has several different values for these fields: for example 'Far North Coast' (a Region), 'Glen Innes' (an Area), and 'Shannon Vale' (a Location). |
| Row Totals: | Each row has values for each column. The row total is the sum of the column values for that row. |
| Pivot Values: | The value in each cell of the pivot table is the value of the column and row: so for example, Online (column: downtime reason) downtime hours (value: downtime hours) at Stonehenge (row: location). |
| Total Value: | The total value in each cell of the pivot table is the total value of the column and row: so for example, Online (column: downtime reason) downtime hours (value: downtime hours) at Stonehenge (row: location). |
| Grand Total: | The grand total is the total sum of value (in this case, downtime hours) for the dataset, regardless of which columns and rows have been used. |
Some Examples
Here are some examples of how your data can be represented. It's the same data - just a different Pivot Table configuration.
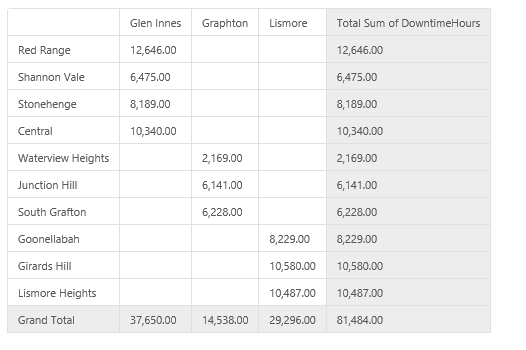
| Downtime Hours per Area, grouped by Location. | |
|
|
|
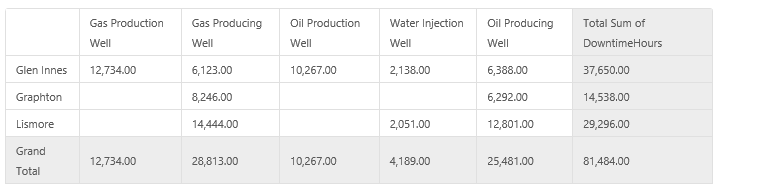
| Downtime Hours per Entity Type, grouped by Area. | |
|
|
|
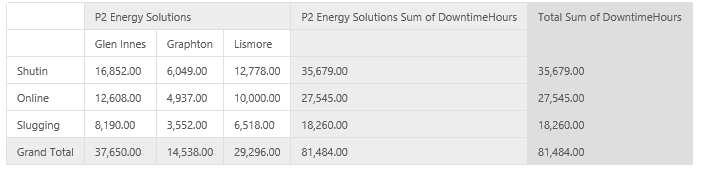
| Downtime Hours per Corporation and Area, grouped by Downtime Reason. | |
|
|
Configuring your Pivot Table
The Pivot Table allows you to manipulate columns, rows and values, so that you can analyse your data by various criteria.
Note that you can revert to the pre-configured layout by refreshing the page. So experiment as much as you like.
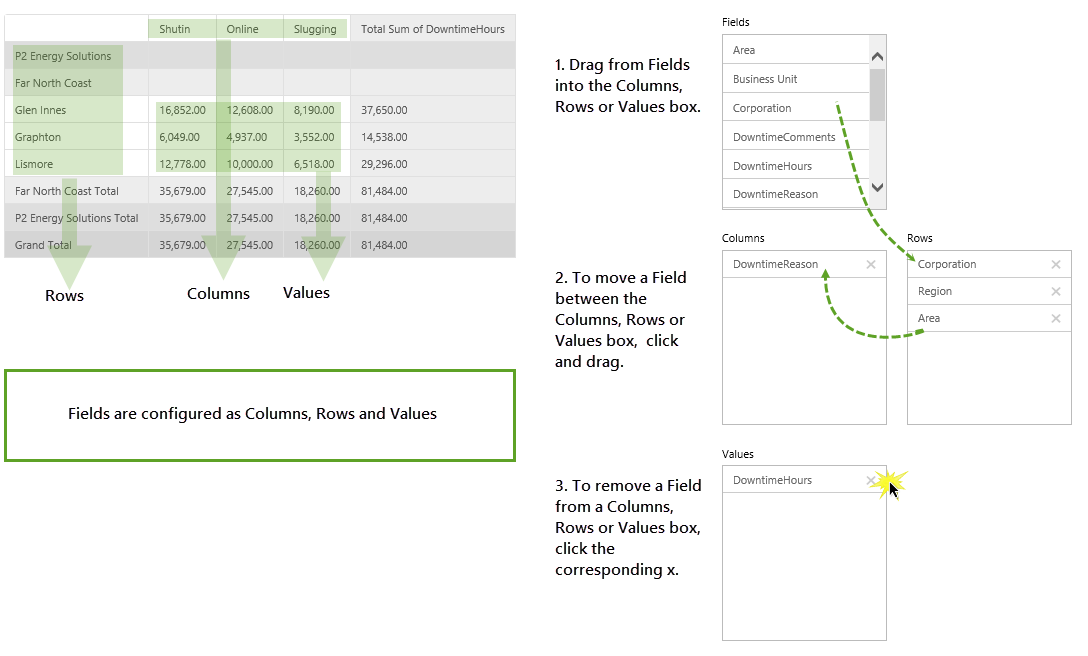
Drag Fields into Rows, Columns or Values Boxes, for Pivot Table Layout
Now look at the same data, but this time grouped by Location and Entity Type.
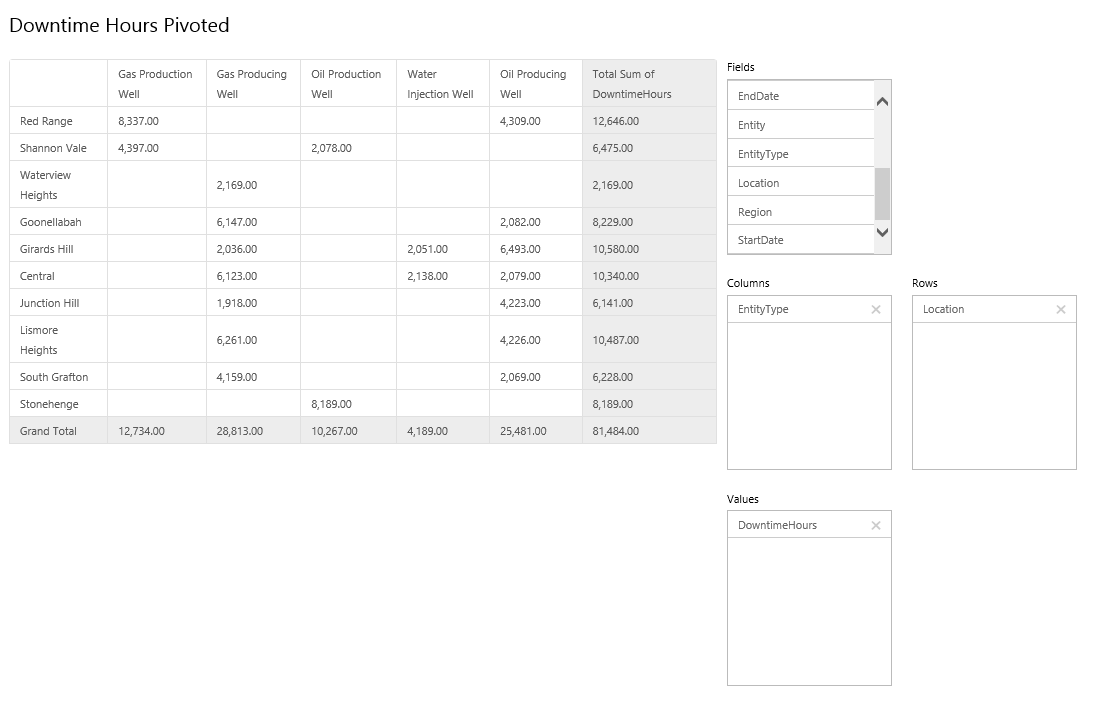
The Same Data, but Presented Differently
Configuring: Detailed Instructions
Note that Pivot Tables are usually pre-configured to show certain data. You can choose to change this, if that suits your purpose.
Adding Data to the Pivot Table
To add a field to the pivot table, drag it from the Fields box and drop it into the Columns, Rows or Values box.
- Add a Row
- Every field that you add as a row has a header and total in the pivot table. Totals are displayed as separate rows (unless there are no sub-rows), in grey. For a clear layout of sub-totals and totals in your pivot table, it's good practice to add your rows in hierarchical order, for example: Region, Area, Location.
- Add a Column
- Every field that you add as a column has a header and a total in the pivot table. Totals are displayed as separate columns (in grey).
- Add a Value
- Typically you would select a numerical field, which can be summed and grouped by your row and column selections.
Removing Data from the Pivot Table
To remove a row, column or value click the X next to the relevant row, column, or value in the Rows, Columns or Values box, respectively.