ON THIS PAGE:
![]()
P2 Server 4.5 is the engine that drives data retrieval from a variety of disparate sources, with built-in relationship models based on a Data Dictionary. P2 Server is how you get your data, transform it into more useful data, and then serve it up to other applications such as P2 Explorer or P2 Sentinel, for further analysis.
Patch Release 4.5.5 provides the ability to connect to P2 ProCount and Carte, improved statistics for tag fetches in the calculation editor, and a new set of hierarchy icons.
P2 ProCount and Carte Integration
P2 Server now provides the ability to connect to P2 ProCount, which allows configuration of production data to be displayed in P2 Server, and real-time production data to be displayed in P2 Explorer.
The connection is managed by a service that retrieves metadata and object information from the P2 Merrick API to facilitate the construction of entities, tags, templates, and attributes.
When Carte is also installed, the service will also construct a hierarchy for each Navigator that is configured as ‘OI Available’.
The setup is different to other adaptors, in that the datasource is automatically created and tags retrieved after running the service.
New Image Icon Set
A number of industry-standard icons have been added in P2 Server, for the Oil & Gas industry. These have been added to the ‘Server Icons’ group and are available for assigning to templates. These icons can be identified from other icons because their names all begin with ‘P2’ e.g. P2 Area.
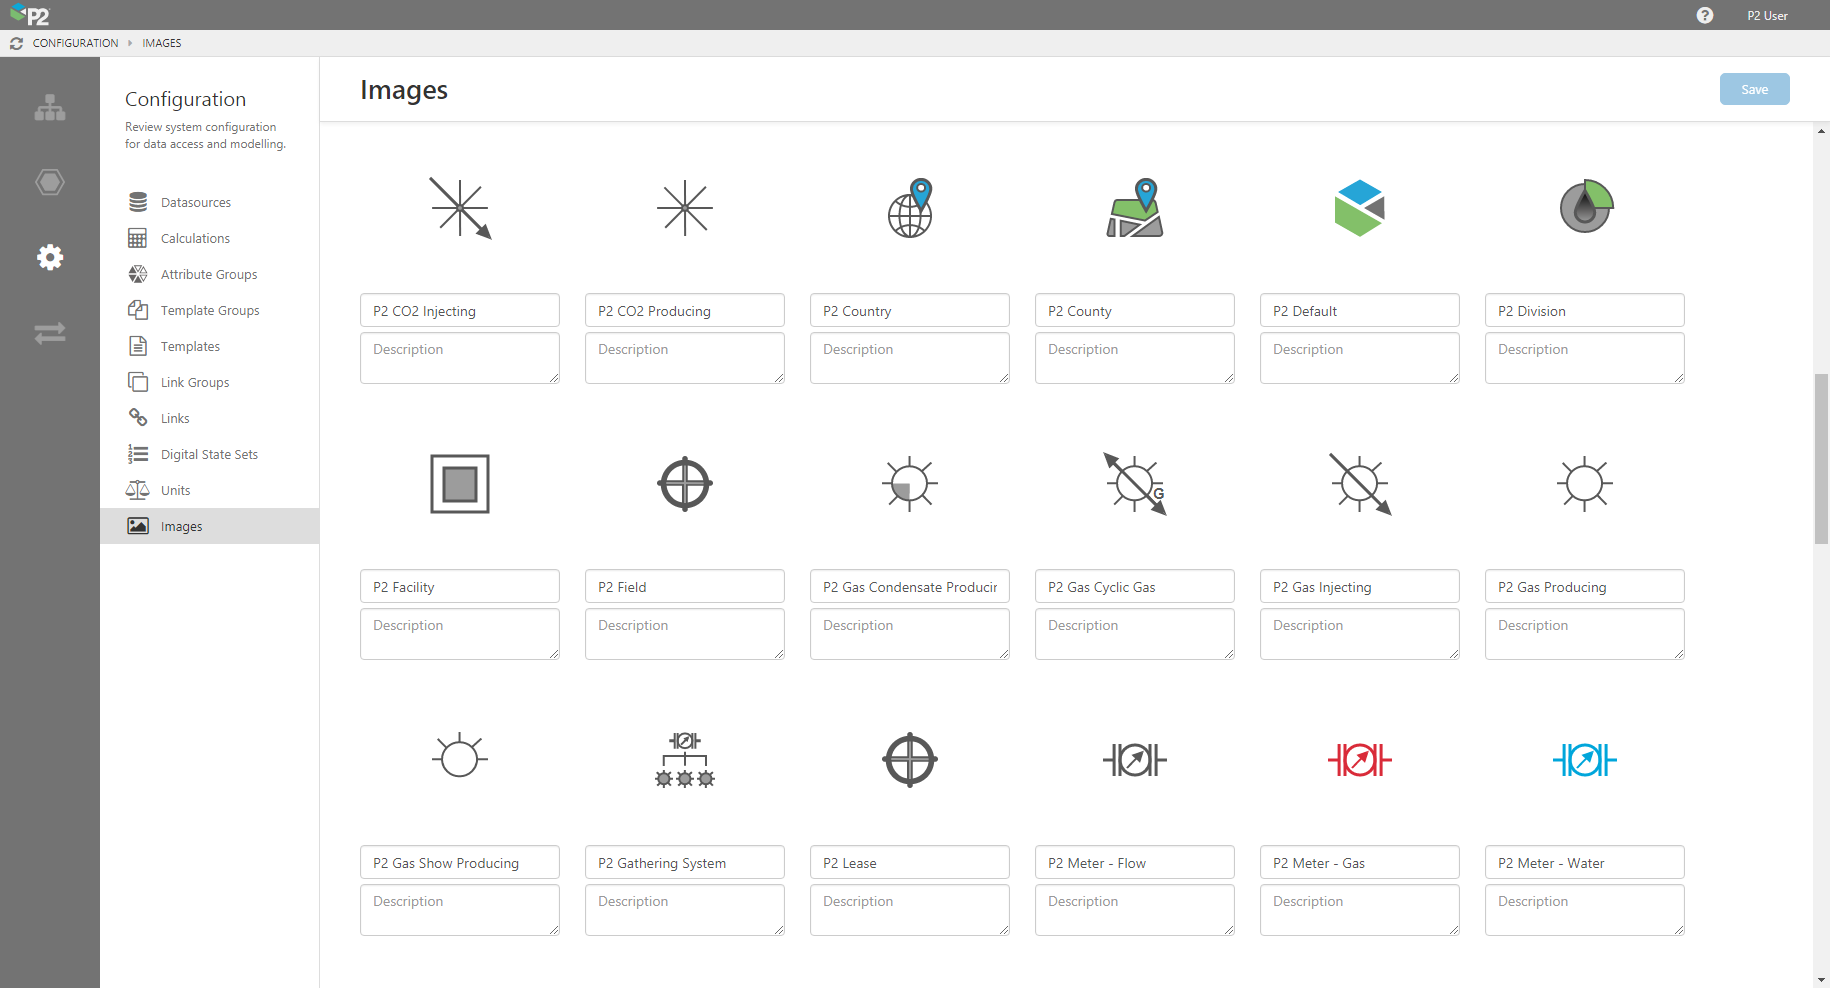
Icons include: P2 Area, P2 Battery, P2 CO2 Injecting, P2 CO2 Producing, P2 Country, P2 County, P2 Default, P2 Division, P2 Facility, P2 Field, P2 Gas Condensate Producing, P2 Gas Cyclic Gas, P2 Gas Injecting, P2 Gas Producing, P2 Gas Show Producing, P2 Gathering System, P2 Lease, P2 Meter – Flow, P2 Meter – Gas, P2 Meter – Water, P2 Non Combustable Gas Injecting, P2 Non Combustable Gas Producing, P2 Oil Cyclic Gas, P2 Oil Cyclic Steam, P2 Oil Gas Producing, P2 Oil Gas Show Producing, P2 Oil Gas ShutIn, P2 Oil Injecting, P2 Oil Producing, P2 Oil Show Producing, P2 Op-Non Op, P2 Plant, P2 Platform, P2 Region, P2 Reservoir, P2 Role – Engineer, P2 Role – Foreman, P2 Role – Office Worker, P2 Route, P2 State, P2 Steam Injecting, P2 Stop, P2 SWD Injector, P2 Tag, P2 Tank, P2 Tank – Battery, P2 Tank – Oil, P2 Tank – Water, P2 Tasks, P2 Unit, P2 Water Alternating Gas, P2 Water Alternating Steam, P2 Water Injecting, P2 Water Producing.
Improved Tag Fetch Statistics
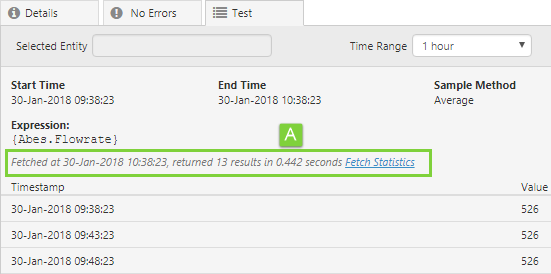
When using the Calculation Editor to test a calculation that involves a tag fetch, the Test tab will display some statistics about the tag fetch – the date and time of the fetch, the number of results, and the time taken to process the calculation.
This release adds two new counters to the Fetch Statistics, which can be accessed by clicking the Fetch Statistics link.
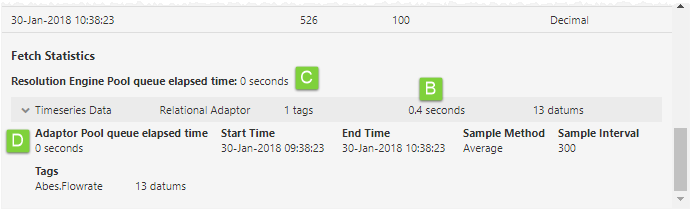
The grey bar presents a summary of the fetch statistics. You can click this to see more statistics, as annotated above. The following notes describe the available statistics (existing and new):
A. This existing statistic is the total execution time of the request in the calculation editor (i.e. time elapsed between sending the request to P2 Server and receiving a response).
B. This existing statistic indicates how long it took for an adaptor to fetch the tag data. It is useful for diagnosing slow datasources, adaptors, or historians.
C. This is a new statistic which indicates how long the tag fetch request was queued before a Resolution Engine became available to process it. The number of Resolution Engines scales with the number of logical processors available on the host machine. A high number here might indicate that improving your hardware could assist in resolving performance issues.
D. This is a new statistic which indicates how long the tag fetch request was queued before an adaptor became available to process it. A high value here can mean that the size of the adaptor pool should be increased (this can be configured on the datasource in P2 Server Management).
Note: You will see high numbers if the Data Broker is under heavy load. Options to mitigate this could include increasing the size of the adaptor pool, allocating more hardware to the source data system, improving the hardware or network, reducing the load on the datasource (e.g. running scheduled tasks at a different time), etc. Each situation is unique.
Previous Releases
For a complete list of P2 Server release notes, see Server Releases.