The events page is named after the workspace, folder, or monitor that it relates to (see above sections). For all events in Sentinel, the page is named All Events.
The events page contains an events grid with a list of all current events for the workspace, folder, or monitor, or for the whole of Sentinel.
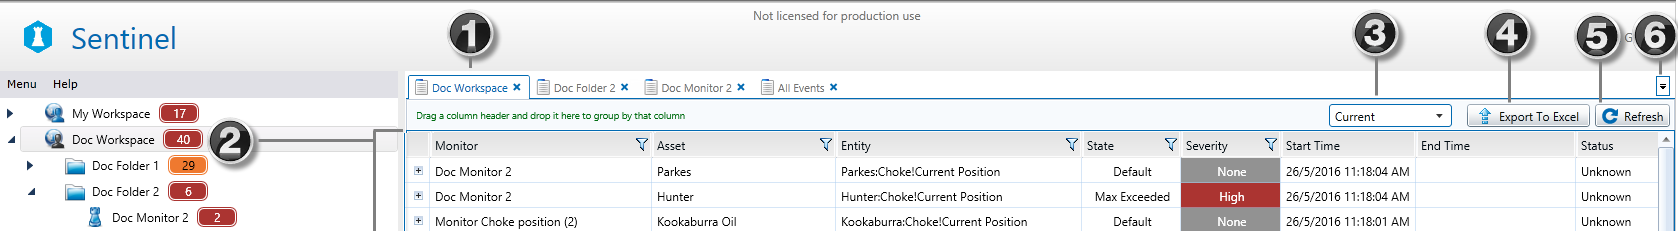
The important features in the events page are:
| Events page title | The workspace, folder or monitor name, or All Events. | |
| Events grid | All of the current events for the workspace, folder, or monitor, or all of Sentinel. | |
| Period selector | Select current events, or also include events that ended within the selected period (for example, events that ended within the last 24 hrs). | |
| Export to Excel | Click to export the grid to a Microsoft® Excel® spreadsheet. | |
| Refresh | Click to refresh the page. The latest events are displayed. | |
| Selecting an Open Tab | Click the downward-pointing arrow, and select an open tab from the drop-down list. |
Note that all current events, regardless of when they began, and including suppression events, are shown in the events grid. Thus, there may be no event notification label for a monitor (if, for example, the current event options is set to show events that started today, and no current events actually started today); however, you can still view current events that started before today in the events grid.
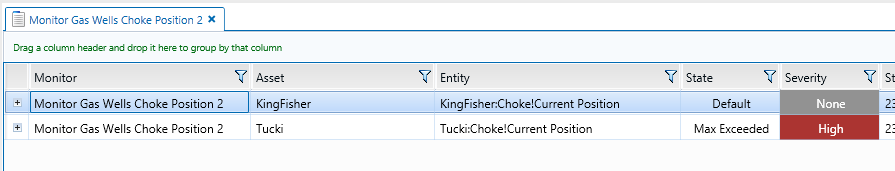
Events Grid
The events grid (when viewed from the events page) displays the current event state of every test item for the selected monitors.
- To close the page, click the close
 icon next to the page name.
The events grid consists of the following columns:
Leftmost column: This column has buttons to expand ![]() or collapse
or collapse ![]() the event details.
the event details.
Monitor: The name of a monitor that has tests with current events. Note: This column is only displayed for Workspace Events and Folder Events.
Asset: The name of an asset that has a current event; you can view the asset reports from here.
Entity: The name of the entity that defined the asset.
State: The state that was reached to raise the current event displayed. Note: Where state override has been applied in the state configuration, the override state is displayed here.
Severity: The configured state severity of the event that was raised.
Start Time: The start time of the event; this is the time that the data reached a value to cause the current event.
End Time: The end time of the event. Note: This time is only known and displayed in the event log.
Status: This column only appears if Case Management is configured. An event has three possible statuses, relating to case management:
- Unknown: This is for an event that either hasn’t raised a case, or there is a case that is still in the New or Investigating status (in Explorer).
- Valid: The event has raised a case which has the Confirmed status (in Explorer).
- Invalid: The event has raised a case which has the Rejected status (in Explorer).
State Duration: The duration of the current event
Test: The name of a test that has test items with current events
Comments: The total number of event comments is displayed here.
Most Recent Comment: The most recent event comment is displayed here.
The events grid appearance can be manipulated in the following ways:
- You can sort most of the columns in the grid.
- You can group by a column header for the following columns:
- Monitor
- Test
- Asset
- Entity
- State
- Severity
- Status
Filtering Events
Most of the column headers offer the ability to filter data according to specified criteria:
Exporting Events
To export the event list for workspace events, folder events, or monitor events:
The events are exported to a Microsoft ® Excel ® spreadsheet.
Refreshing Events
The event for any entity will continue (as recorded in State Duration) until a state change causes a new event.
Refresh the events page to see the latest State Duration figure for a continuing event, or to view new event details.
- Click the Refresh
 button at the upper right of the tab.
The latest event information appears on the tab.
Editing Events
To edit an event:
1. In the events grid, locate the event you want to edit.
2. Double-click on the event in the grid.
The Edit Event window opens:
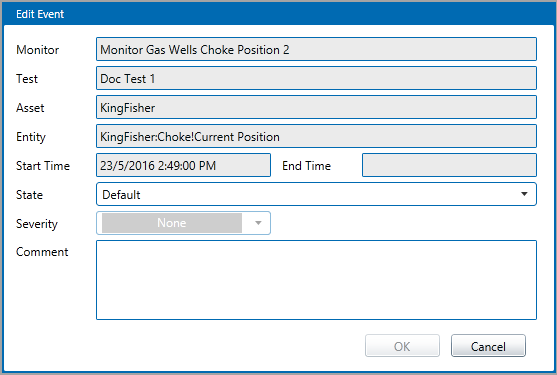
3. To change the state, select a new State from the drop-down list.
4. To change the severity, select a new Severity from the drop-down list. Note: You cannot change the severity of the Default state.
5. Type a Comment in the edit box. Note: This is required for all event updates.
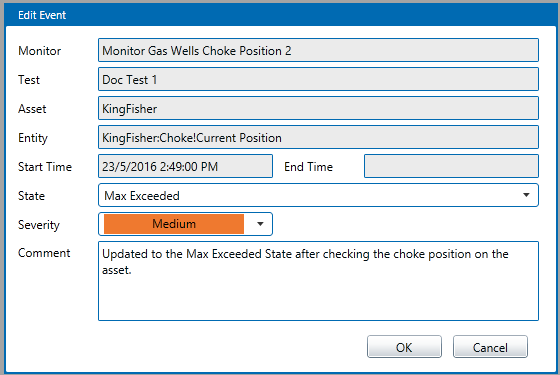
6. Click OK.
The event is updated with your comment, and a system comment.
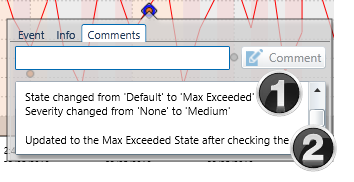
![]() Sentinel system comment
Sentinel system comment
![]() User comment
User comment