This article describes how the Sentinel Engine reads and processes data, to give you an insight into how and when the different parts are processed.
The Sentinel Engine is responsible for:
- Scheduling and running monitors
- Processing tests and process logic
- Storing/retrieving time series data in the Sentinel data cache
- Running debug user processes from Sentinel Studio
How a Monitor is Processed
Sentinel schedules each active monitor to run at a particular point in time. When this time is reached, the monitor processes the data from the ‘Last Run Time’ to ‘Now’. This time period is then divided into sections; the section period depends on the configuration settings ‘MinCatchupMonitorRunPeriodMinutes’ and ‘MaxCatchupMonitorRunPeriodMinutes’.
For each section of the processing time period, the monitor is processed in the following stages (in this order):
1. Each test in the monitor is assigned a processing thread (each test will get processed independently and in parallel to all other tests; this may mean individual tests run across different CPUs).
2. For each test, the following steps are taken:
- The list of entities which are to be processed is resolved. For hierarchy mode, this involves querying the Data Dictionary for entities from a point in the hierarchy, possibly with a particular template.
- Test suppression is checked.
- Data for each Primary Input is fetched from the Data Broker. If no data is returned for an Entity, the behaviour specified by the ‘NoDataBehavior’ configuration setting is performed (Error, Suppress, or Ignore).
- Data for the precondition is fetched from the Data Broker. If no data is returned for an Entity, the behaviour specified by the ‘NoDataBehavior’ configuration setting is performed (Error, Suppress, or Ignore).
- The precondition is processed and the period which is being processed is further sliced into periods of ‘Process’, ‘Suppressed’ or ‘Do not process’. (See the Suppressions section below).
- All other input data is fetched from the Data Broker for entities which will be processed. If no data is returned for an input, the behaviour specified by the ‘NoDataBehavior’ configuration setting is performed (Error, Suppress, or Ignore).
- The Process for this Test is used to process all of the data for all periods where the Precondition raised a ‘Process’ time slice. Events which are raised by the Process are held in memory for later processing.
3. The Monitor will wait until all tests ‘threads’ have successfully finished processing. The following steps occur in sequence:
- Each test is checked to see if any errors occurred during processing. If errors did occur, processing for this monitor is ended at this step. The monitor will then schedule again and ‘retry’ to process the same processing period.
- Any events which were raised by the process are written to the database.
- Any data which is to be written back to data sources is sent to the data broker.
- Actions are run for each event.
- If ‘Case Management’ is enabled, cases are raised by Sentinel.
- The monitor’s ‘Last Run Time’ is updated ready for the next run.
Note: If the Sentinel Engine Service is stopped, it has to signal to any running monitors to stop processing and then wait for them to successfully stop. This also means that any data cache data which is in memory needs to be flushed back to the files in the data cache (see the Data Cache section below). The service will not stop until all these steps have been performed.
It is possible to ‘kill’ the Engine process using task manager but there is a risk that upon restart, the data cache will not contain the latest data.
Suppressions
Test Suppression or Preconditions are calculated for the time period which is being processed.
In the example below, the test is monitoring input data to see if it has exceeded a high limit. There is also precondition data which is high or low. The precondition is configured to process when the value is high and suppress when low.
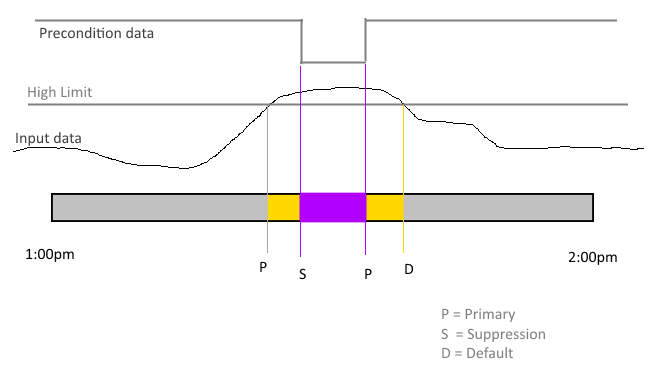
After a suppression is ended, the engine automatically raises an event with the same state as was raised prior to the suppression event. When this occurs, there will not be any event metadata on the ‘out-of-suppression’ event. In some circumstances, after the engine has raised the ‘out-of-suppression’ event, a point of data will get processed at the time the suppression ends, which may override the automatic state and in this case, event metadata will get added to the event.
Data Cache
When a process is using time windowing (performing some calculation/operation over a historical period), then Sentinel uses a local cache of the time-series data which has previously been processed. This cache allows rapid access of the data and stops the need for fetching the same data over and over from a data source.
This data is stored as individual streams in the ‘Cache’ folder in the main installation directory.
Because the data cache uses the local hard drive to persist the time-series streams of data, the processing speed of these streams (and of the Sentinel Monitor) can be impacted if some other process is using the hard drive frequently. For example, IFS OI Logger, any local database which is installed on the same drive, or multiple VMs sharing a physical drive.
If contention is an issue, the data cache can be moved to another drive by adding a Registry key:
HKEY_LOCAL_MACHINE/SOFTWARE/ISS/BabelFish Sentinel/CachePath
Set the key to REG_SZ and set the value to the path to the cache folder on the other drive.
After adding the key, remember to restart the Sentinel Engine Service.
Sentinel Studio Debugger
When User Processes are run in the Studio Debugger, the logic is run by the Sentinel Engine so the Engine Service must be running.