IFS OI Sentinel monitors entities and tags for compliance with specified thresholds, using a built-in event processing engine. Sentinel automatically raises events when defined conditions are met. This document outlines how to configure and use Sentinel.
Sentinel's intelligent real-time Complex Event Processing engine rapidly accesses and analyses vast amounts of data from disparate sources, using the Data Dictionary. Sentinel provides event notification, as well as detailed reports, timelines, event views and statistics.
Sentinel generates an event when an entity value breaches fixed or variable limits, or when specific conditions are met. In the Sentinel interface, tests are defined with limits and conditions, as well as entities to be monitored, using rules defined in a selected Sentinel process. Events give rise to a state; the different states for a test may be ranked by severity.
Sentinel records events in a relational database and, depending on the test configuration, instigates actions: short message service (SMS) or email notifications are sent to designated personnel, or calls to a web service are made. Actions are configured in the interface, and can be prioritised according to state severity. Information associated with the event is stored, facilitating event subscriptions from external applications.
Overview of Working with Sentinel
There are three main aspects to working with Sentinel:
Setting up Monitors
Monitors are added to workspaces and folders. Monitors use various test processes, triggers, and actions.
The following sections describe the concepts around monitors, triggers, test processes, test inputs, and actions, as well as assets, events, case management, and change management.
Viewing Outcomes
After the monitors have been configured and are active, you are able to view reports, create custom reports, and receive notifications.
Creating User Processes
Sentinel Studio allows those users with appropriate licensing and privileges to create processes (collectively called user processes) and define the conditions that trigger an event.
Assets
Sentinel uses the concept of an Asset to help to identify the events that are raised.
When you select a monitor item, while defining a Sentinel test, you identify which asset that item belongs to. Assets are mapped from a template, where the entity is configured with attributes and attribute values.
For example: Monitor the flow rate on a pump named Pump100. Pump100 has a template with a flow rate attribute which points to a tag called 01FCEAA. Any events raised have a reference to the entity (01FCEAA) and will also refer to the asset (Pump100).
In this example, the reporting shows that Pump100 raised the event.
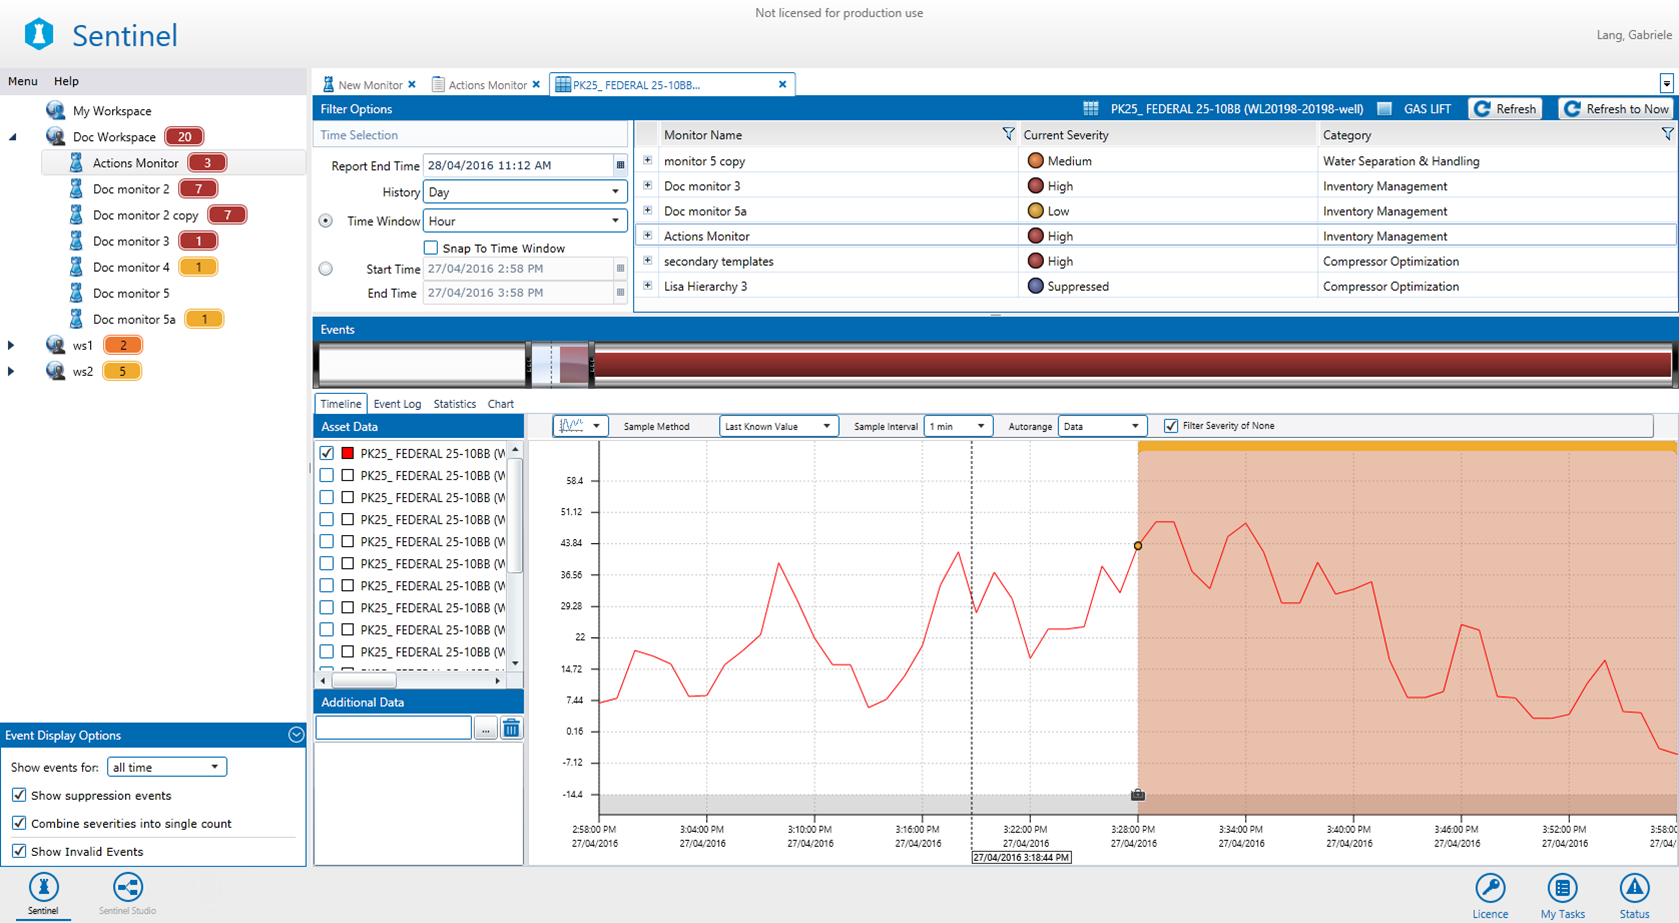
Sentinel Reports
The standard Sentinel reports show all events against a selected asset. When a test is set up, the asset is defined in the source panel. You may view all the events for any particular asset.
To limit the report data, several filtering options are available, such as which monitor events to view, and over which period. You may access reports through an asset, which is selected from a list of events.