With custom event views, you are able to view events based on the Explorer hierarchies.
Event views display assets (event view assets) that:
- Are monitored in Sentinel
- Belong to the selected hierarchy
- Are from the selected starting point
- Occur in the selected template
There are four types of custom event view that you can create in Sentinel. All of the views relate to events for the event view assets.
Note: Only events that have been raised by Sentinel may be viewed in the custom event view reports.
Event Report
The Event Report shows all events, for the selected date/time period, in an events grid, for the event view assets from the selected hierarchy and starting point. The report can be selected for all workspaces, or just for the current workspace.
The event report resembles the view events tab. It contains a header section, with the report parameters, and an events grid. 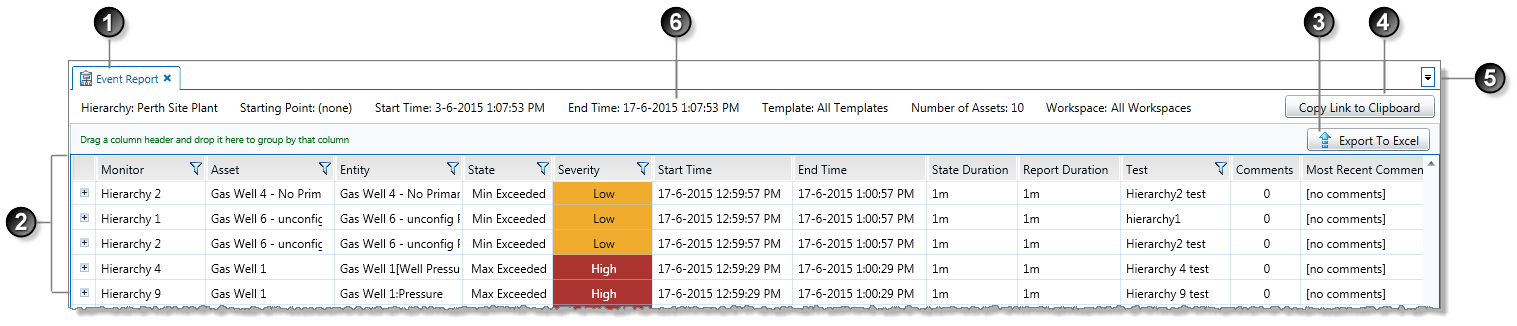
The Event Report is made up of the following:
| Event report title | The report name. | |
| Events grid | All of the current events for the event report, displayed in an events grid. Also included is a column called Report Duration. This shows the duration from the start of the event to the end of the report time selection. | |
| Export to Excel | Click to export the grid to a Microsoft Excel spreadsheet. | |
| Copy link to clipboard | Click to copy link to clipboard, as described in the next section. | |
| Select an open tab | Click the downward-pointing arrow, and select an open tab from the drop-down list. | |
| Report parameters and properties |
|
Event History Report
The Event History report shows all events, for the selected history, in an events grid, for the event view assets from the selected hierarchy and starting point. The report can be selected for all workspaces, or just for the current workspace.
The event history report resembles the view events tab. It contains a header section, with the report parameters, and an events grid.
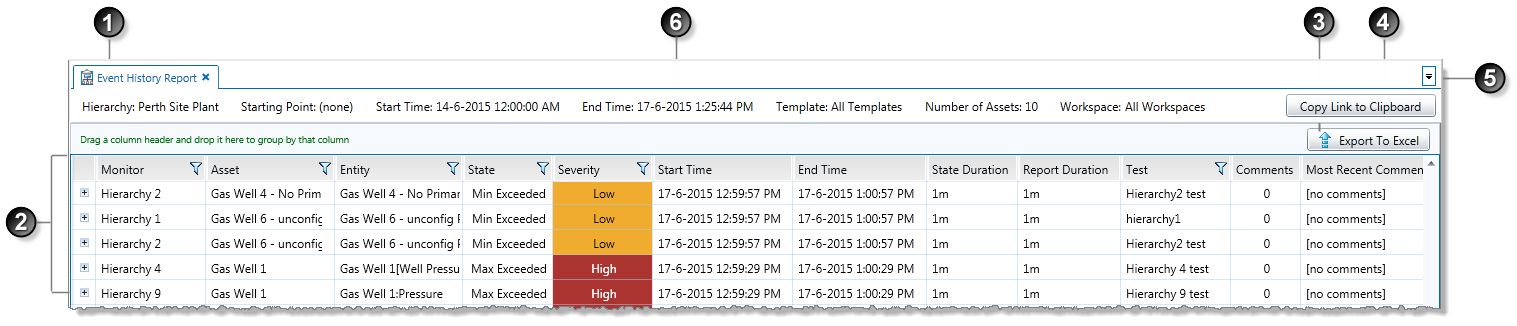
The Event History report is made up of the following:
| Event History report title | The report name. | |
| Events grid | All of the current events for the event history report, displayed in an events grid. Also included is a column called Report Duration. This shows the duration from the start of the event to the end of the report time selection. | |
| Export to Excel | Click to export the grid to a Microsoft Excel spreadsheet. | |
| Copy link to clipboard | Click to copy link to clipboard, as described in the next section. | |
| Select an open tab | Click the downward-pointing arrow, and select an open tab from the drop-down list. | |
| Report parameters and properties |
|
Event Timeline Report
The Event Timeline Report shows all events for the event view assets, over the selected period, optionally filtered for Severity of None.
For saved reports, events for the latest period are displayed every time you open the page to view the report. Every time you open this report, the reporting period adjusts so that the end of the period is current time; the start of the reporting period is determined by the period parameter.
The event timeline view shows the affected assets, with a corresponding percentage time chart, and an event timeline, as well as the highest severity and the event count, per asset.
Note: To limit the report result set, filter one or more of: the Asset list, the Highest Severity list, or the Event Count list.
The Event Timeline report contains a header section and a report section.
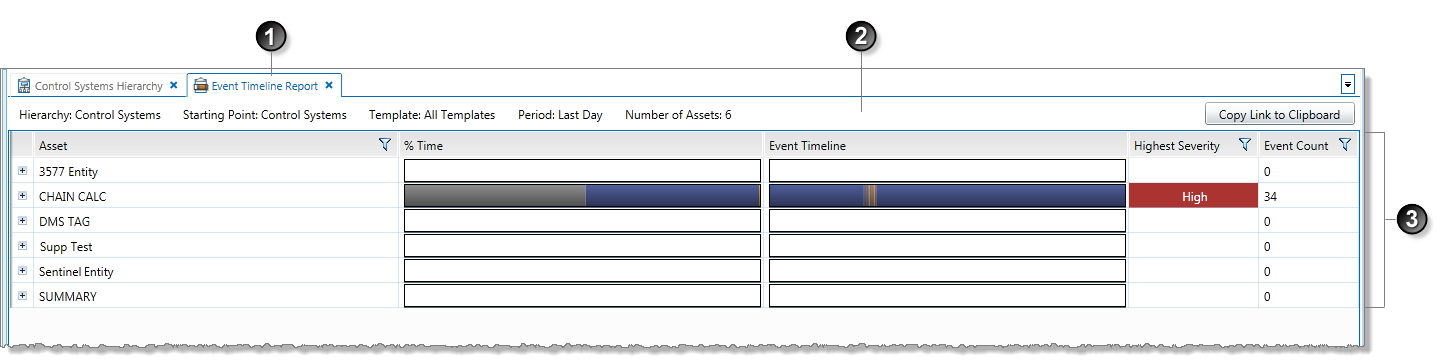
The Event Timeline report is made up of the following:
| Event Timeline report title | The report name. | |
| Report parameters and properties |
|
|
| Report body |
|
Asset Details
When you click on the expand ![]() button next to an asset, the report shows event details for every test that uses that particular asset, within the reporting parameters.
button next to an asset, the report shows event details for every test that uses that particular asset, within the reporting parameters.
In this section of the report, the report body shows the monitor name and the test name for the expanded asset.
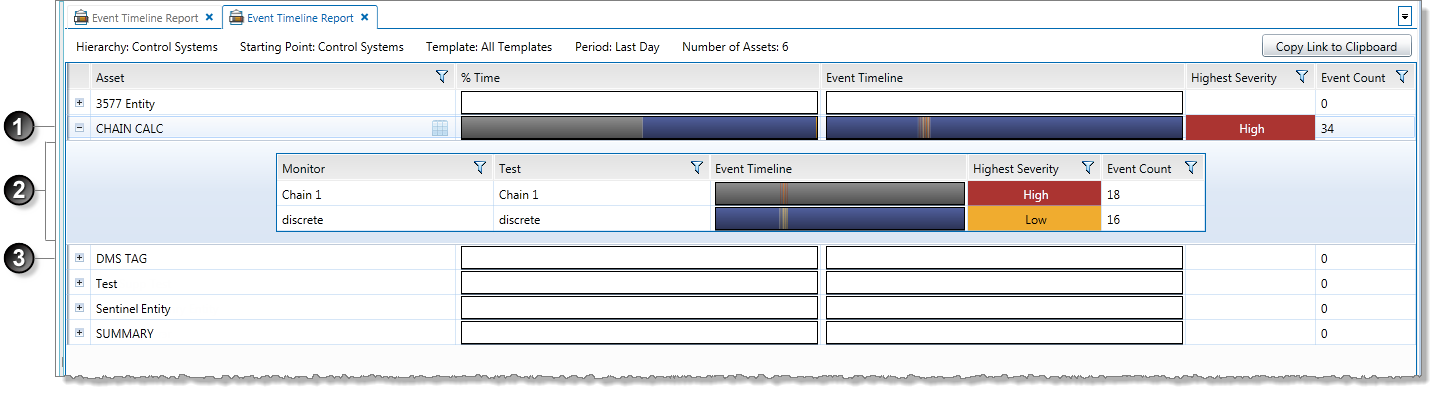
| The expanded asset | |
| Monitor and test detail for the expanded asset | |
| The next asset in the report |
Hierarchy Report
The hierarchy view essentially shows an events grid for the affected assets.
The Hierarchy Report shows all current events for the event view assets. For saved reports, current events are displayed every time you open the page to view the report.
The hierarchy report resembles the view events tab. It contains a header section, with the report parameters, and an events grid.
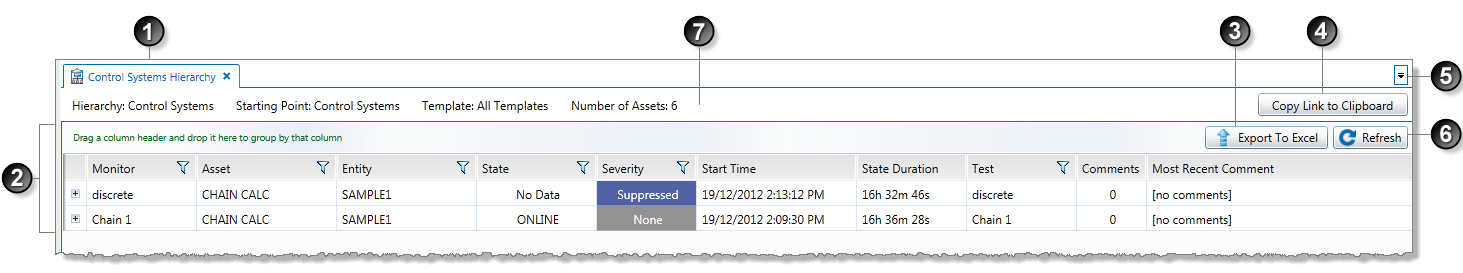
The Hierarchy report is made up of the following:
| Hierarchy report title | The report name. | |
| Events grid | All of the current events for the hierarchy report, displayed in an events grid. | |
| Export to Excel | Click to export the grid to a Microsoft Excel spreadsheet. | |
| Copy link to clipboard | Click to copy link to clipboard, as described in the next section. | |
| Select an open tab | Click the downward-pointing arrow, and select an open tab from the drop-down list. | |
| Refresh | Click to refresh the page. The latest events are shown. | |
| Report parameters and properties |
|