Performance Counters
Performance counters allow you to observe the activity of the Sentinel system in order to understand how it is performing. A number of Sentinel Engine performance counters are available from the Windows Performance Monitor.
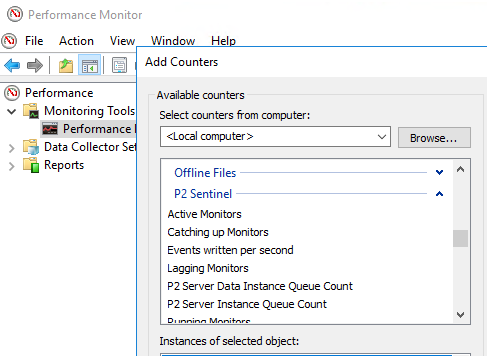
The performance counters are:
| Active Monitors | Total number of active monitors configured |
| Catching up Monitors | Total number of monitors which are fetching data from the past ("Catching up") |
| Events written per second | Number of events which Sentinel has raised per second |
| Lagging Monitors | Total number of monitors which have taken longer to run than the scheduled period (e.g. a monitor which is scheduled for once a minute but had taken more than 1 minute to process all tests) |
| Server Data Instance Queue Count | Number of data requests which are pending |
| Server Instance Queue Count | Number of data dictionary requests which are pending |
| Running Monitors | Number of monitors which are currently running |
| Scheduler Queue Size | Number of monitors which are scheduled to run |
| Total monitor pipeline queue count | Number of monitors which have a thread assigned for processing |
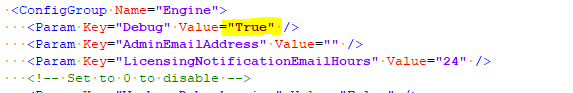
To enable the performance counters, the Debug key in the Engine group of the SentinelConfig.xml file needs to set to True:
Performance Metrics
In v4.17, a TestPerformanceMetrics table was added to the Sentinel database, which captures performance metrics for each monitor/test.
Two new configuration settings have been added to the Sentinel Configuration file:
- MonitorPerformanceMetricsEnabled: This needs to be set to True for the metrics to be collected.
- MonitorPerformanceMetricsPurgeTimeoutHours: Specifies how often to delete all the metrics from the table.
The table contains the following columns, which can be used to analyse performance issues:
| Column | Description |
| TestId | The unique identifier of the test being analysed. |
| TestVersionId | The version of the test. |
| MonitorVersionId | The version of the monitor. |
| TestRunTime | Time, in milliseconds, taken to run the test. |
| DataFetchTime | Time, in milliseconds, taken to fetch the data. |
| EventWriteTime | Time, in milliseconds, taken to an event to be written to the database. |
| TotalRunTime | Total time, in milliseconds, taken for the monitor to run. |
| FetchSourceTime | Time, in milliseconds, for the data source to respond to the fetch request. |
| PreConditionRunTime | Time, in milliseconds, taken to for the pre-condition to run. |
| EntityCount | The number of entities being processed. |
| TriggerTime | The timestamp that the test was triggered. |
| ProcessingStartTime | The timestamp that the test started being processed. |
Release History
- Performance Monitoring 4.17 (this release)
- Added TestPerformanceMetrics table to the Sentinel database
- Performance Counters (initial release)