ON THIS PAGE:
You need to add at least one test to a monitor.
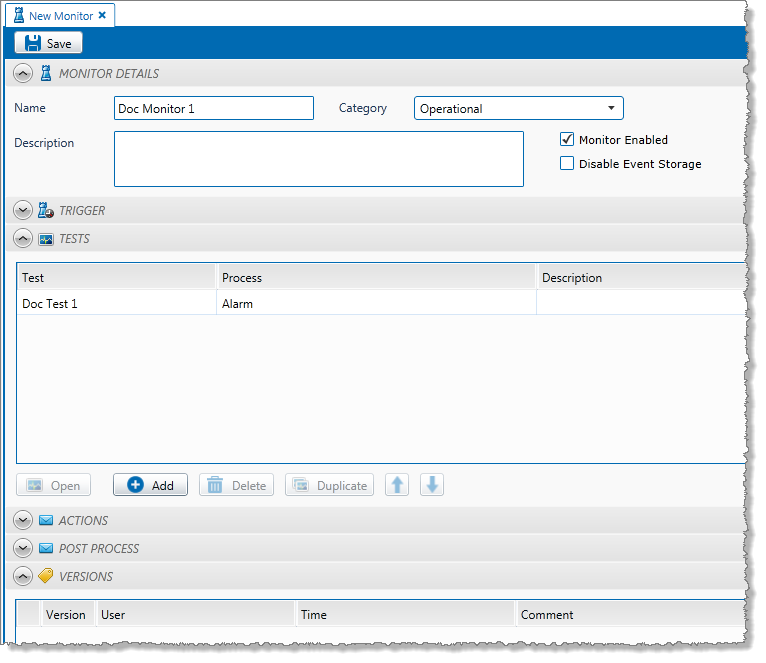
In the New Monitor ![]() page:
page:
1. Expand the Tests ![]() panel.
panel.
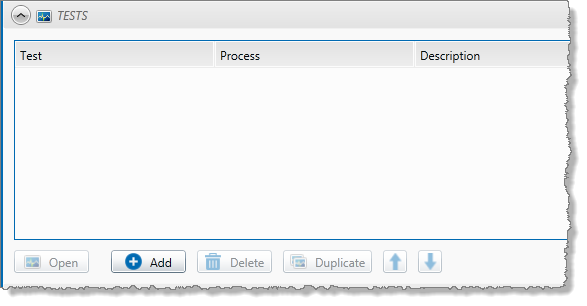
2. Click Add.
The new test page appears.
3. Set up the following components of the test; each panel is described in detail in the following sections.
- Test Details: Add a test name and description here.
- Test Suppression: Set a suppression for the test. For example, suppress the test if your test monitor items are due for maintenance. This is optional.
- Source: Choose a test source. The process uses this source.
- Precondition: Set a precondition. Test data is only evaluated when the precondition is met. This is optional.
- Process: Select a process to run the test. Define the input, and the relevant test condition parameters.
- State Configuration: Configure severity levels for the different possible state outcomes, and configure Case Management and Case Options (if Case Management is enabled). Optionally apply a state override. Add state configuration comments.
- Auxiliary Data: Define auxiliary data for the test. Auxiliary data values are saved with event details.
- Actions: You will only be able to select actions for the test when actions have been added to the monitor.
4. When you have finished adding the test, click OK to close the test panel, and optionally add a comment to the test panel, describing the reasons you have chosen to use this test.
Note: The test page contains a lot of information. Expand or collapse panels as needed.
Test Details
- Expand the Test Details
 panel.
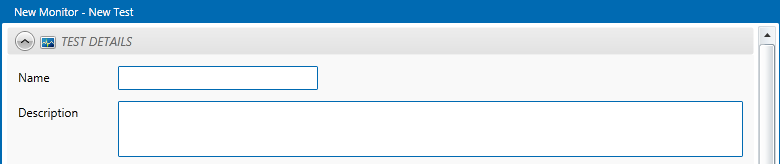
- Type a name in the Name box. This must be a unique name for the test.
- Type a description in the Description box. This is an optional description of what the test is used for.
Test Suppression
This is an optional step for when you want to suppress the test for a specific reason, for example when a piece of machinery is going down for planned maintenance.
1. Expand the Test Suppression ![]() panel.
panel.

2. From the Suppression drop-down list, select Time Suppression.
The panel changes, as shown below:
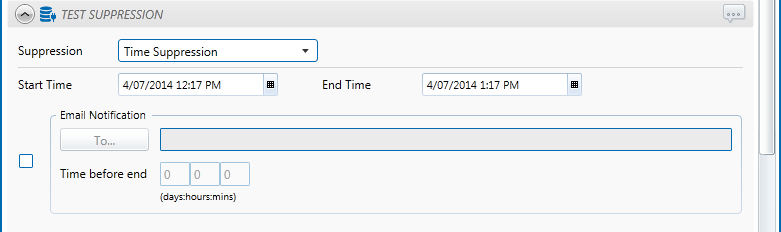
3. In the Start Time edit box, click the calendar ![]() icon to select a start date and time.
icon to select a start date and time.
4. In the End Time edit box, click the calendar ![]() icon to select an end date and time.
icon to select an end date and time.
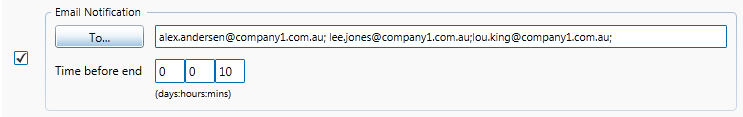
5. If required, specify email notification details:
- Select the check box to the left of the Email Notification panel, and add a list of email addresses by typing one or more valid email addresses in the text box (separated by semicolons).
or - Click To.
The Choose Contacts page opens, displaying all contacts on the mail server database that have an email address.
- In the Filter box, type part of a contact name, or part of an email address to filter the contact list.
- To add a contact from the list, double-click a user or a group. The User or Group is added to the To edit box.
- Keep adding contacts following the instructions, above.
- Click Add.
The Choose Contacts page closes, and the list of contacts is added to the Email Notification edit box. - In the Time before end edit box, capture the email notification time in days, hours, and minutes.
This specifies the interval before the end of the suppression period, at which time the email notification is sent to the email notification contacts.
6. Click the comment ![]() button on the top right corner of the Test Suppression panel, to add an optional comment, describing the reasons you have chosen the test suppression.
button on the top right corner of the Test Suppression panel, to add an optional comment, describing the reasons you have chosen the test suppression.
Note: You can set a new test suppression at any time by editing the monitor.
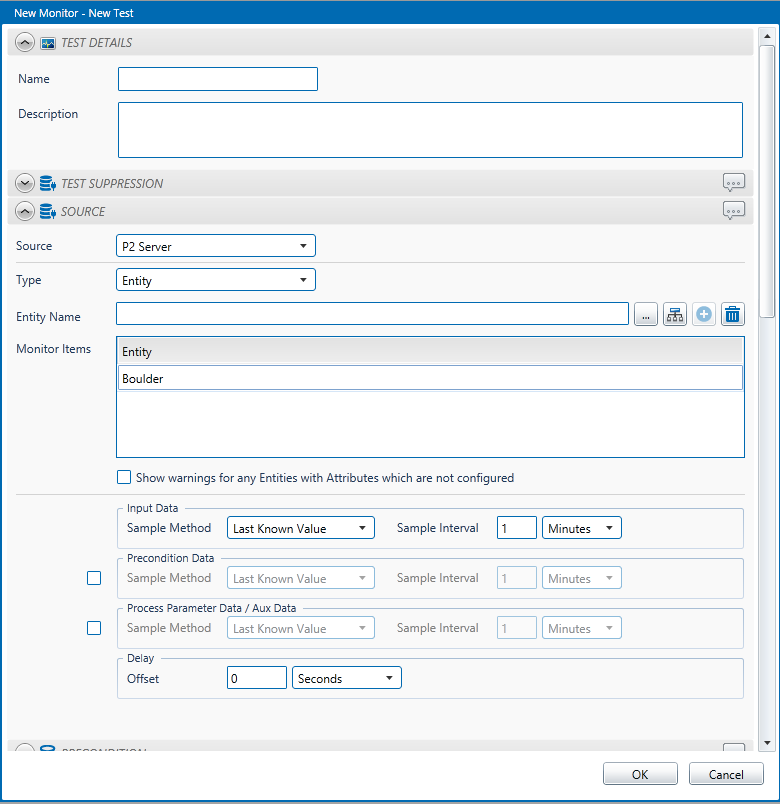
Source
There are three types of data source to use: Entity, Tag and Hierarchy.
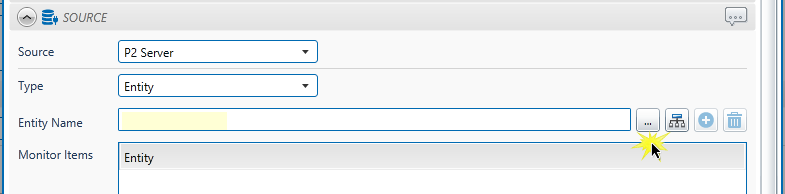
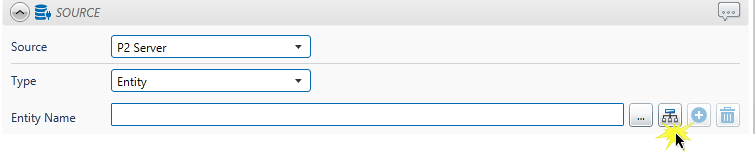
1. Expand the Source ![]() panel.
panel.
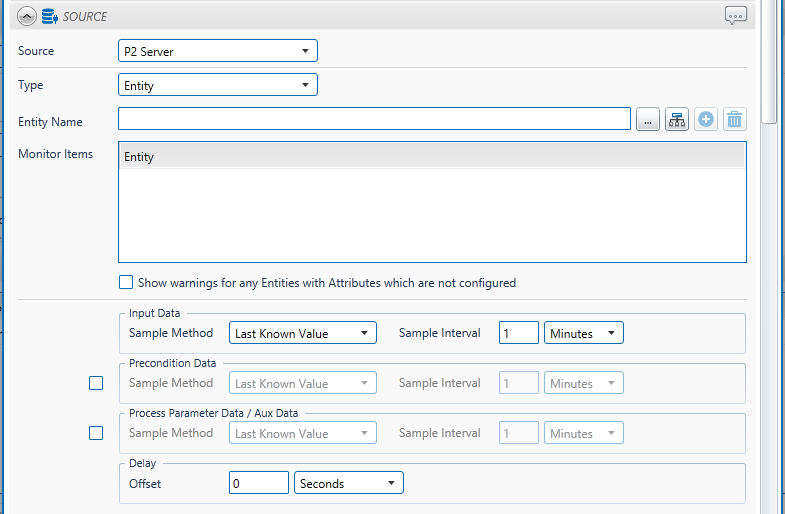
2. In the Source drop-down list, select a source.
3. In the Type drop-down list, select a source type (see below sections for more details):
- Entity: This is the default source type. With an entity type, you are able to select individual entities to monitor; these are listed as monitor items.
- Monitor Items: The selected entities are listed. The Entity is the source of the process input. (In Sentinel, this is known as the Asset. All Sentinel reporting is based on assets.)
- Show warnings for any Entities with Attributes which are not configured: If you unselect this check box, Sentinel will ignore the entities that have missing attributes. If you select it, Sentinel will send a warning message for any of these. It can be useful to know about any un-configured attributes when you are first working with the monitor.
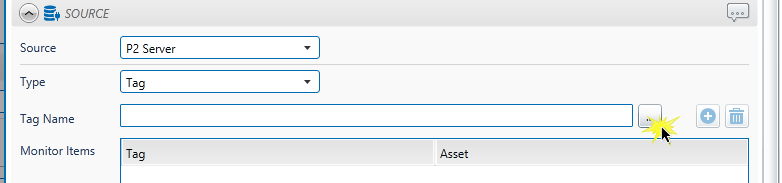
- Tag: If you select Tag, different fields are displayed on the screen. With the tag type, you are able to select individual entities to monitor; these are listed as monitor items.
- Monitor Items: The selected tags are listed. The tag is the source of the process input. Because tags can be related to more than one entity (in Explorer), you need to define the entity, by selecting it from the Asset drop-down list under this is (Entities are referred to as called Assets in Sentinel).
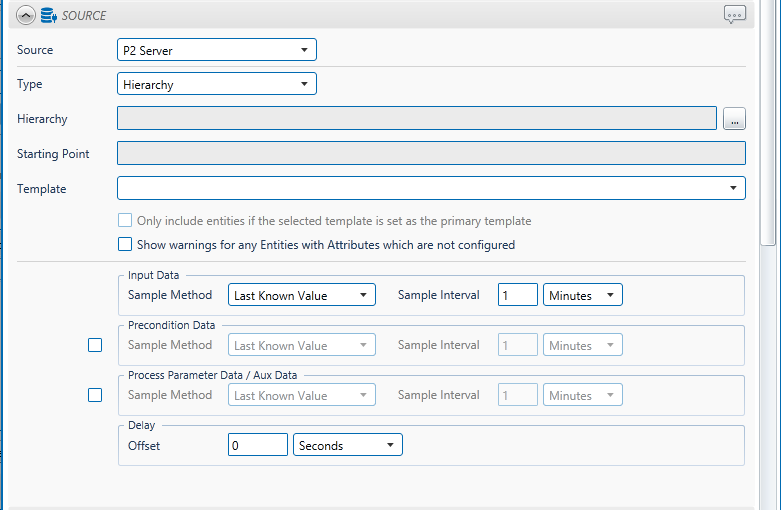
- Hierarchy: If you select Hierarchy, different fields are displayed on the screen. You can monitor all the entities from a specified point in the Data Dictionary hierarchy.
-
- Hierarchy: A Server entity hierarchy.
- Starting Point: This is the starting point in the hierarchy, used in the test. All entities from this point in the hierarchy are available as source entities.
- Template: Only entities that exist in the selected template structure are source entities.
- Only include entities if the selected template is set as the primary template: Select this check box if you only want to include entities where the selected template is set as the primary template. Note: By default, this option is not selected.
- Show warnings for any Entities with Attributes which are not configured: If you unselect this check box, Sentinel will ignore the entities that have missing attributes. If you select it, Sentinel will send a warning message for any of these. It can be useful to know about any un-configured attributes when you are first working with the monitor.
4. For the Input Data, define the sample method and sample interval.
- Sample Method: The options available depend on which Sentinel process is being used.
- Last Known Value: The last known value of the data is used, even if this data point is in the past. This sample method is only available for processes using continuous data.
- Linear Interpolate: Requests a linear interpolation of the data for the time specified by the Sample Interval period. This sample method is only available for processes using continuous data.
- Average: Requests an average of the data between the times determined by the Sample Interval period. This sample method is only available for processes using continuous data.
- Raw: Displays the most recent data for tags for the time specified by the Sample Interval period. This is only available for processes using discrete data.
- Sample Interval. This is the regular interval between trigger periods, to collect sample data. At every sample interval, the collected data is prepared according to the sample method used, and then evaluated in the process. You can specify the sample interval in seconds, minutes, hours, days, or weeks. The default sample interval is 1 minute.
For accurate results and predictable behaviour, choose a sample interval that correlates well with the trigger interval that this monitor is using. For example, if the monitor’s trigger interval is hourly, select a sample interval that divides evenly into that interval, such as one minute, five minutes, six minutes, ten minutes, fifteen minutes, twenty minutes, and so on. In this example, a sample interval of 35 minutes does not divide evenly into the one hour trigger interval, in which case the second 35 minutes fall beyond the trigger’s end time and will not be processed for that trigger interval.
-
- In the Sample Interval box, type an integer value. The default value is 1 (minute).
- In the Interval Type drop-down list for Sample Interval, select an interval type. The default type is Minutes.
5. If you have defined a precondition and you want to define a different sample method and interval for the collection of this data, then select the check box to the left of the Precondition Data box, and define the sample method and interval in the same way as for the Input Data.
You may want to do this if, for example, your monitor is using a Discrete Min Max process, fetching Raw data, but your precondition is dependent on the evaluation of continuous data.
If you do not define this, then precondition data (if you have defined a precondition) is fetched using the same sample method and interval as the input data.
6. If you want to define a different sample method and interval for the collection of process parameter or auxiliary data, then select the check box to the left of the Process Parameter / Aux Data box, and define the sample method and interval in the same way as for the Input Data.
If you do not define this, then process parameter data and auxiliary data is fetched using the same sample method and interval as the input data. For this reason, you need to select the check if your process is a Discrete Min Max Process, as that process type can only use the Raw sample method, whereas the auxiliary data needs to be defined (as Last Known Value, Average, or Linear Interpolate).
7. Define an optional delay period for the input data, precondition data and process parameter data.
By setting this option, Sentinel delays collecting the sample data by the specified interval of time. This option is useful in cases such as when a historian is writing data at a similar time to when Sentinel is reading data.
- In the Delay box, type an integer value. The default value is 0.
- In the Interval Type drop-down list for Delay, select an interval type. The default type is Seconds. Options are: seconds, minutes, hours, days and weeks.
8. Click the comment ![]() button on the top right corner of the Source panel, to add an optional comment, describing the reasons you have chosen this source.
button on the top right corner of the Source panel, to add an optional comment, describing the reasons you have chosen this source.
Entity Source Type
If you select Entity as your source type, you can add a selection of entities by typing in valid entity names, or by using the Server Browser with Selection Type: Entity and/or you can choose entities from a hierarchy, using the Server Browser with Selection Type: Hierarchy.
Using the Entity Picker
You can add a selection of entities in two ways:
Entity Name:
- In the Entity Name box, type a valid entity name.
- Click the Add
 button next to the Entity Name, or click in the Entity Name box and press Enter. Note: The Add button appears dimmed if the entity name is invalid or incomplete.
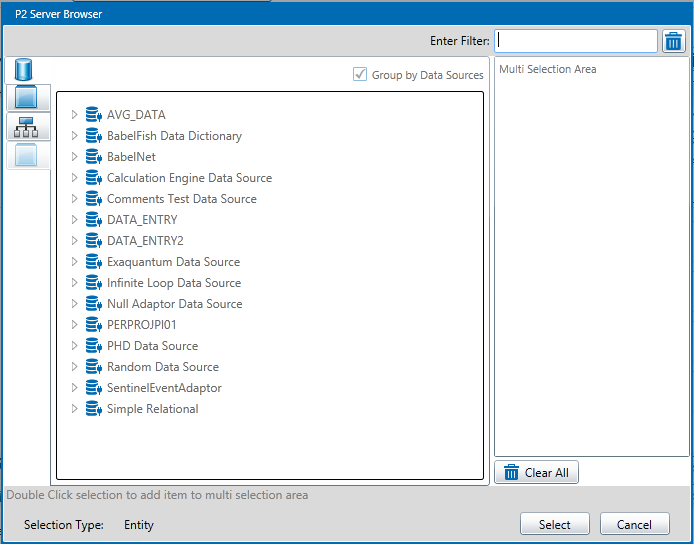
Server Browser:
- Click the Server Browser
 button next to the Entity Name box, select one or more Entities
  , and click Select.
The new entities appear in the Monitor Items grid, below Entity Name.
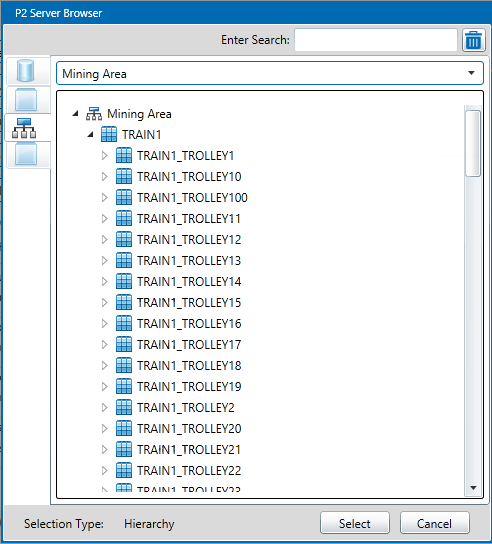
Using the Hierarchy Picker
To add entities using the hierarchy picker, click the Hierarchy ![]() button next to the Entity Name box, and select a hierarchical group of entities
button next to the Entity Name box, and select a hierarchical group of entities ![]() by selecting a hierarchy, an optional starting point, and an optional template.
by selecting a hierarchy, an optional starting point, and an optional template.
The new entities appear in the Monitor Items grid, along with any other entities you have already added.
Continue to add monitor items for the test until your list is complete.
Tip: To remove unwanted Monitor Items from the grid, click on a single monitor item or use Ctrl + A to select multiple items. Click the Delete ![]() button alongside the Entity Name box. The selected monitor items are deleted.
button alongside the Entity Name box. The selected monitor items are deleted.
Tag Source Type
If you select Tag as your source type, you can add a selection of tags by typing tag names, or by using Selection Type: Tag and/or you can choose tags from a hierarchy, using Selection Type: Hierarchy.
Tag Name:
- In the Tag Name box, type a valid tag name.
- Click the Add
 button next to the Entity Name, or click in the Entity Name box and press Enter. Note: The Add button appears dimmed if the tag name is invalid or incomplete.
Server Browser:
- Click the Server Browser
 button next to the Tag Name box, select one or more Tags
  , and click Select.
The new tags appear in the Monitor Items grid, below Tag.
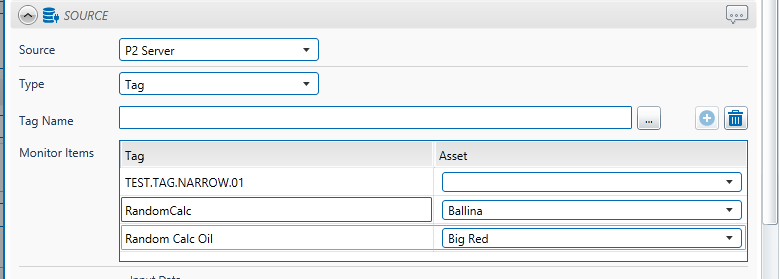
For each tag that has an entity, select an asset (entity).
Note: Cases cannot be raised against tags that do not have an asset selected.
Hierarchy Source Type
To select a Hierarchy and a Starting Point:
- Click the Server Browser
 button next to the Hierarchy box.
 - Navigate through the hierarchy
 and click an entity
  .
.
The Server Browser can also be used for selecting either an entity or a tag. For example, if you are adding data to a Timeline report, the dialog opens for Selection Type Tag, Entity.
To select a tag:
- Click the Data Sources button on the left.
- Optionally type filter text into the Enter Search box, as shown.
- Expand a data source (if Group by Data Sources is selected) and scroll down the list of tags (filtered or unfiltered) listed to locate your tag.
Or
- Scroll down the ungrouped list of tags (filtered or unfiltered) to locate your tag.
- Click on a tag.
- Click Select.
To select an entity (by template):
- Click the Templates button on the left.
- Optionally type filter text into the Enter Search box, as shown.
- Select a template group from the drop-down list.
- Expand a template and scroll down the list of tags (filtered or unfiltered) listed to locate your entity.
- Click on the entity.
- Click Select.
To select an entity (by hierarchy):
- Click the Hierarchies button on the left.
- Select a hierarchy from the drop-down list.
- Optionally type filter text into the Enter Search box, as shown, and select from the drop-down list. The entity is auto-selected if there is a search match.
Or
- Navigate through the hierarchies until you locate your entity, then click it.
- Click on the entity.
- Click Select.
Precondition
Add a precondition, in the Precondition ![]() panel of the test.
panel of the test.
You can choose the following combinations for the preconditions, in order for the precondition to succeed:
One condition specified: This condition must be met, in order for the precondition to pass evaluation.
Two conditions:
If AND is selected, then both Condition 1 and Condition 2 must be met, for this portion of the precondition to pass evaluation.
If OR is selected, then either Condition 1 or Condition 2 must be met, for this portion of the precondition to pass evaluation.
Three conditions:
If AND is selected, then the combined outcome of Condition 1 and Condition 2, as well as the outcome for Condition 3, must be met for the precondition to pass evaluation.
If OR is selected, then either the combined outcome of Condition 1 and Condition 2, or the outcome for Condition 3, must be met for the precondition to pass evaluation.
If you have set at least one condition in the Precondition section, you can also add an Out of Suppression Delay.
Out of Suppression Delay: As soon as the preconditions have been met, there is a further delay for the duration of the Out of Suppression Delay.
1. Expand the Precondition panel.
2. Select Standard from the Type drop-down list. The default is None.
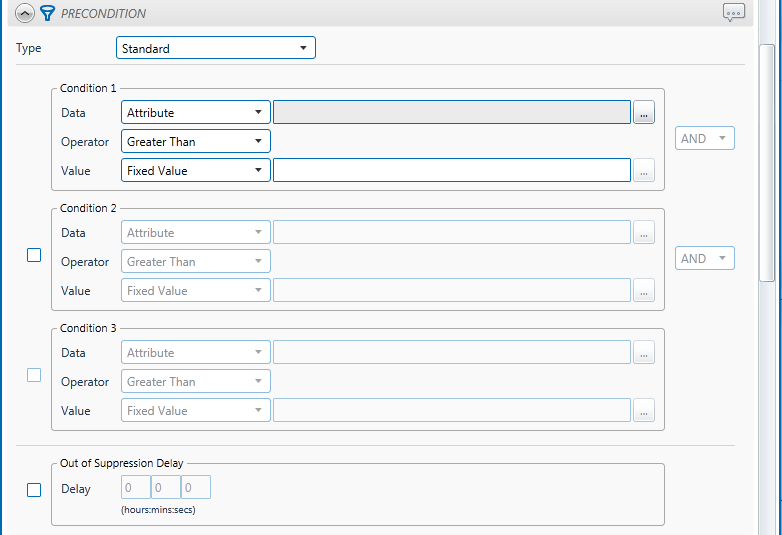
You may add up to three conditions, as well as an Out of Suppression Delay.
3. Fill in the details for Condition 1:
- Data:
- Attribute: This is available where the Source Type is either Entity or Hierarchy. Click the ellipsis
 button to see templates of the source entities. To view primary templates of the source entities, select the Primary Template check box. Select an attribute.
- Attribute: This is available where the Source Type is either Entity or Hierarchy. Click the ellipsis
-
- Source Tag: This is available where the Source Type is a Tag.
- Calculation: Click the ellipsis
 button to open the Edit Calculation window.
- Where the source type is Entity or Hierarchy, enter ‘this’ for the source entity token, followed by an attribute or attribute value definition. For example: {this:THP} + 34. Another example: {this:Choke!Current Position}*1.2
- Where the source type is Tag, enter ‘this’ for the tag token. For example: {this} * 1.2.
Note: The source entity token (this) used in the calculation expression must be selected in the Source Monitor Items in order for the calculation to run for the precondition.
- From the Operator drop-down list, select an operator (e.g. Equals).
- Value: This is the value that the Data will be compared to, when this part of the precondition is evaluated.
- Fixed Value: Type in a numerical value.
- Attribute: This option is only available if the test’s Source Type is Entity or Hierarchy. Click the ellipsis
 button to select an attribute or attribute value from one of the source entities.
-
-
- Calculation: Click the ellipsis
 button to open the Edit Calculation window.
- If the Source Type is Entity or Hierarchy
Type a calculation, prefixed by ‘this’ as the Source Entity token, for example: {this:THP} + 34. - If the Source Type is Tag
Type a calculation, prefixed by ‘this’ as the Source Tag token, for example: {this} * 2.
- If the Source Type is Entity or Hierarchy
- Entity Attribute: Click the ellipsis
 button to select an entity. From here, select an attribute, or attribute value, by using the Attribute Picker for the selected attribute.
- Calculation: Click the ellipsis
-
4. (Optional) To add a second condition:
- Select the check box to the left of Condition 2.
- Select AND or OR from the drop-down list to the right of Condition 1.
- Fill in the details for Condition 2 (in the same way as for Condition 1).
5. (Optional) To add a third condition:
- Select the check box to the left of Condition 3.
- Select AND or OR from the drop-down list to the right of Condition 2.
- Fill in the details for Condition 3.
6. (Optional) To add an Out of Suppression Delay:
- Select the check box to the left of the Out of Suppression Delay section.
- Type integer values for hours, minutes, and seconds in the Delay edit boxes, in the Out of Suppression Display section.
Note: You must have at least one condition selected, as the Out of Suppression Delay only takes effect after the conditions are met.
7. Click the comment ![]() button on the top right corner of the Precondition panel, to add an optional comment, describing the reasons you have chosen this precondition.
button on the top right corner of the Precondition panel, to add an optional comment, describing the reasons you have chosen this precondition.
Process
Every test uses a specific type of process. Each process has different limits to define; some of these limits are optional.
Sentinel has several processes to choose from; the available processes will depend on the licence arrangement for this installation of Sentinel.
In the Test page:
1. Expand the Process ![]() panel.
panel.
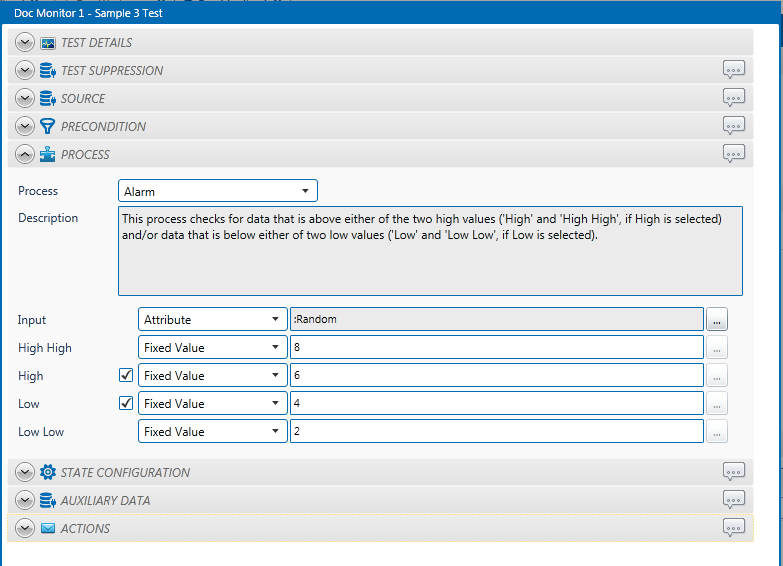
2. Add the process, following the specific instructions for the process that you want to use.
3. Click the comment ![]() button on the top right corner of the Process panel, to add an optional comment, describing the reasons you have chosen the various configurations for the process.
button on the top right corner of the Process panel, to add an optional comment, describing the reasons you have chosen the various configurations for the process.
User Process
User processes are defined using Sentinel Studio. Once created, these processes are available for Sentinel monitor tests.
Note: Sentinel Studio is intended to be used by advanced Sentinel users within an organisation, and also requires a licence. Not everyone will have the security privileges required to access Sentinel Studio. If you want to create or modify a user process, contact your System Administrator.
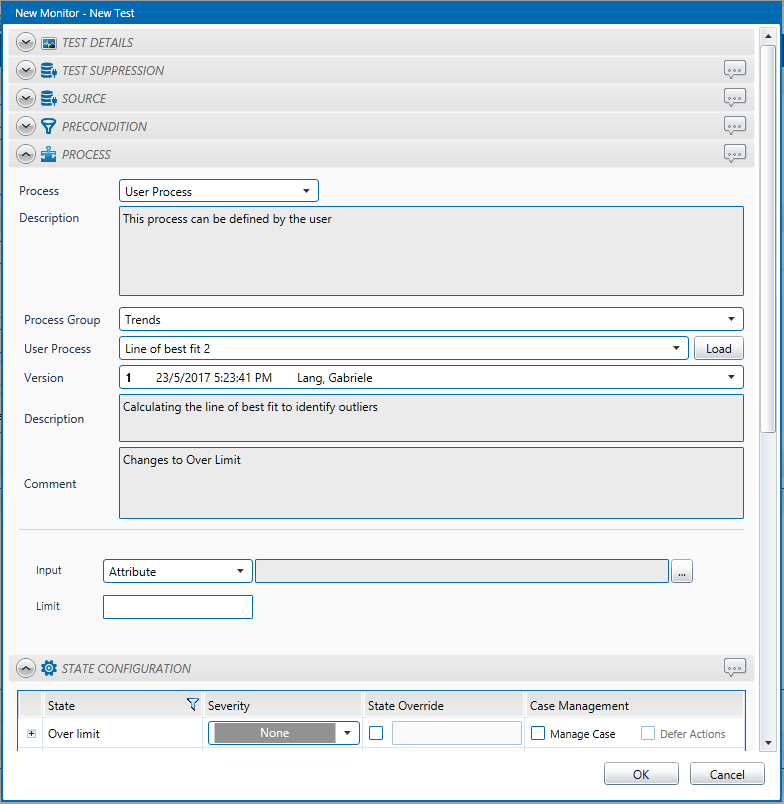
When you select a User Process, you need to select the following:
Process Group: User processes may be saved into groups to make them easier to find at a later date. If you don’t select a group, all user processes will be listed.
User Process: Select the process defined in Sentinel Studio that will analyse the data required to raise events.
Version: Every time a user process is modified and saved, a new version is created. Select the version of the process that you want to use.
Description: The process description, summarising what the process is used for.
Comment: If Sentinel is configured for User Process comments, the user needs to add a comment every time the user process is saved. The comment relating to the selected version is displayed here.
After the version has been defined, you need to specify the test inputs and test evaluators to be handled by the process. These will only appear after the user process version has been selected and will differ widely, depending on how the user process has been defined. If you are unsure of how a particular user process works, the name of the person who modified the process is listed next to the version number, for you to follow up with.
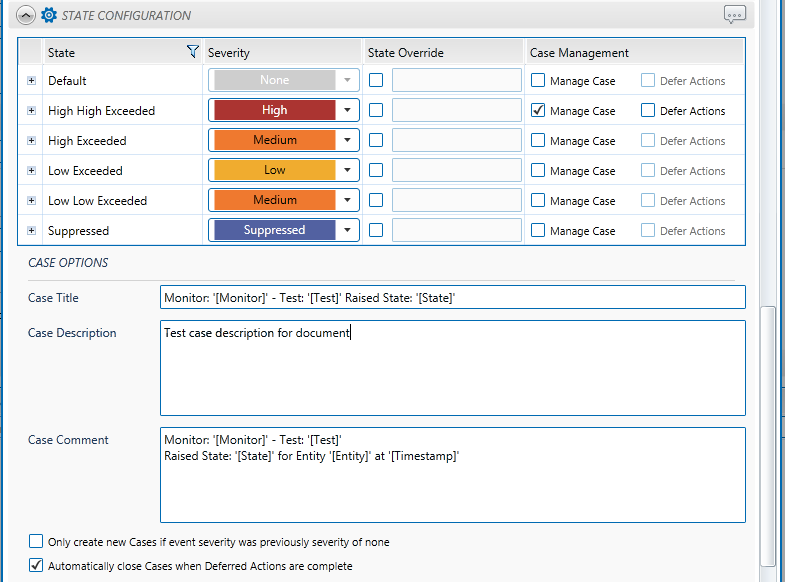
Configure States
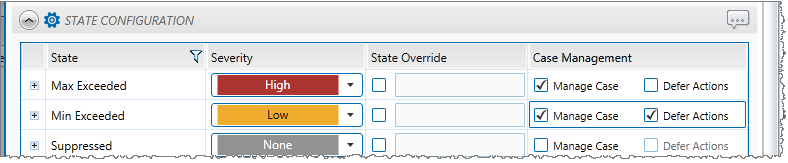
Every possible state outcome for a test can be configured at a severity level (the possible state outcomes depend on the process you have chosen).
This screenshot below shows an example of a state configuration:
To configure the state outcomes for a test in the State Configuration ![]() panel of the test:
panel of the test:
1. Expand the State Configuration panel. In the state configuration panel, there is a list of possible state outcomes.
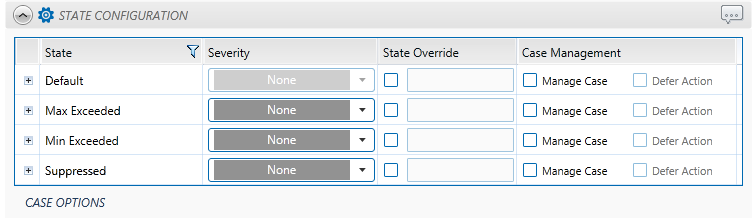
2. Configure each state in the list:
- Select a severity from the corresponding Severity drop-down list. The Default severity state is fixed at None.
Note: The default state cannot be configured; however, you can add a state override and comments.
- Optionally add a state override.
- Select the corresponding check box for the state.
- Type a valid state override in the corresponding State Override box for the state.
To clear a state override, deselect the check box.
- Optionally configure Case Management for the state. This is only available if Sentinel is configured to use Case Management.
-
- Select Manage Case so that Sentinel raises a case along with the event, for this state.
- Optionally select Defer Action for Sentinel to defer all actions for the state until the case is closed. If the case is rejected, the actions will not happen at all.
Note: These comments can be included as tokens in email or SMS, SMS via Web Service, and Web Service actions, making it easier for notification to understand possible causes before taking remedial action. The comments also appear in the case details, in Explorer.
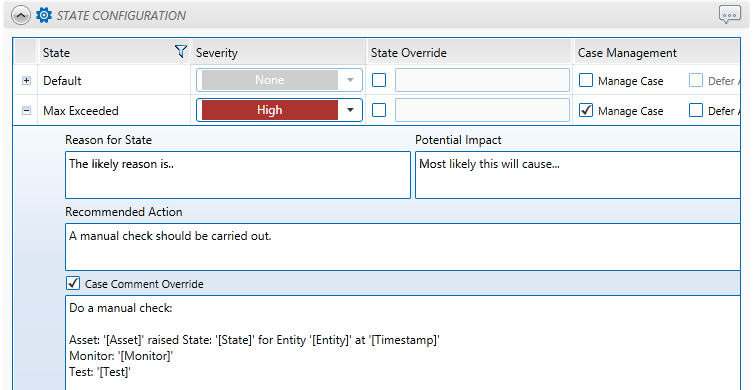
- Click the expand
 button in the left-most column of the state configuration grid. The state comments panel opens:
-
- In the Reason for State box, type a comment stating the most likely reason for this state outcome, for this test.
-
-
- In the Potential Impact box, type a comment outlining the potential impact of the test reaching this state.
- In the Recommended Action box, type a comment recommending what action to take, following this state outcome.
- To override the Case Comment for this test’s Case Options, selected the Case Comment Override check box, then type in a comment. This is saved in the case commentary when a case is raised for this state, in this test. We recommend you include tokens for the asset, monitor, test, state and timestamp: ‘[Asset]’, ‘[Monitor]’, ‘[Test]’, ‘[State]’ and ‘[Timestamp]’ to give the case some context, and also to make it easier to find the case on the event timeline. Note: This is only available if Sentinel is configured to use Case Management.
-
-
- To close the state panel, click the collapse button in the left-most column of the state configuration grid.
2. Click the comment ![]() button on the top right corner of the State Configuration panel to add an optional comment describing the reasons why you have chosen the various state configurations.
button on the top right corner of the State Configuration panel to add an optional comment describing the reasons why you have chosen the various state configurations.
Case Options
Case Options are only available if Case Management is configured for Sentinel.
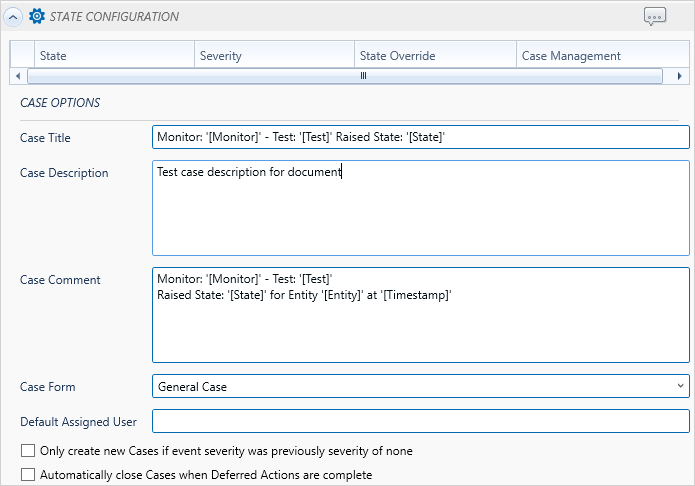
- The Case Title uses the default Case Title as set up in the Sentinel configuration file. You can edit this title, just for the test. This title is used for all cases raised from this test, and can contain tokens.
- The Case Description uses the default Case Description (set up in the Sentinel configuration file). You can edit this description, just for the test. This description is used for all cases raised from this test, and can contain tokens.
- The Case Comment uses the default Case Comment (set up in the Sentinel configuration file). You can edit this comment, just for the test. This comment is used for all cases raised from this test, except for where comments are overridden for a particular state. The case comment can include tokens.
- The Case Form uses the default General Case.
- Optionally select Only create new Cases if event state was previously severity of none.
If this option is selected, a case is only raised if the event state has had a severity of None since the last case was raised
- The Default state always has a severity of None.
- Other states can have their severity configured to None, Supressed, Low, Medium or High.
- Optionally select Automatically close Cases when Deferred Actions are complete.
If this option is selected and there are deferred actions, Sentinel carries out the deferred actions after a user confirms the case, then automatically closes the case. If there are no deferred actions set, Sentinel does not automatically close the case.
Auxiliary Data
You have the option to add auxiliary data to your test. This data is not monitored, but is saved with other event details when one of the test’s monitored assets raises an event.
Expand the Auxiliary Data Tokens ![]() panel of the test.
panel of the test.
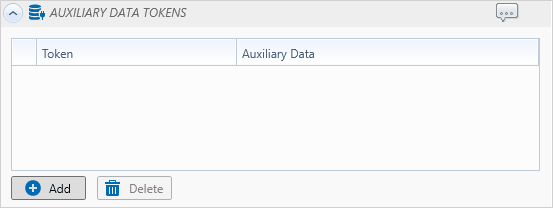
- Click Add.
- Type in a Token. This is the reference name for the metadata and must be unique within the test.
- Select the type of auxiliary data from the drop-down list, and the corresponding data:
| Type of data (from drop-down list) | Data |
| Fixed Value | Type in a fixed value. |
|
Attribute |
|
|
Calculation |
If the source type is Entity or Hierarchy:
|
|
If the source type is Tag:
|
|
|
Tag |
|
|
Entity Attribute |
|
Note: If the process uses Raw as a sample method, select the Process Parameter Data / Aux Data checkbox and choose a sample method.
Assign Actions to Tests
Actions can be assigned to a test for various specified states. Within a monitor, all actions are available to all tests.
When you assign an action to a test, you need to select the following:
Name: The name, and the type of action (for example SMS), of the action used by the test.
State: The test must reach this state, for the action to be invoked. The default state for an action is Any. The other available states depend on which process is used by test. Note: You can assign multiple actions to a test.
When an event occurs, any actions defined for the new state are carried out. Because the actions can be configured to respond to particular states, actions can be prioritised.
Note: If Manage Case is selected for a state, and the Defer Actions check box is selected, the actions for this state are deferred until the case relating to this event is confirmed. If the case is rejected, the deferred actions won’t happen at all.
Case Management is only available in state configuration if it is enabled for Sentinel.
For example, Test 2 may have the following four actions assigned:
| Name | State | When this state is reached… |
| Action 1 (Email) | High Exceeded | Action 1 email is sent to Action 1 specified personnel. |
| Action 2 (SMS) | Any | Action 2 SMS is sent to Action 2 specified personnel. |
| Action 3 (Email) | Low Low Exceeded | Action 3 email is sent to Action 3 specified personnel. |
| Action 4 (Web Service) | Low Low Exceeded | Action 4 web service is called. |
In the Test page:
1. Expand the Actions ![]() panel, and then click Add.
panel, and then click Add.
Note: If there are no actions for this monitor, the Add button is unavailable.
A new action appears in the Action grid.
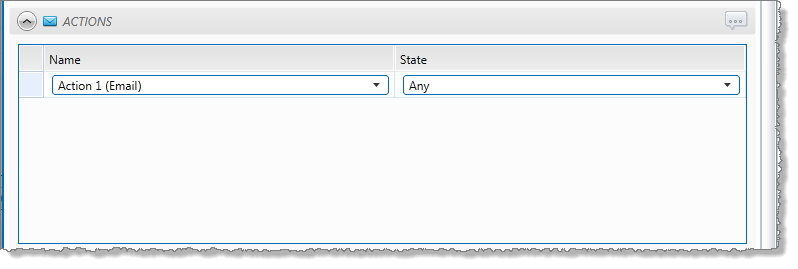
2. Select an action from the Name drop-down list in the grid.
All of the monitor actions are listed here. For each available action, the action name in this list is made up of the name and the action type; for example, an email action named “High Exceeded Notification” appears in the list as “High Exceeded Notification (Email)”, making it easier to identify the various actions available to the test.
3. Select a state from the State drop-down list. The default is Any.
All possible state outcomes for the test process are listed in the State drop-down list. You may, for example, select the “High Exceeded Notification (Email)” as an action for the High Exceeded State. In this setup, whenever the High Exceeded state is raised, the High Exceeded Notification email action is triggered.
Remove an Action from a Test:
- Click the action on the Actions grid.
- Click Delete.
The action is removed.
Save the Test
To save the test:
- Click OK in the lower right corner of the page.
The test is saved and is displayed in the grid, on the Tests ![]() panel of the monitor.
panel of the monitor.
Note: If Entity Volume (the number of entities allowed for the licence group for this process) is exceeded, then the test can be saved and approved, but will not run. Entity volume limits are explained in the Process section.