ON THIS PAGE:
New in this release:
- You can add a templated calculation to the trace table. See how this is done at the end of Step 2. Adding a Trace.
Overview
A trend displays time-series data, such as tags and attributes, as a line chart over a selected period of time.
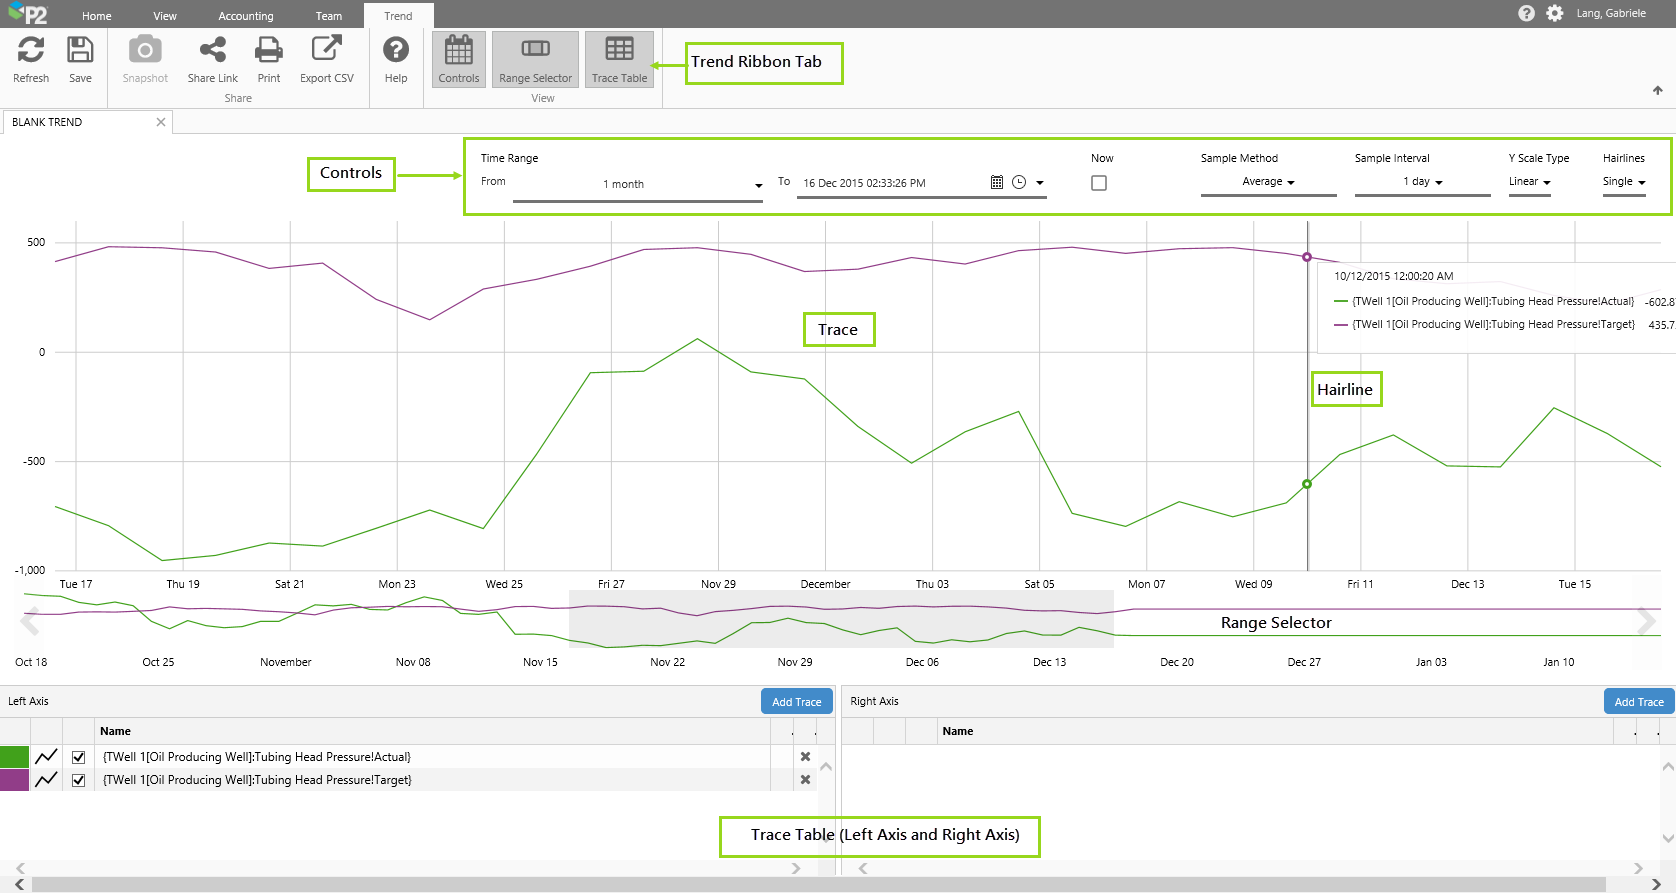
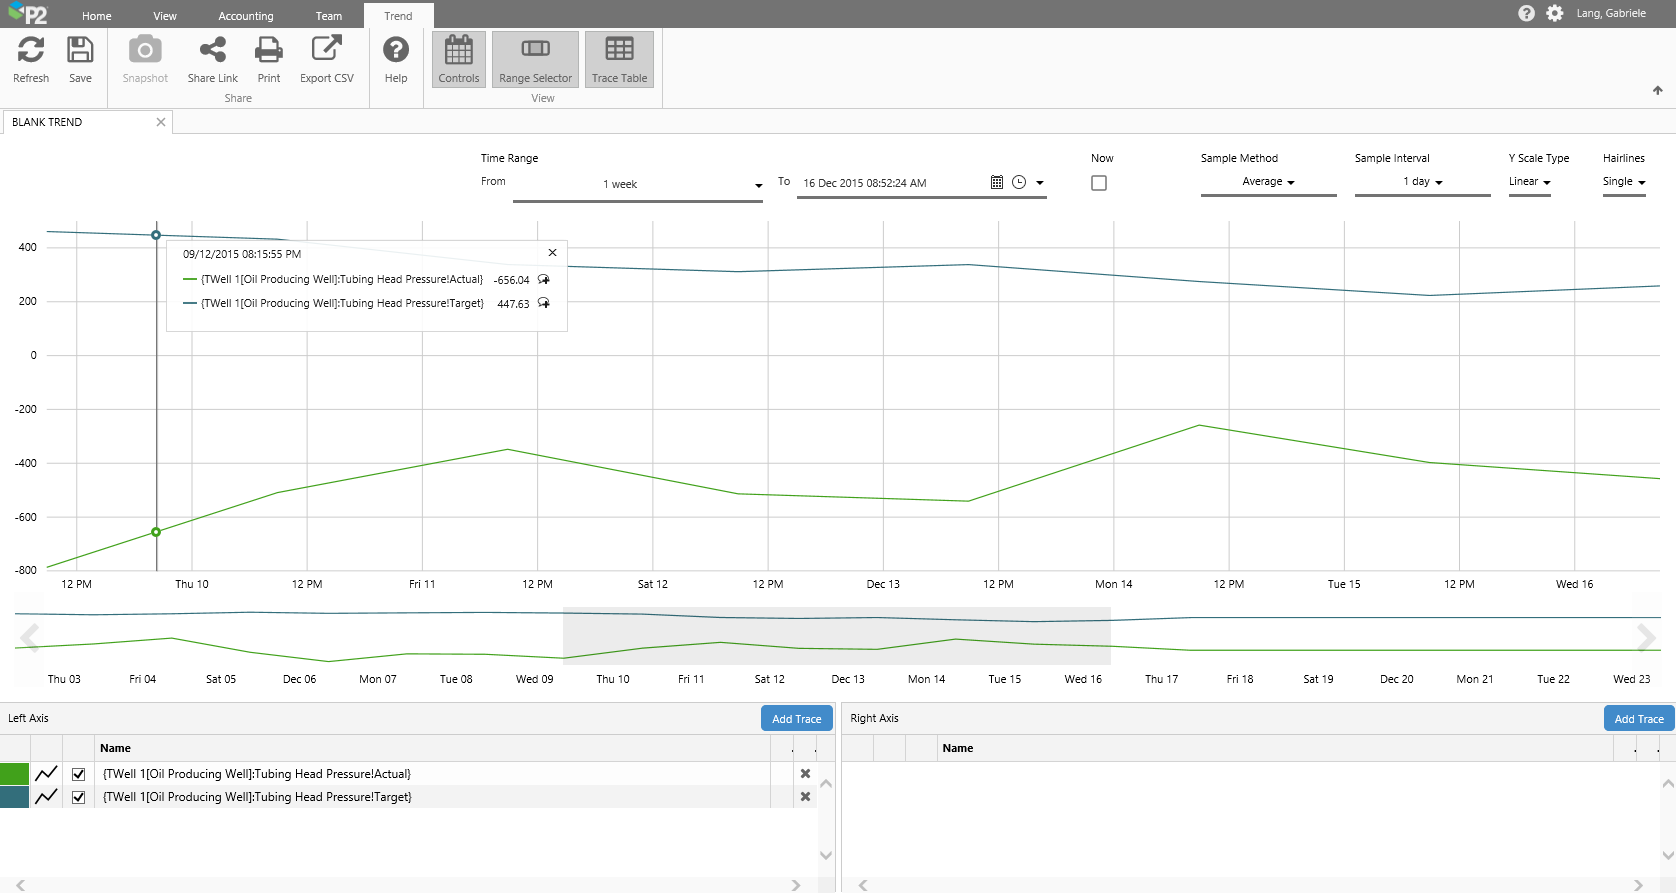
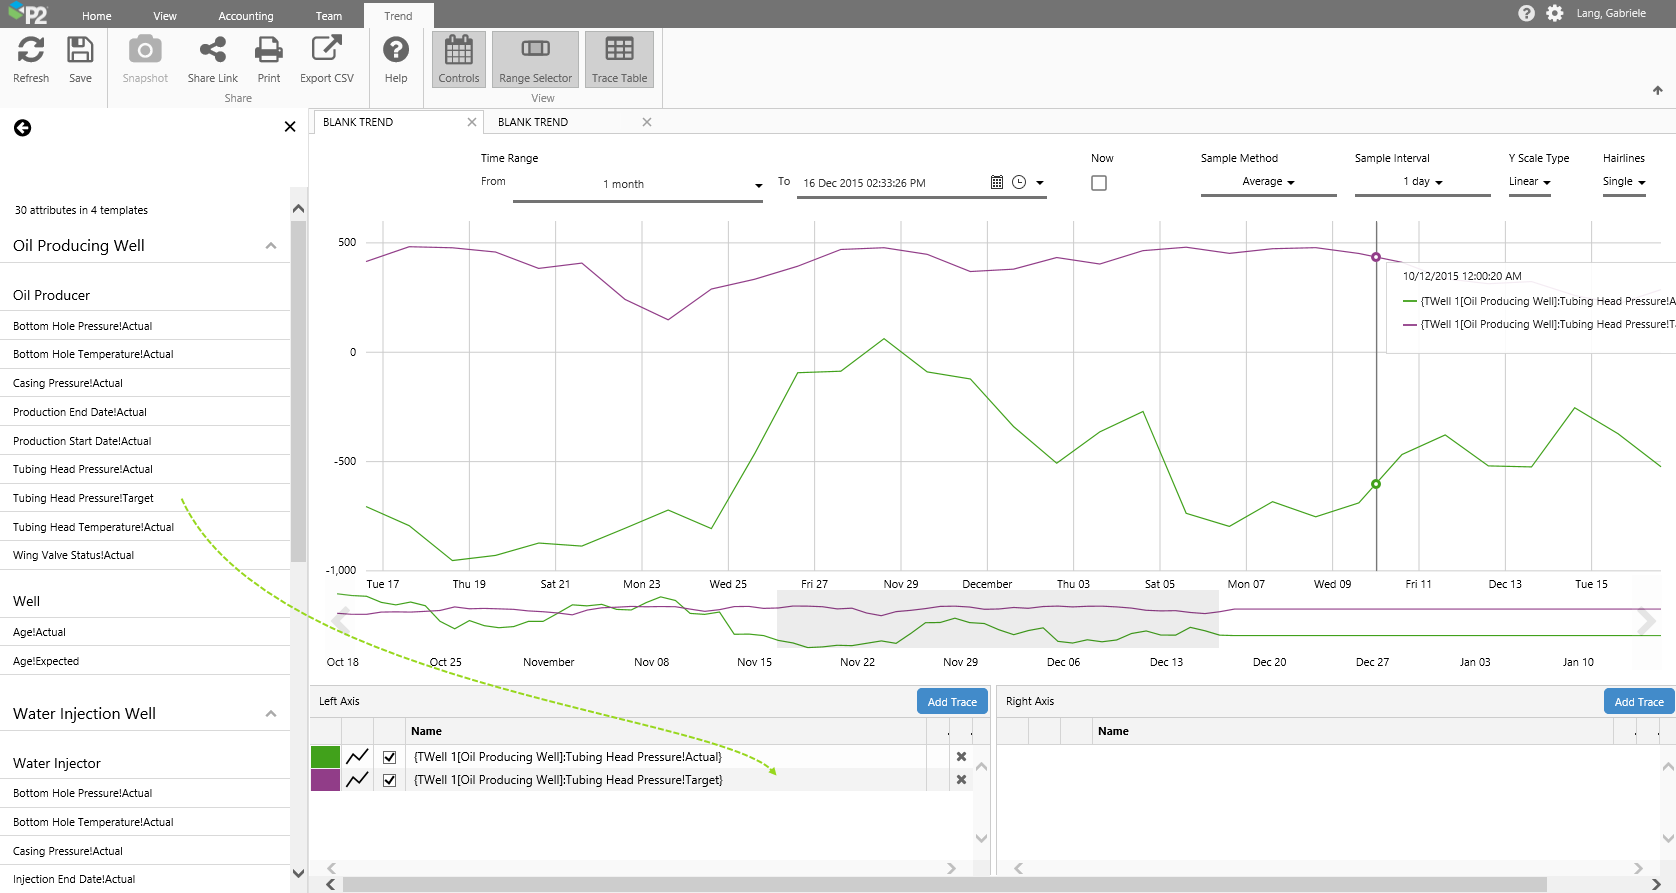
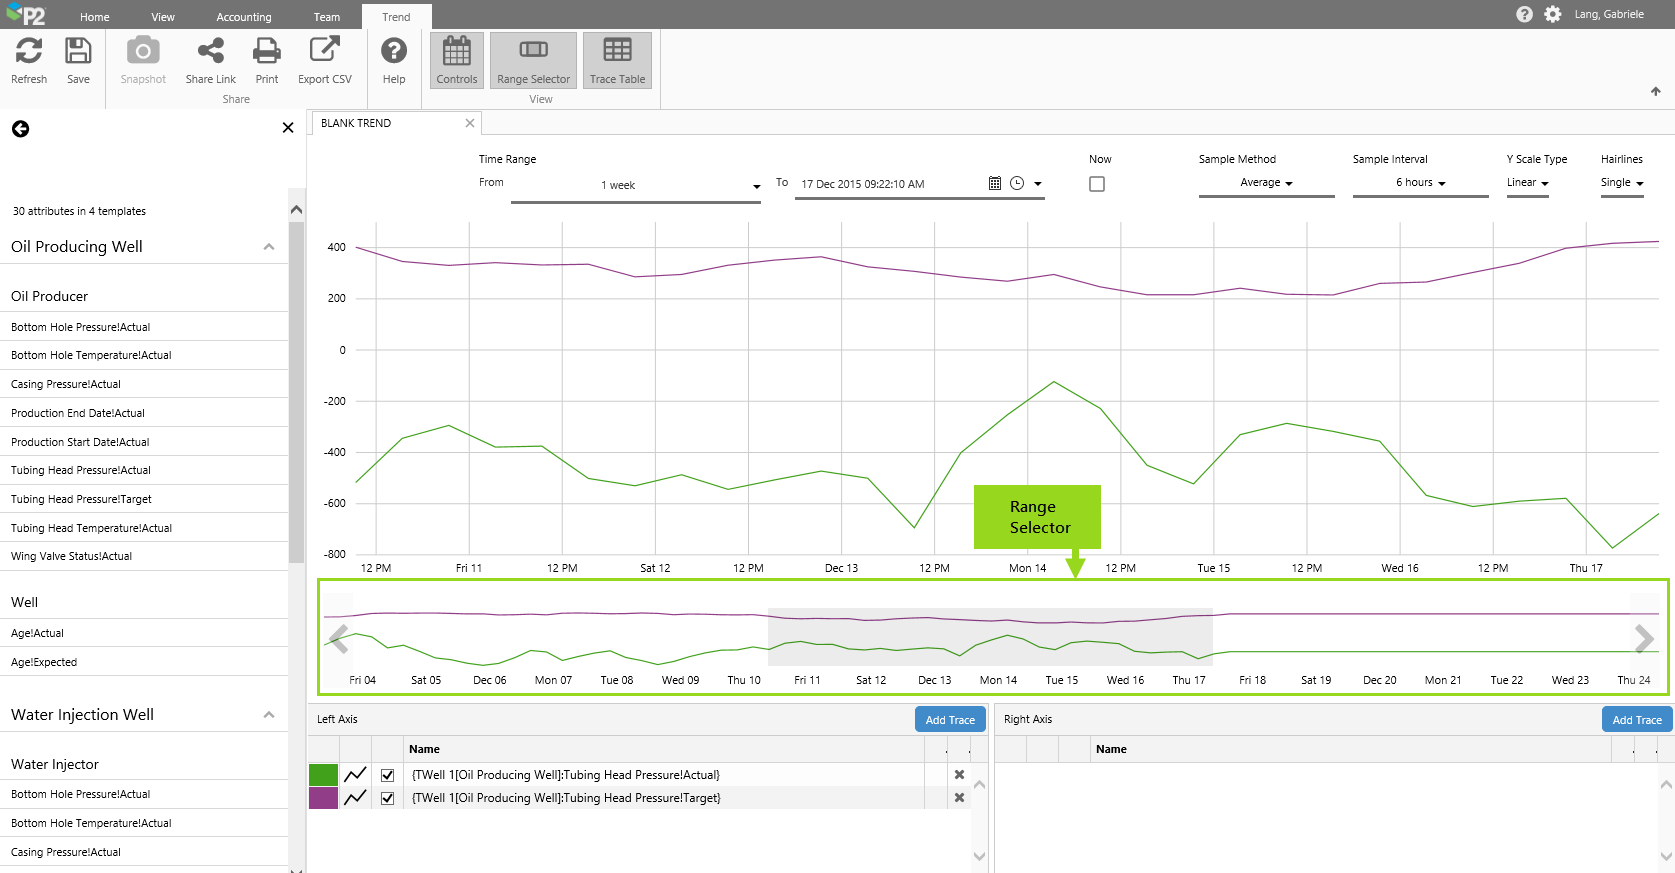
To create a trend, you need to open a new blank trend and then add tag or attribute data to this. The screenshot below shows a new trend, with two attributes:
| Trend Ribbon Tab | Use the buttons on this tab to refresh, save, or share the trend. (Refresh, Save, Snapshot, Share Link, Print, Export CSV) as well as a link to the online help (Help) and toggle buttons to show or hide elements of the Trend (Controls, Range Selector and Trace Table). | ||||||||||||
| Controls | The selections you make affect the time range of the chart, as well as how P2 Server fetches the data, and how the trace line is displayed. | ||||||||||||
|
|||||||||||||
| Trace | The trace displays time-series data, such as tags, over a period of time (Time Range). | ||||||||||||
| Range Selector | The highlighted section in the range selector matches the start and end of the trend time range. Use the range selector as a longer trend, to help identify highs and lows. You can select smaller periods within the range selector, to pick a new time range. | ||||||||||||
| Trace Tables | Drag and drop tags, attributes or attribute values into these tables (Left Axis and Right Axis) to include them in the trace. |
Show/Hide Trend Features
You change the trend view to allow more space for the trace lines.
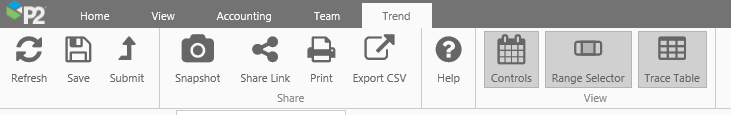
Click any of the buttons in the View section of the Trend ribbon, to hide the respective sections: Controls, Range Selector, Trace Table.
This is how the trend looks with all three areas hidden.
Click a button again to show the relevant section.
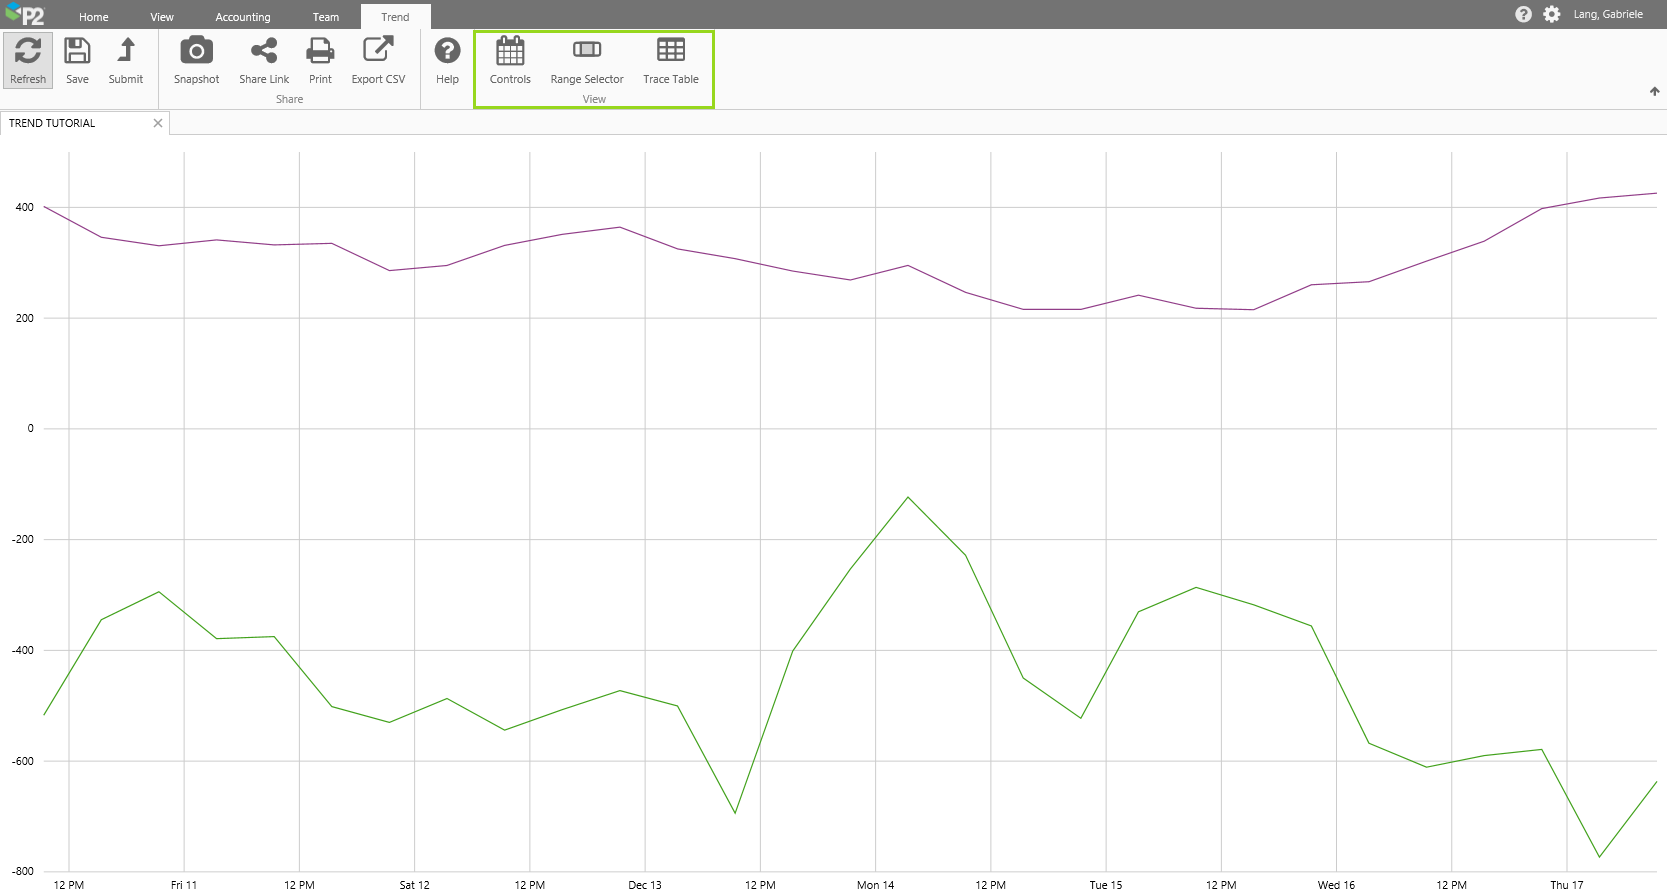
The Trace Table
The trace table is divided into a left axis and a right axis section, and lists all attributes, tags and calculations in the trace.
|
[imagemap id="21129"] |
Quick Reference:
| Data items here have a left axis. You can drag a data item to the Right Axis table to give it a right axis. | This is the trace data, and could be a tag or attribute name, with or without a calculation, or it could even be a fixed number, such as 99. | ||
| You can click this button if you want to add a new trace by typing in a tag or attribute name. | Any issues with the data or the data fetch are indicated by this error icon. Hover over the icon to see warning details. | ||
| To change the Trace Colour, click and select one from the colour wheel. | To remove the trace from this trend, click the Remove button. | ||
| To change the Trace Style, click and select one from the styles wheel (e.g. choose dot). | You can edit or add new trace data by typing in this box. Attributes and tags must be enclosed by curly braces{}. | ||
| To hide the trace, de-select this box. |
Tutorial
In this tutorial we’ll add a new trend, and then drop some attributes into the Tags List, to create a trace. We'll then experiment with features of the resulting trend.
Drop values onto the trend
Follow the step-by-step instructions, below.
Step by Step: Adding a New Trend
First we'll open a new trend and put some data on there. Next, we'll experiment with changing selections and using the range selector, and then we'll add a hairline with comments. Next, we'll save the trend. And finally, we'll locate and open the saved trend.
You will need to search for attributes or tags within your own environment, to follow this exercise.
Step 1. Adding a New Trend
Open the Home tab on the Explorer ribbon, and click New Trend.
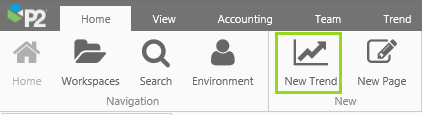
A new Blank Trend opens in Explorer, with the following defaults:
|
||||||||||||
|
|
Note that the Page tab on the ribbon is replaced by the Trend tab.
Step 2. Adding a Trace
To trend an attribute or tag, you can either drag it onto the trace (where it's automatically added to the Left Axis) or drag it onto the trace table (Left Axis or Right Axis) - or you can click Add Trace on the trace table (Left Axis or Right Axis), and type in a tag or attribute name, surrounded by curly braces {}.
Dragging an Attribute onto the Trend
To add an attribute to the Trend Table: Open the hierarchy navigator, select a hierarchy, then search for the attribute you want to trace and drag it onto the trend, or into the trace table. Follow the steps below:
1. Click the View tab on the Ribbon, then click Hierarchy.
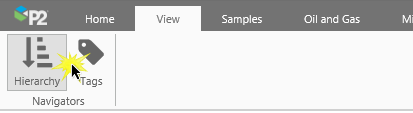
Click Hierarchy
2. Select a hierarchy from the drop-down list, navigate through the hierarchy to find your entity, and click the Attributes button to the right of that entity.
In our example tutorial, we select the Test Time Series Hierarchy, and navigate to the TWell1 entity: TOrganisation 1>TRegion 1>TArea 1>TField 1>TWell 1
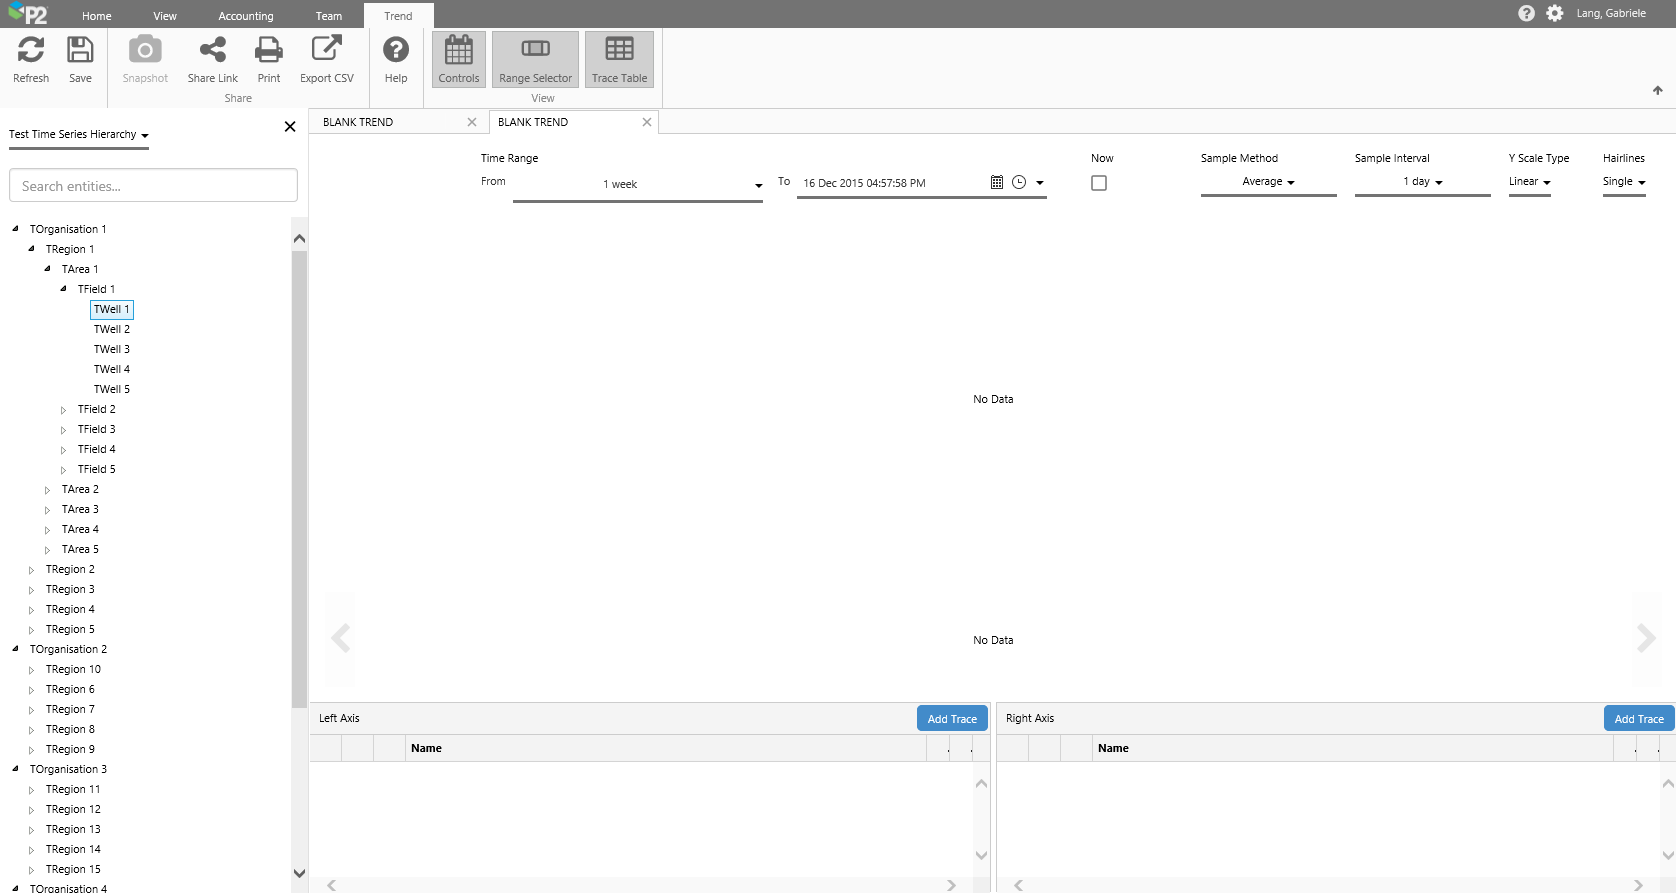
Search the Hierarchy
3. Select an attribute from one of the templates, and drag it onto the Trace Table. Now add another one in the same way.
The attributes used in our example tutorial are: TWell 1[Oil Producing Well]:Tubing Head Pressure!Actual and TWell 1[Oil Producing Well]:Tubing Head Pressure!Target.
Dropping a Tag into the Trace Table
1. Click Tags on the View tab.
2. Search for tags in the tags list that appears on a panel on the left. Drag and drop a tag onto the Tags List.
Typing Values into the Trace Table
You can type a known tag name or attribute name surrounded by curly brackets {}, for example: {silver} in the Tags List, and then press enter.
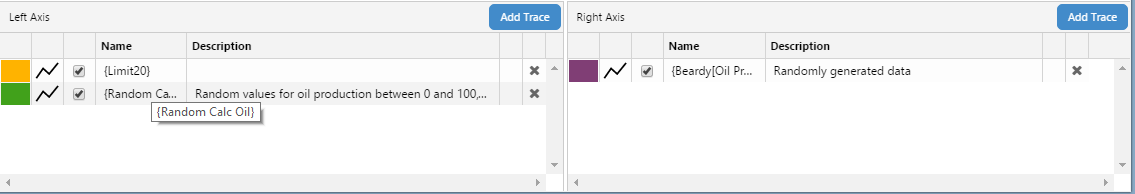
Calculations in the Trace Table
You can also type in a calculation, with the tag or attribute also surrounded by curly brackets {}, for example: {TWell 1:Tubing Head Pressure} + 20, or add a calculation to to an attribute or tag that you dragged onto the trend, by editing the value in the Trace Table.
Note that the attribute in this list only requires the entity name and attribute name (primary template and default attribute value are implicit values, but can optionally be added anyway).
Templated Calculations in the Trace Table
This variation of a calculation uses the entity keyword. The entity here is replaced by the entity clicked on the hierarchy navigator.
If the selected entity uses the attribute value within the calculation, then that value is plotted on the trace line.
Syntax: Subsitute the actual entity name with the keyword entity, for any calculation that uses and entity. For example: {entity[Oil Producing Well]:Tubing Head Pressure!Actual} + 20
Or leave out the template and the attribute value definition. For example: {entity:Tubing Head Pressure} + 20
Note: You need to click on an entity iin the hiearchy editor in order for this to work. It must be an entity that uses the attribute value in the templated calculation definition.
Step 3. Using the Trend Controls
In this step, we'll experiment with changing the Time Range, we'll select Now, we'll update the Sample Method and Sample Interval, the Y Scale Type and the number of Hairlines. Note that the selections affect how much data is returned, thus affecting the time taken to render the trend.
Step 3.1. Changing the Time Range
The defaults are: From 1 week to current date and time
Select 3 months from the Time Range drop-down list. Note how the trend range now extends for three months.
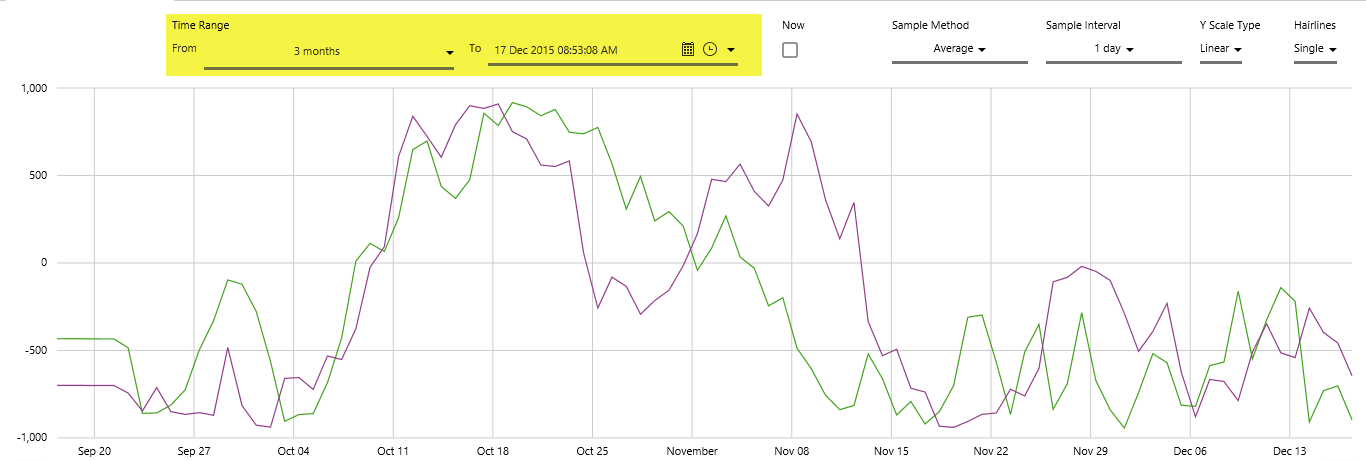
A Trend Spanning 3 Months
Note: If you select a long time range (such as three months or longer) there will be a lot of data returned, which will take longer than if you select a short range, such as 1 week.
Step 3.2. Selecting Now
By default Now is not selected.
Select the Now checkbox.
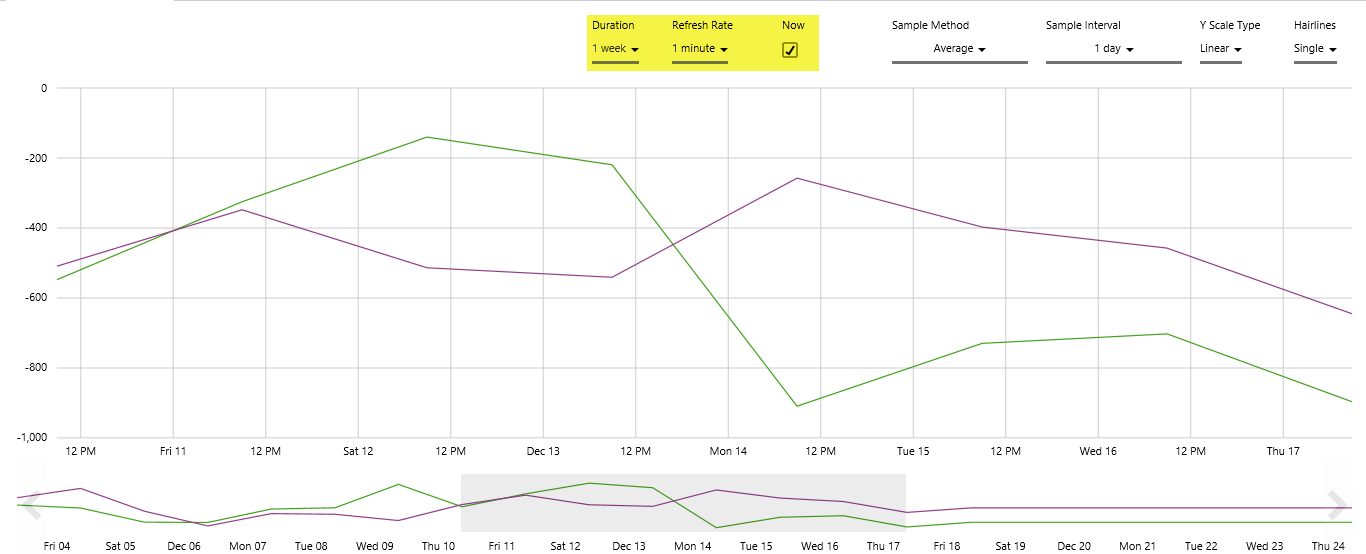
A Trend Spanning 1 week to Now, Refreshed every 1 minute
Note: The time range is replaced by Duration and Refresh Rate.
Duration is the time leading up to current date and time. Select a Refresh Rate; this sets the rate at which Explorer refreshes the data as time moves forward, each time getting the current date and time for 'Now'.
Step 3.3. Changing the Sample Method
The default is: Average
Select Linear Interpolate from the Sample Method drop-down list.
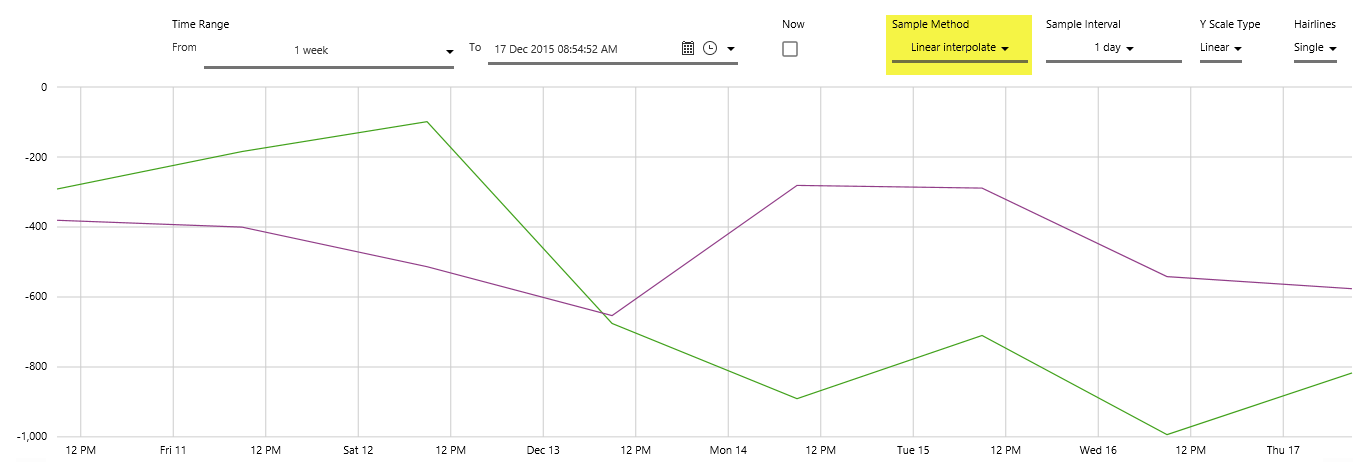
Trend with Linear Interpolate Sample Method
Note: Raw sample method will usually return the highest number of data points, potentially affecting performance.
Step 3.4. Changing the Sample Interval
The default is: 1 day
Select 2 weeks from the Sample Interval drop-down list.
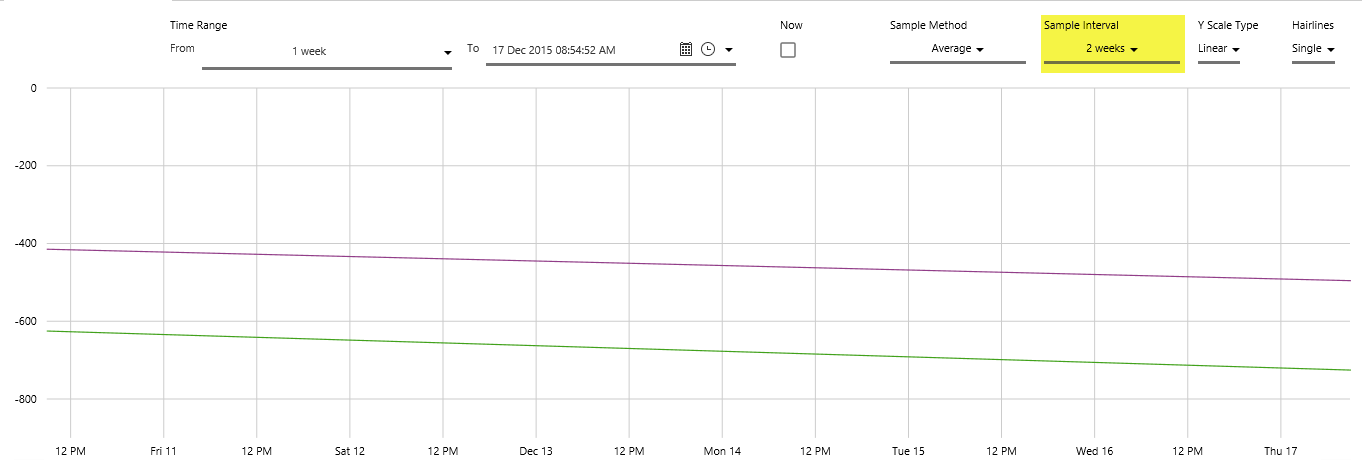
Trend with 2 Weeks Sample Interval
Note: The shorter your interval (for example 5 seconds) the more data required, potentially affecting performance.
Step 3.5. Changing the Y Scale Type
The default is: Linear
Select Log from the Y Scale Type drop-down list.
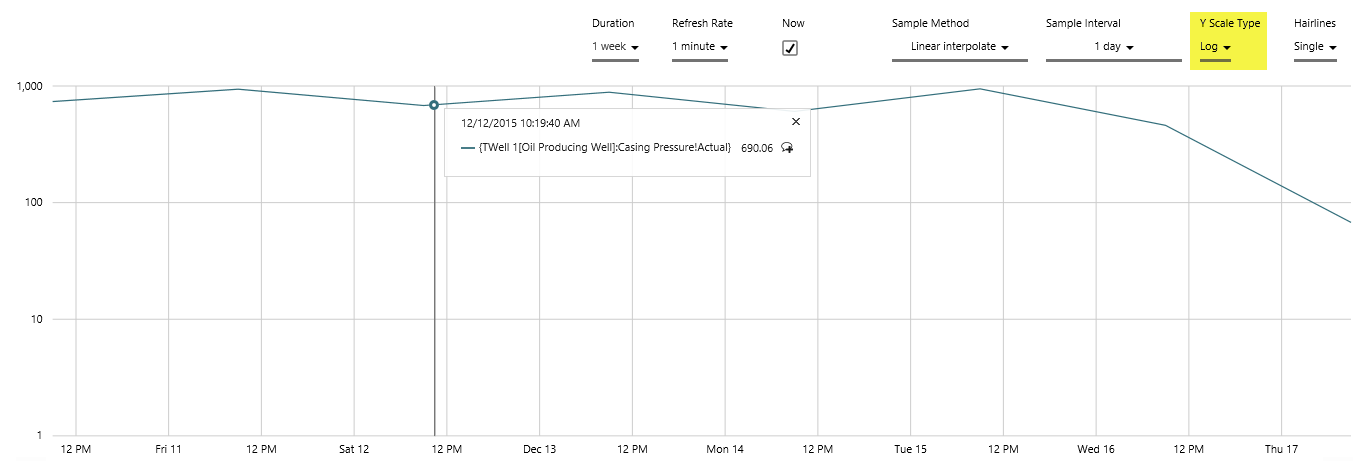
Trend with a Y Scale Type of Log
Note: Negative or zero values cannot render in the logarithmic scale type.
Step 3.6. Changing the Hairlines
The default is: Single
Select Dual from the Hairlines drop-down list.
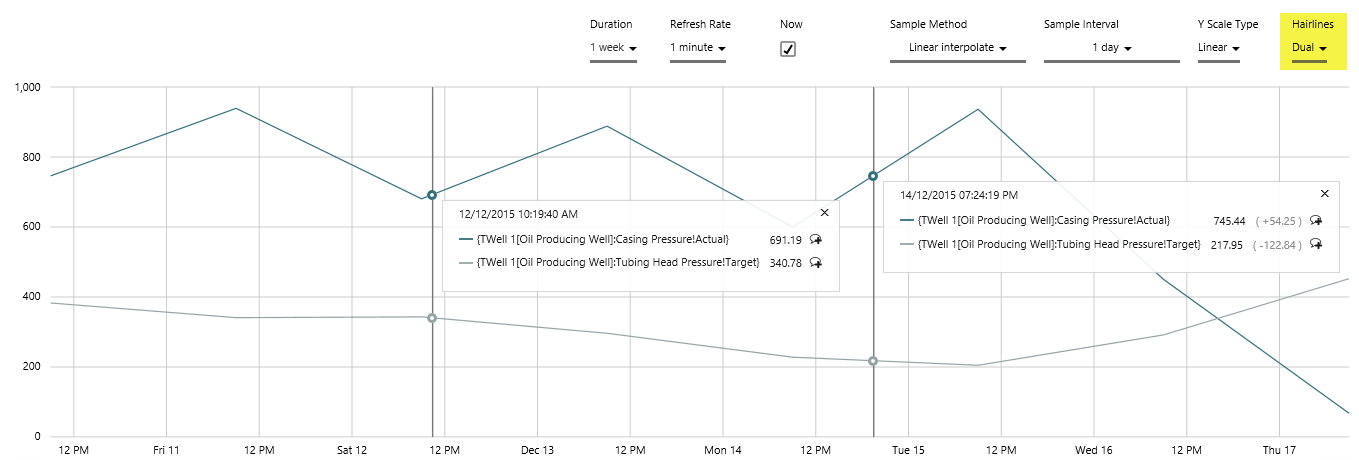
Trend with Dual Hairlines
Note: You can now add two hairlines to the trend.
Note: Other options are None and Multiple (which allows you to add up to five hairlines).
Step 4. Changing your Time Selection with the Range Selector
The Range Selector, found below the Trace, works together with the Time Range selectors to set your trend time range. By default, the range selector has a highlighted section that matches the time range set by the date pickers, with an equal amount of time shown before and after.
The Trend Range Selector
Resizing the highlighted section
1. Hover the mouse over the left or right edge of the highlighted section, until you see the mouse horizontal resize pointer.
2. Now click and drag to left or right. Note how the trend start and end time changes.
Moving the highlighted section
1. Hover the mouse over the central portion of the highlighted section, until you see the mouse move pointer.
2. Now click and drag the whole highlighted section to left (earlier) or right (later). Note how the trend start and end time changes.
Changing the Range Selector start and end dates
Click on the left or right arrow to move the start and end date of the range selector. Note that the dates on the highlighted section do not change; the highlighted section just moves across (to left or right) in relation to the changing start and end dates of the range selector.

Moving the Trend Range Selector Start and End dates
Step 5. Adding a Hairline and Comments
Add a hairline to view values (if any) for all trended tags at a particular point in time. You can leave a comment for a trended tag at the hairline point, or view and reply to other comments.
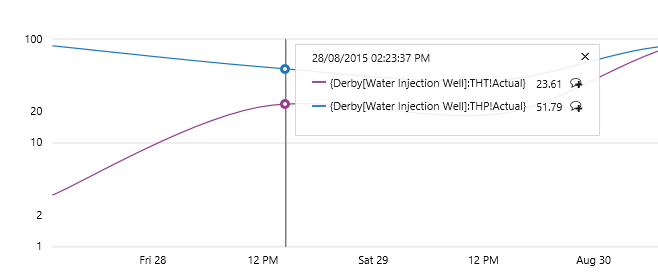
Trend Hairline
New Hairline
Click a point on the trace to get a hairline, a vertical line marking out this time, with an information box to the side.
To remove the hairline, close information box (click X on the top right corner).
To move the hairline, either drag it along the trace, or add a click another point on the trace.
Hairline Information
The Date and Time is displayed at the top of the information box.
Each tag is identified by its trace legend and its full name. The tag value (if any) is displayed to the right, followed by a comment icon.
Adding a Comment
To add or view comments, click the comment icon for a tag. See below for more on comments.
Step 6. Adding, Viewing and Replying to Comments on a Trend Tag
Comments can be added to tags on a trend. You can reply to comments, locate comments on a trace, and even search for a range of comments by changing the search times in a comment window for a particular tag. All tag comments within the range are listed in the comment window, in order of most recent
Note that you cannot remove comments.
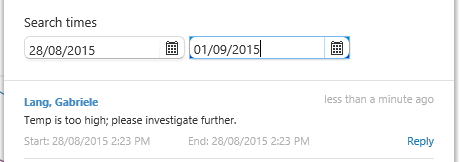
Tag Comment Search Times
Step 6.1. Adding a Comment
1. Click the comment icon on the hairline information box, to open a blank comment window.
2. Type in a comment, then click Add.
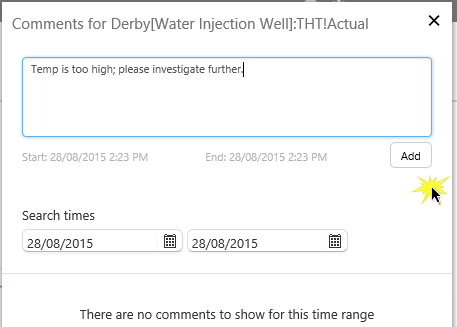
Add a Comment
Step 6.2. Replying to Comment
Comments are indicated on the trace by a vertical, dotted line.
1. Click the comment icon to open the comment window. (You can click the comment icon again to close the comment window.)
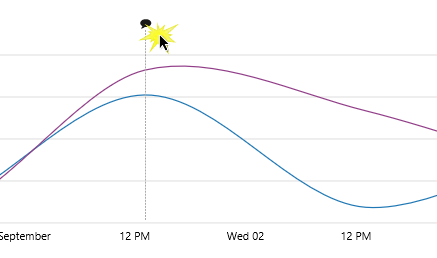
Locate and Open the Comment
2. In the comment window, click reply, then type in a response and click Add.
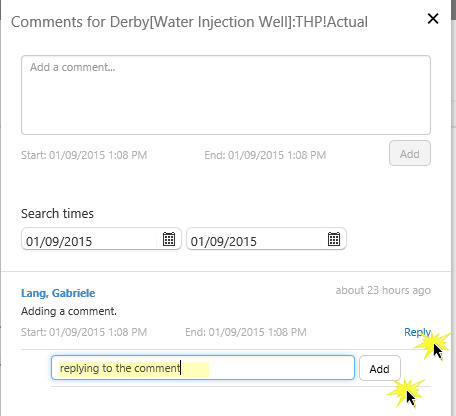
Reply to the Comment
Step 7. Saving Your Trend
Open the Trend tab on the Explorer ribbon, and click Save.
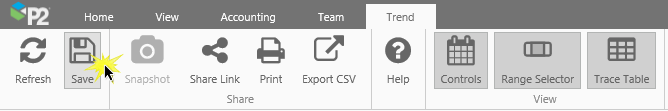
Click Save on the Trend Ribbon
The Save Trend window opens. Type in a Name for your trend, and save to My Workspace or select a Workspace from the drop-down list.
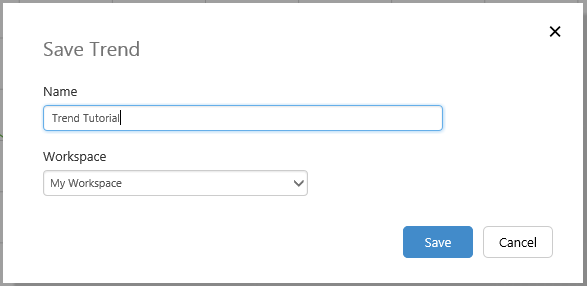
Save Trend
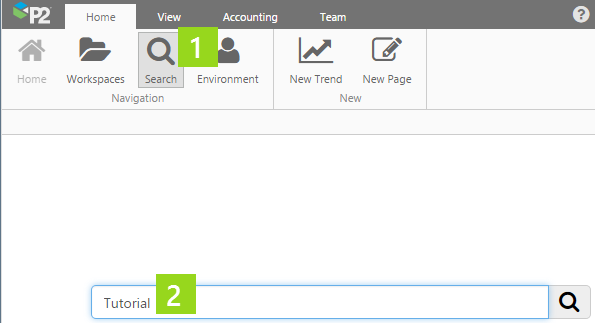
Step 8. Search for a Trend
Now that you have created and saved your trend, here is how you can find it again:
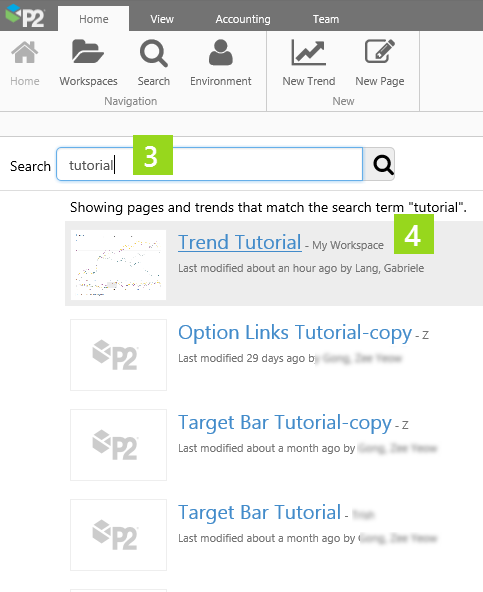
Searching for a Trend by Name
| Search button on the Home ribbon | Search results are listed in the Search Panel | ||||||||
|
|
|
||||||||
|
|
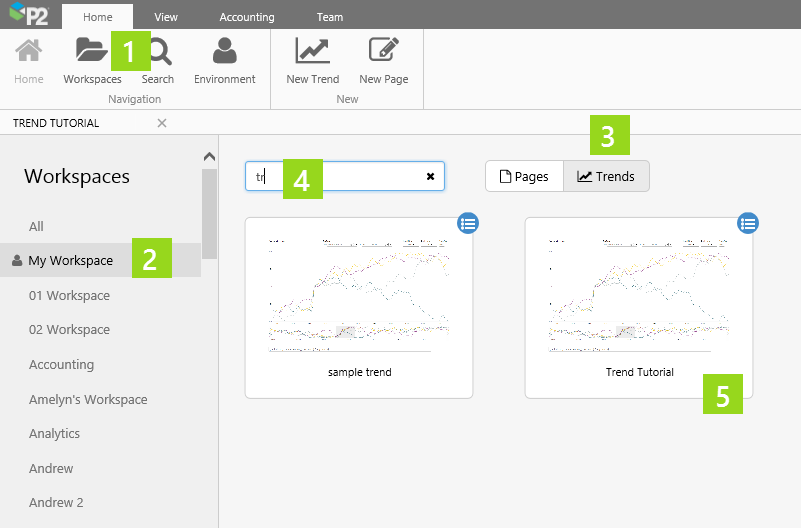
Searching for a Trend in a Workspace
Here is an alternative way of finding your trend.
|
|
|
Release History
- Creating a Trend 4.4.5 (this release):
- You can add a templated calculation to the trace table.
- Creating a Trend 4.4.4:
- The trace table now includes a description for tags and attribute values.
- Hover over a name or description in the trace table to see the full name/description in a tooltip.
- Creating a Trend 4.3.2:
- Auto-refresh to 'Now'
- Show/Hide Trend controls
- Trace Table split into Left Y Axis and Right Y Axis
- Multiple hairlines available
- Creating a Trend 4.3.1