ON THIS PAGE:
The Diagnostics page, available to Explorer Administrators, displays key diagnostics for helping to debug Explorer support issues.
Use this page if:
- Explorer becomes unresponsive for a number of users
- Shift Log is displaying entries in an unusual way
- Comments are not appearing
- Shift Log Entries Not Updating in the Table Until the Workbook is Closed and Reopened
- Search Box is Missing from the Explorer Ribbon
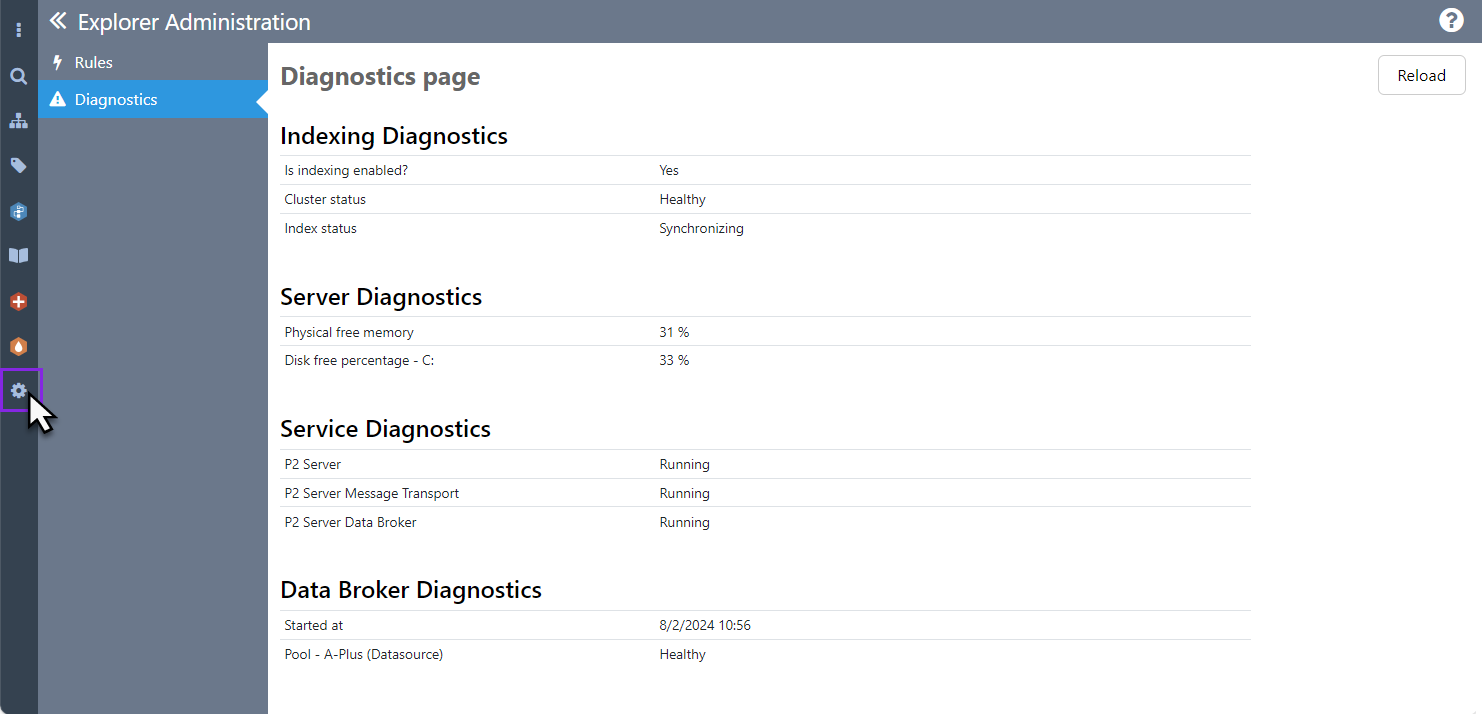
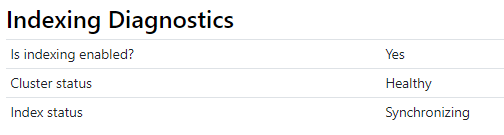
Indexing Diagnostics
In Explorer, indexing is used to improve performance when displaying entries and comments.
Entries are used in Case Management, Shift Log, and A-Plus.
Comments include commentary on an entry, and also comments in trends, pages, and the Info Zone.
If entries and comments are not showing correctly, this is often because something is happening with the index, such as the index being disabled, or an index rebuild is in progress.
The following key metrics are collected.
Is indexing enabled
If indexing is enabled, other metrics will be displayed.
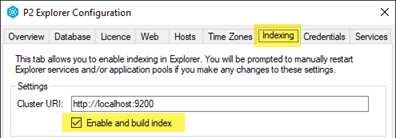
If indexing is not turned on, open the Explorer Configuration tool on the server, and on the Indexing tab:
- Check that the Cluster URI is correct. This should be available from your network administrator.
- Select the Enable and build index check box.
The time taken to build an index depends on the amount of data in the system, and full results may take half an hour or more to appear.
Cluster Status
Cluster status refers to the status of the server on which ElasticSearch is installed, and which hosts the cluster used by Explorer. If indexing is enabled, the status results will be one of the following:
| OfflineOrUnreachable |
The cluster might be inoperational or not configured. Actions:
|
| Unhealthy |
ElasticSearch diagnostics is reporting that there could be errors within the Cluster on the Elastic server. Actions:
|
| Healthy |
The cluster is reachable and the indexes are healthy with no known errors. No action is required. Note: On non-production instances, some data might be missing or inconsistent, as usually happens when a database has been restored but the indexes were not rebuilt. If this is the case, rebuild the indexes. |
Index Status
Index status refers to the indexing manager in Explorer which connects to the cluster in order to synchronize the index. If indexing is enabled, the status results will be one of the following:
| Inactive |
The index manager is not active. This usually means that the Index Manager services has stopped and therefore the indexes will be out of date. Actions:
|
| Connected |
The index manager is connected to Elastic Server, however Explorer does not yet know the status of the index. This is usually seen upon installation, until the initial index is built, or if the Elastic service is turned off. Actions:
|
| Rebuilding |
The index is in the process of being built or rebuilt. When a rebuild is triggered, indexing will not start until all IFS OI Explorer services are restarted. Case Management and Shift Log will not show the complete set of entries until indexing has been completed. Note: If an environment has a large number of entries, full results may not appear for half an hour or more. Actions:
|
| Synchronizing |
Synchronization is active. The index has been built and is working as expected. The index manager will continue to update the index in the background. No action is required. |
| Error |
The index manager has encountered an error that cannot be automatically handled. Actions:
|
Server Diagnostics
Displays free physical memory as a percentage, and disk space free for each drive as a percentage. Minimum required resourcing for IFS OI Explorer and associated modules is described in detail in the Explorer Installation Guide.

Memory Requirements
The memory required on the IFS OI Server to successfully run IFS OI Explorer and associated modules depends on the number of Active Users, which can be found on the Licence Audit page. RAM requirements are as follows:
| <15 Active Users | 15-50 Active Users | >50 Active Users | |
| Without ElasticSearch | 16 GB+ | 20 GB+ | 32 GB+ |
| With ElasticSearch | 24 GB+ | 28 GB+ | 48 GB+ |
Note: If ElasticSearch is used, allow a minimum of an additional 8 GB of RAM. For large Shift Log installations, an additional 16 GB+ is recommended.
When installing ElasticSearch, the JVM memory setting refers to the memory that Elasticsearch is reserving for itself, not the total memory that is available to the system. If you are noticing performance issues, then increasing this memory allocation may help.
Disk Space Requirements
Each component has the following initial (installation) and ongoing requirements for disk space for IFS OI Server, IFS OI Explorer, and IFS OI Sentinel combined:
| Component | Initial | Ongoing Data Store |
| Application | 50 MB | 250 MB |
| Database | 1.5 GB | 1 GB per 1000 monitors per year |
The items that impact database size include:
- Indexing
- Log files
- Imaging
- Backups
- Tags & Calculations
- Events
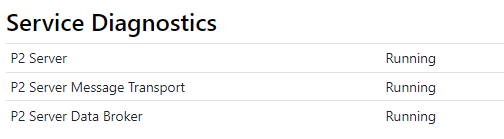
Service Diagnostics
Service diagnostics shows if each Explorer service is running or not. If a service is not running, it will affect the operation of IFS OI Explorer and associated modules.
If any of the services have stopped, then it will show an error message. Otherwise, it will show each service as running.
If a service has stopped, open the Explorer Configuration tool and restart it.
- If the IFS OI Server service will not start, check the Service Broker is enabled in the IFS OI Server database. In the Service Broker section, ensure Broker Enabled is set to True.
- If the Data Broker service will not start, check that all your adaptor dependencies have been installed. These are listed in the Software Prerequisites section of the Explorer Installation Guide.
- If you are trying to restart a service and see that it will not stop, open Task Manager and kill the service.
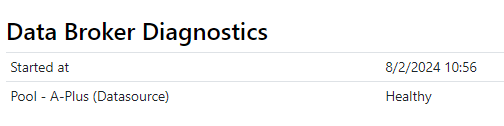
Data Broker Diagnostics
This section checks that the Data Broker is functioning correctly.
- If the Data Broker is running, it will display the time the Data Broker was started, and the status of each Adaptor Pool.
- If the Data Broker is shut down, an error message will appear.
To get adaptor pools to appear, open trends or pages that use datasources.
Adaptor pools are displayed in the format: Pool - {datasource name} {type} and can have the following statuses:
| Healthy | The Adaptor Pool is running normally. No action is required. |
| Locked |
Processing of the last request failed due to either the adaptor reporting that it failed, or an exception escaped the adaptor. This results in the adaptor becoming locked. After a few seconds, Explorer automatically tries to unlock the adaptor pool and reinitialize all the adaptors, in case the connection to the historian/database failed. This attempt to unlock will repeat every 5 seconds (or as otherwise configured). Actions:
|
| Permanently Locked |
Values in the Queue Manager tables for the datasource have been configured in such a way that has locked the adaptor pools, requiring manual intervention. Queue manager tables are used to prioritize requests differently based on configured criteria, so this state indicates an issue with the configuration. Actions:
|
Release History
- Diagnostics 4.15.0
- Initial version