ON THIS PAGE:
![]()
P2 Explorer 4.4 reinvents P2 Explorer into a prime data visualization tool. It uses new technologies to support cross-browser compatibility and new, sleeker visualizations. Content is key, allowing you to zoom in on and diagnose problem areas, so they can be addressed quickly and effectively.
In P2 Explorer 4.4, elements on a page can interact with other elements on the same page to drive dynamic, information-rich displays, while cross-referencing of data enables further comparison and analysis of related information. An approvals process also allows anyone to submit their own displays for publishing to a wider audience within the organisation.
What sets this version apart from previous releases is the focus on usability. The new data selector makes data-driven pages easier to design, and a set of predefined styles for selected components significantly improves the ability to customise displays.
Release 4.4.6 of P2 Explorer includes new features and enhancements for the Trend, the Studio editor and for component behaviour on Pages.
Note: P2 Server 4.4.6 is a prerequisite for P2 Explorer 4.4.6.
Trend Enhancements
The trend has had updates to the way in which its Y-Axes are displayed. There are also several updates to the Trace Table in this release. These features allow you to control how your trace lines are plotted against the vertical (Y) axes.
Trace Table Layout and Column Change
The Trace Table has been updated to include more information, with added functionality.
Single Trace Table
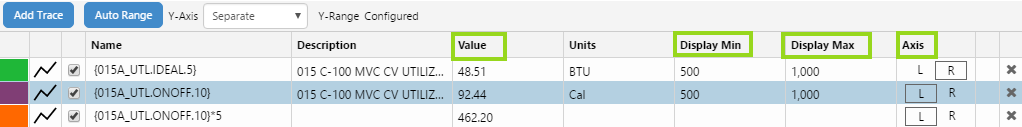
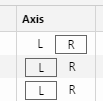
The separate Left Axis and Right Axis trace tables have been combined into a single, wider Trace Table, with the left and right axes (L and R) now selected by a toggle button, under the Axis column.
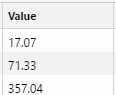
Value Column
The Trace Table now includes a Value column, showing the values for the respective items in the trace. If the trend has hairlines, then this is the current value from the latest hairline that was added or moved; otherwise, it is the current value from the end-time of the selected time range for the trend.
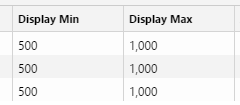
Display Min and Display Max Columns
‘Min’ and ‘Max’ columns have been renamed to ‘Display Min’ and ‘Display Max’ columns, respectively.
Determining the Y-Axis
There are several new features in this release that contribute to the way the Left and Right Y-Axis ranges are calculated and displayed, and how the different trace lines are plotted against them.
Manual Adjustments to Display Minimums and Maximums
Minimum and maximum display values for items in the trace table can now be edited, and saved with the trend.
Select Separate from the Y-Axis drop-down list, then edit individual Display Min and Display Max values in the Trace Table.
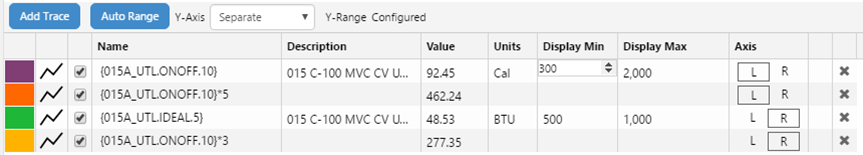
Note that this does not alter the tag's stored minimum and maximum.
Separate Y-Axis
In previous releases, all trace items with a Left Y-Axis were plotted against a single Left Y-Axis, while all trace items with a Right Y-Axis were plotted against a single Right Y-Axis.
In this release, you have the option of plotting each trace item against its own axis (Left or Right). Note that there is still only one rendered Y-Axis for Left, and one for Right.
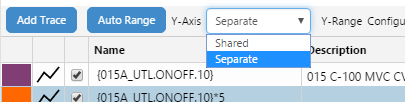
Separate
If you want each trace to be plotted against its own axis, select Separate from the Y-Axis drop-down list.
Note how the selected Left Y-Axis item is used in the Y-Axis, using the same colour
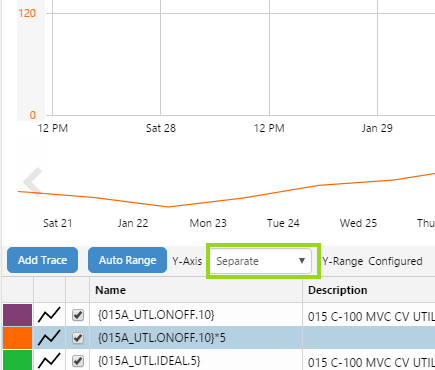
Selecting the Left and Right Y-Axes from the Trace Table
You can control the rendered Left and Right Y-Axes by clicking on one of each of these. If there are no selections, the first of each (Left/Right) is rendered.
Each Y-Axis (Left/Right) is rendered in the colours of its selected item.
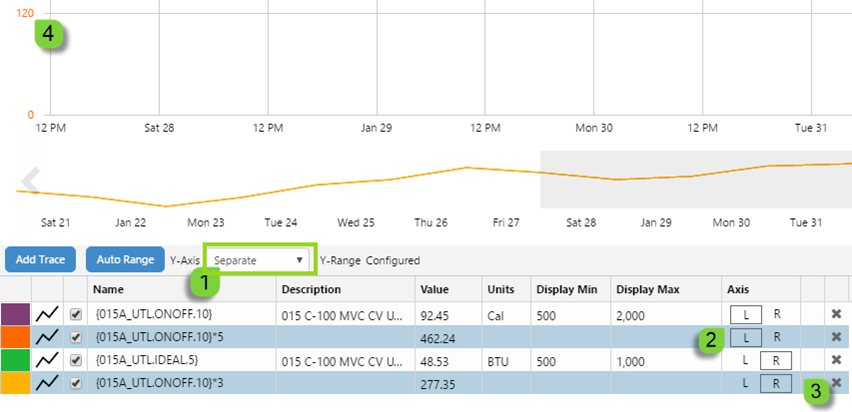
1: Separate Y-Axis option selected; 2: Selected Left Y-Axis item; 3: Selected Right Y-Axis Item; Note how the Left Y-Axis (4) is rendered in dark orange, the same colour as the selected Left Y-Axis item (2).
Shared
If you select Shared from the Y-Axis drop-down list, then all traces on the Left Y-Axis (L) are plotted against a single, shared Left Y-Axis, while all traces on the Right Y-Axis (R) are plotted against a single, shared Right Y-Axis.
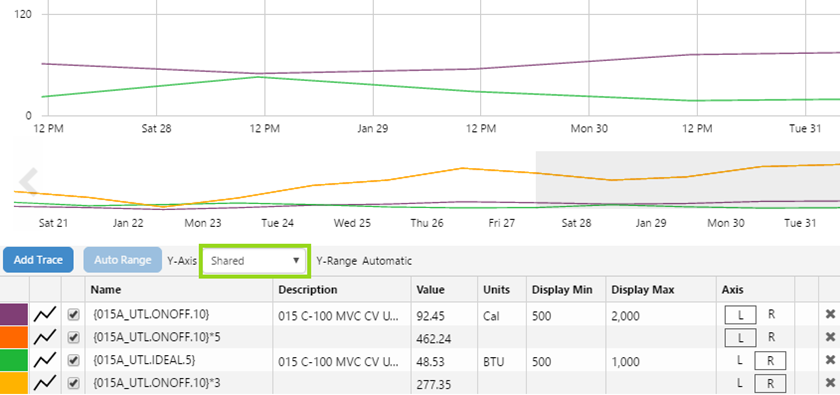
When there is a shared Y-Axis, the Left Y-Axis and the Right Y-Axis are both rendered in black.
Auto Range
Auto Range is a fast way for you to reset your display minimum and maximum values, so that all of your trace data points are visible on the trend.
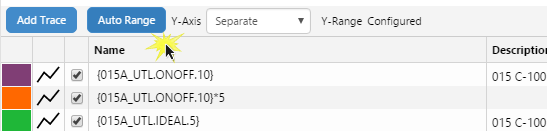
Auto Range is only available when Y-Axis is selected as Separate.
Auto Range calculates a new display minimum and display maximum for each item, based on the individual items’ data values for the selected time range, and plots the separate trends using the new minimums and maximums.
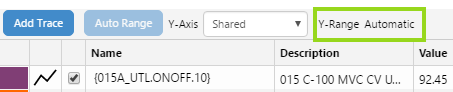
Note that shared traces (where Y-Axis is set to Shared) have the Y-Range automatically set using data values from all of the trace items.
Working with the New Features
The following rules dictate how the items are plotted, and how the Left and Right Y-Axes are determined:
| Separate Y-Axis | ||||||
| For the Separate Y-Axis configuration (the default setting for a new trend), the current Display Minimum and Display Maximum for each item is used to determine its Y-Axis. Each item is plotted against its own Y-Axis, but with only one Left Y-Axis and one Right Y-Axis displayed. | ||||||
|
||||||
| The selected Left Y-Axis item (or the first in the list, if there is no selection) and the selected Right Y-Axis (or the first in the list, if there is no selection), are used to render the Left Y-axis and Right Y-Axis, respectively. | ||||||
| Shared Y-Axis | ||||||
| For the Shared Y-Axis configuration, the shared Left Y-Axis and the shared Right Y-Axis are automatically determined using the collective minimum and maximum data values found in the selected Time Range for the various items. |
Zero in Log Scale Plots
If a trend includes data points of zero, then instead of showing an error for the Log Scale Type, Explorer plots a point that is close to zero, and displays this as zero.
Component Enhancements
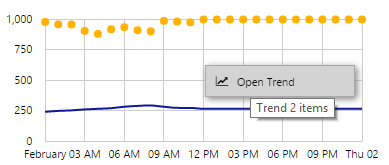
Open a Full Page Trend from a Chart
Right-click on a chart to open the context menu. If the chart contains time series data (such as tags, attribute values, or calculations) there is a menu option for opening these in a trend. Dataset data cannot be trended.
Chart series with user-defined colours will retain these colours in the trend. Line, area and dot series types will also be retained in the trend. Other styles, such as bar, default to a lines series.
Secondary Links in Table of Contents
An entity’s Table of Contents on the Explorer Ribbon displays links that belong to its templates.
In previous releases, only the links on the entity’s active primary template were displayed in the Table of Contents tab; in this release, links from other templates of the entity will also appear in the Table of Contents, unless configured not to.
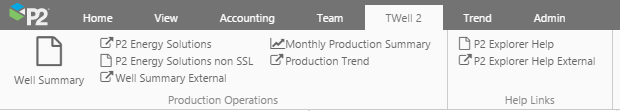
Table of Contents for the TWell 2 Entity
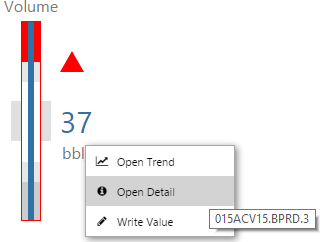
Context Menu on Components
Many of the page components now have a context menu for the main data item of the component (for example, the measured value in a temperature meter, or the actual value in a status indicator).
The right-click menu options (where applicable) are available to: open a trend for the item, open the detail page, or write to a tag (where allowed).
Here is the full list of components with the context menu.
| Data Label | Status Indicator | Target Bar | Target Variance Bar |
| TargetLabel | Bullet Graph | Status Tile | Meter |
| Gauge | Wind Vane | Tank | Chart |
Note: The data label had these menu options in earlier versions, but used a radial menu.
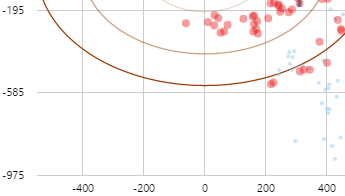
Performance Curve
The chart component has been enhanced to enable the configuration of a Performance Curve.
Studio Enhancements
Chart Series Data
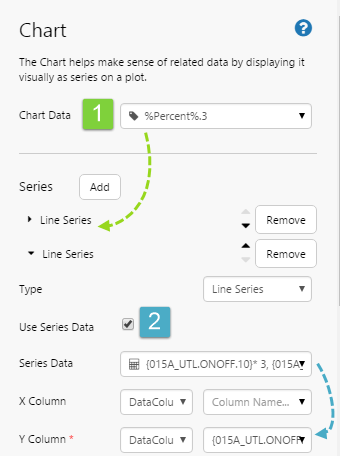
In previous versions of Explorer, chart data was defined for the whole chart, and each chart series used a data column from the chart’s dataset. In version 4.4.6, the chart has been enhanced so that each chart series can optionally use data from its own data source. In the diagram, the first series uses the data defined in Chart Data [1 in diagram], while the second series uses data from a separate Series Data source [2 in diagram].
Configuring the Chart
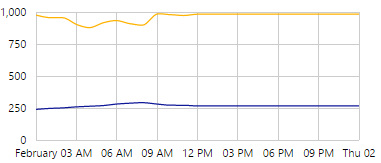
The chart in display mode
Note:This enhancement enables page designers to configure a Performance Curve, where the different series get their data from disparate sources.
Preconfigured Images
The component library has a new group called ‘Other’ which contains several preconfigured images. You can drag any one of these onto your page, and use it without having to configure it further.
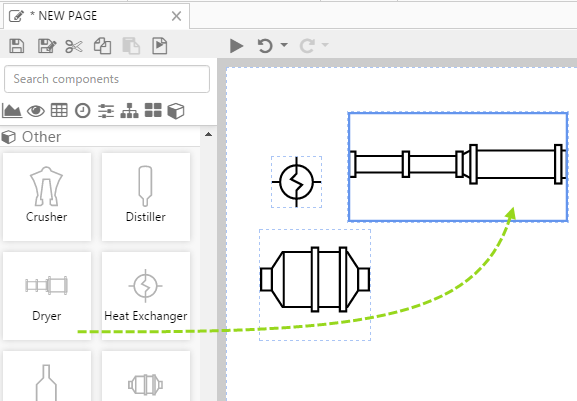
Image Component and the Image Gallery
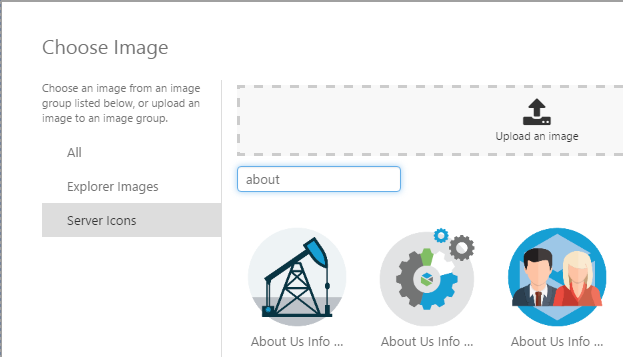
Prior to this release, you were only able to specify which image to use in an Image component by typing a URL into the text box, for an image that was already uploaded to a web site. In Explorer 4.4.6 you now have the option of browsing the P2 Server Management image gallery and either selecting one of these images or, if you have permissions, uploading a new image to one of the image groups and using that.
Search
Search has been enhanced so that the search page now opens in a new tab, every time you click the search button on the ribbon.
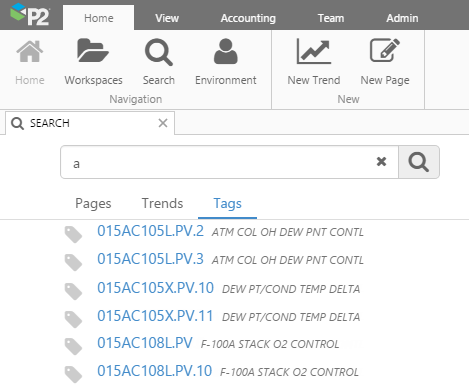
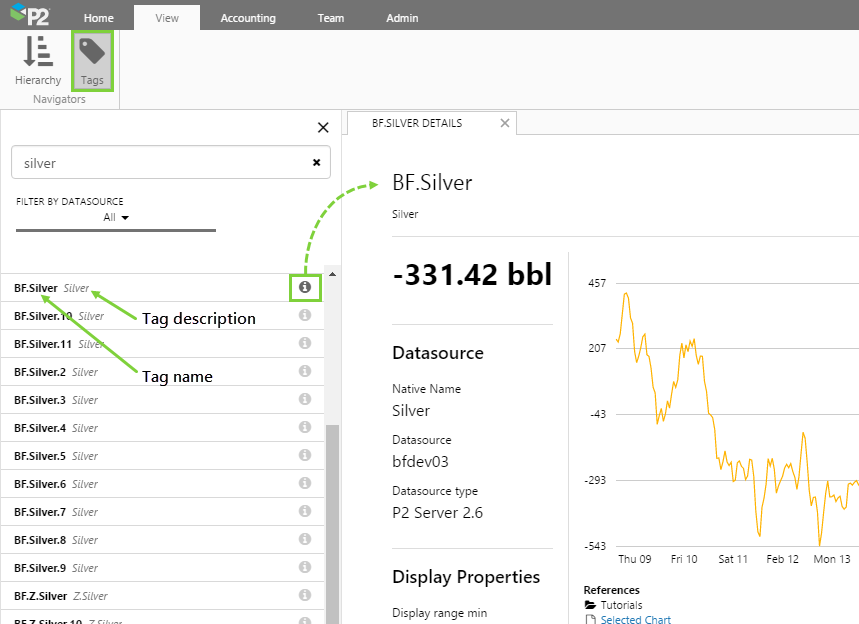
The Tags Navigator now shows the description next to the tag name, instead of the datasource. The tag’s description also now appears in the Tag tab of the Data Selector.
The new icon in the Tags Navigator, when clicked, opens the Point Detail for that tag.