Overview
The Tank displays a data value as the percentage fill in a tank shape.
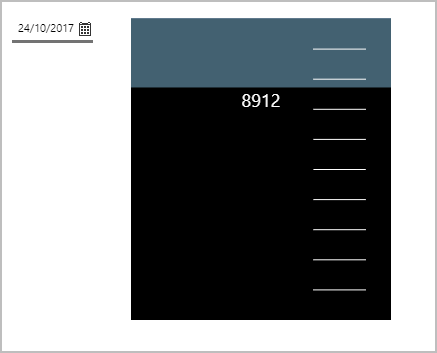
The following diagram shows a Tank being configured:

| Value: | The actual value that determines the amount that the tank is filled. |
| Minimum Value: | If the Value is below the Minimum Value, then the tank appears empty, and the Minimum Value is displayed instead of the Value. |
| Maximum Value: | The maximum value allowed for the fill. |
| Number of Ticks: | The number of tick marks to display on the tank. Explorer uses this as a guide for the actual number of tick marks so that they are evenly spaced between the Minimum Value and the Maximum Value. If this is blank, Explorer will still display tick marks. |
| Show Value: | Select this check box if you want to display the numerical value of the fill (or minimum value). |
| Decimals: | Use this to limit the decimal points for the displayed value. |
| View Mode: | When you add a new Tank shape to a page, its default View Mode is 2D. Select 3D for a three-dimensional tank. |
| Style: | You can apply a style to the Tank. If you are a Style Administrator, you can add a new Tank style. |
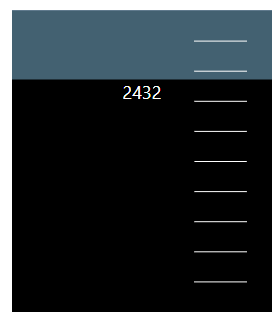
Note that the tank can be configured as a two-dimensional or a three-dimensional shape:
| A two-dimensional tank | A three-dimensional tank |
 |
 |
Tutorial: Configuring a Tank to Show Stored Oil
The Tank is a useful component to display volume levels. In this topic, we’ll show you how to use the Tank to display the volume of oil stored for a tag, with data that changes depending on the selected date. This is often used in production summary reports.

Note: This configuration uses the Sample Data tags that can optionally be made available during initial installation and setup. If you don't have access to this data, you will need to adjust the configuration to suit your data at your site.
Step 1. Prepare a Studio Page
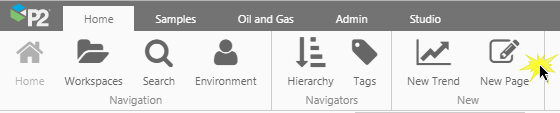
1. Click the New Page button on the Home tab of the ribbon.
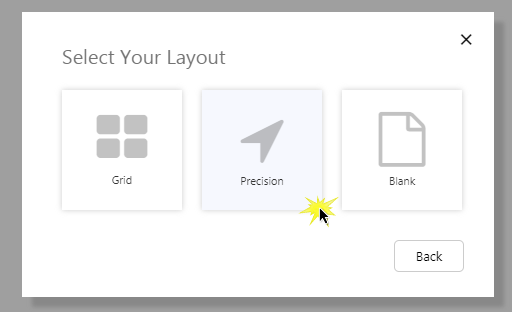
2. Choose the Precision layout.
Step 2. Add a Tank
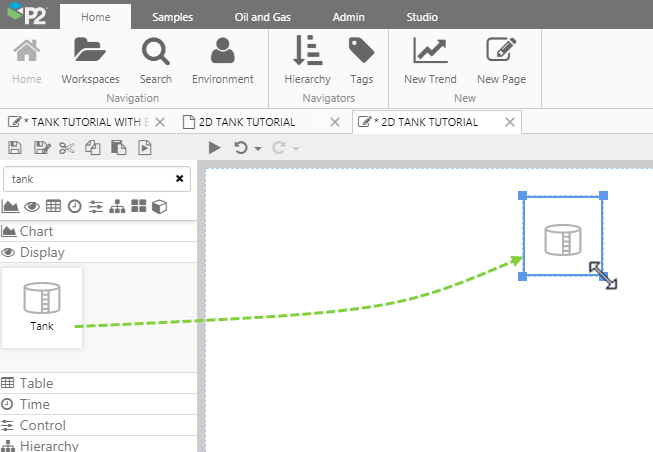
Drag and drop a Tank component onto the page, then resize by dragging on one of the corners. The Tank is in the Display ![]() group.
group.
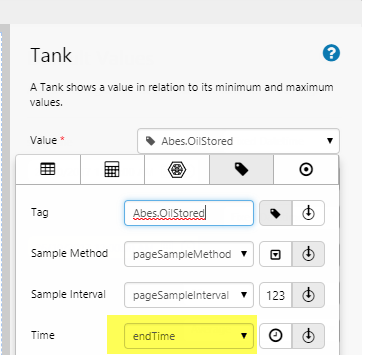
Step 3. Configure the Tank
In this example, we want the Tank to show us how much oil is stored for a tag, at a selected date.
Click the tank to open the component editor.
Configuring the Tank Properties:

|
Step 4. And a Date Picker
We'll use this to show how the tank shows a different level when a different date is selected.
Drag and drop a Date Picker component onto the page, next to the tank, then resize by dragging on one of the corners. The Date Picker is in the Time group.
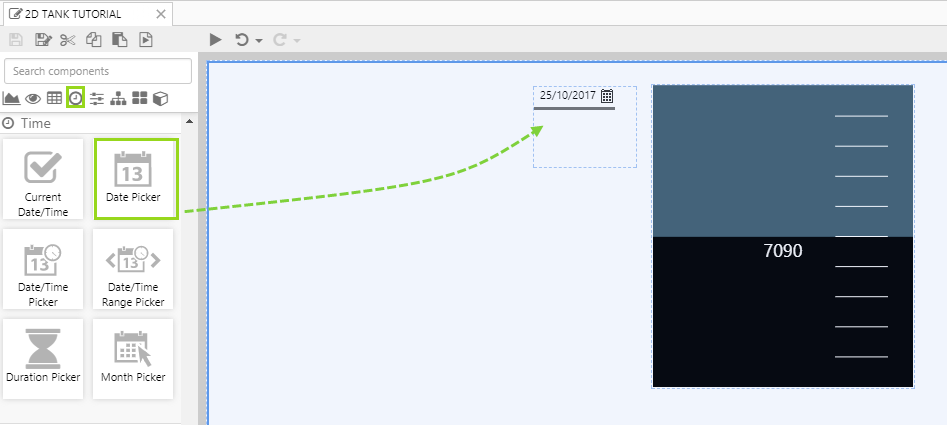
There is no need to configure the date picker. The date picker's end time updates the page variable for end time. This is also used by the tank component's tags. Thus, when a user changes the date using the Date Picker control, the tank's tag data refreshes.
|
Step 5. All done!
Congratulations! You now have a tank that will change volume levels according to the selected date.
- Click the preview
 button on the Studio toolbar to see what your page will look like in run-time.
 - Select different dates and observe the changes in the tank level.
Or watch this video:
Release History
- Tank 4.5.3 (this release)
- The Tank shape now has a 2D option.