Overview
P2 Explorer pages are interactive, allowing you to drill down and find further information on various components of a page. This article describes how to interact with the Meter and Tank components to obtain further information from your data.
Depending on what data your meter or tank has been configured to display, when you right-click the component, a variety of menu options will be presented.
| Menu option | Displayed for |
| Open Trend | Time series data. Opens a trend containing a trace of the data. |
| Open Detail | Attribute value or tag. Opens the Point Detail page of the data point. |
| Write Value | Attribute value or tag, if the datasource allows writing to the database. Opens the Enter value dialog, where you can change the value of the data point. |
Meter
The Meter displays a numeric value in the form of a needle in relation of a range of targets.
If your meter has been configured to track the value of a tag or attribute value, you can right-click on it to see a range of menu options.
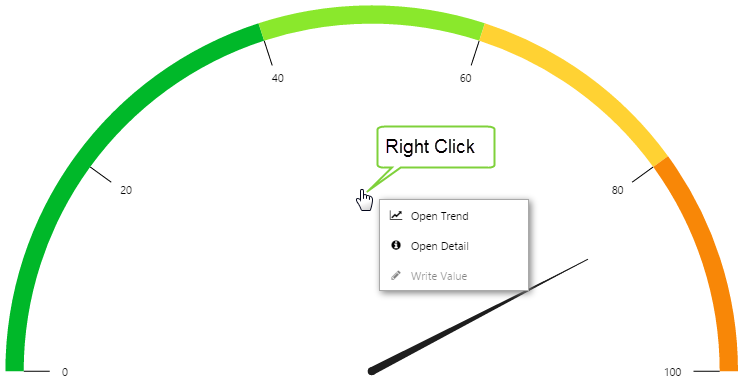
Meter displaying menu options. In this example, the datasource does not allow writing to the database.
Tank
The Tank displays a data value as the percentage fill in a simulated tank shape.
If your tank has been configured to track the value of a tag or attribute value, you can right-click on it to see a range of menu options.
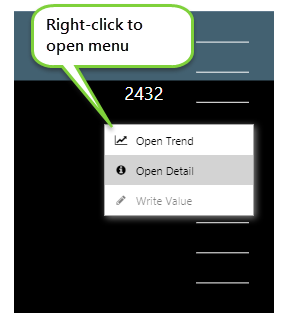
Tank displaying menu options. In this example, the tank is displaying the value of a tag, and the datasource does not allow writing to the database.
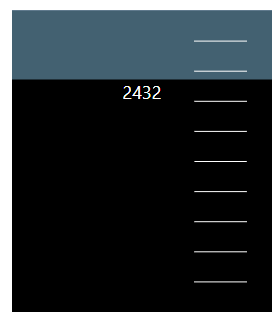
Note that the tank can be configured as a two-dimensional or a three-dimensional shape:
| A two-dimensional tank | A three-dimensional tank |
 |
 |