ON THIS PAGE:
Overview
A trend displays time-series data, such as tags and attributes, as a line chart over a selected period of time.
To create a trend, you need to open a new blank trend and then add tag or attribute data to this. The screenshot below shows a new trend, with two attributes:
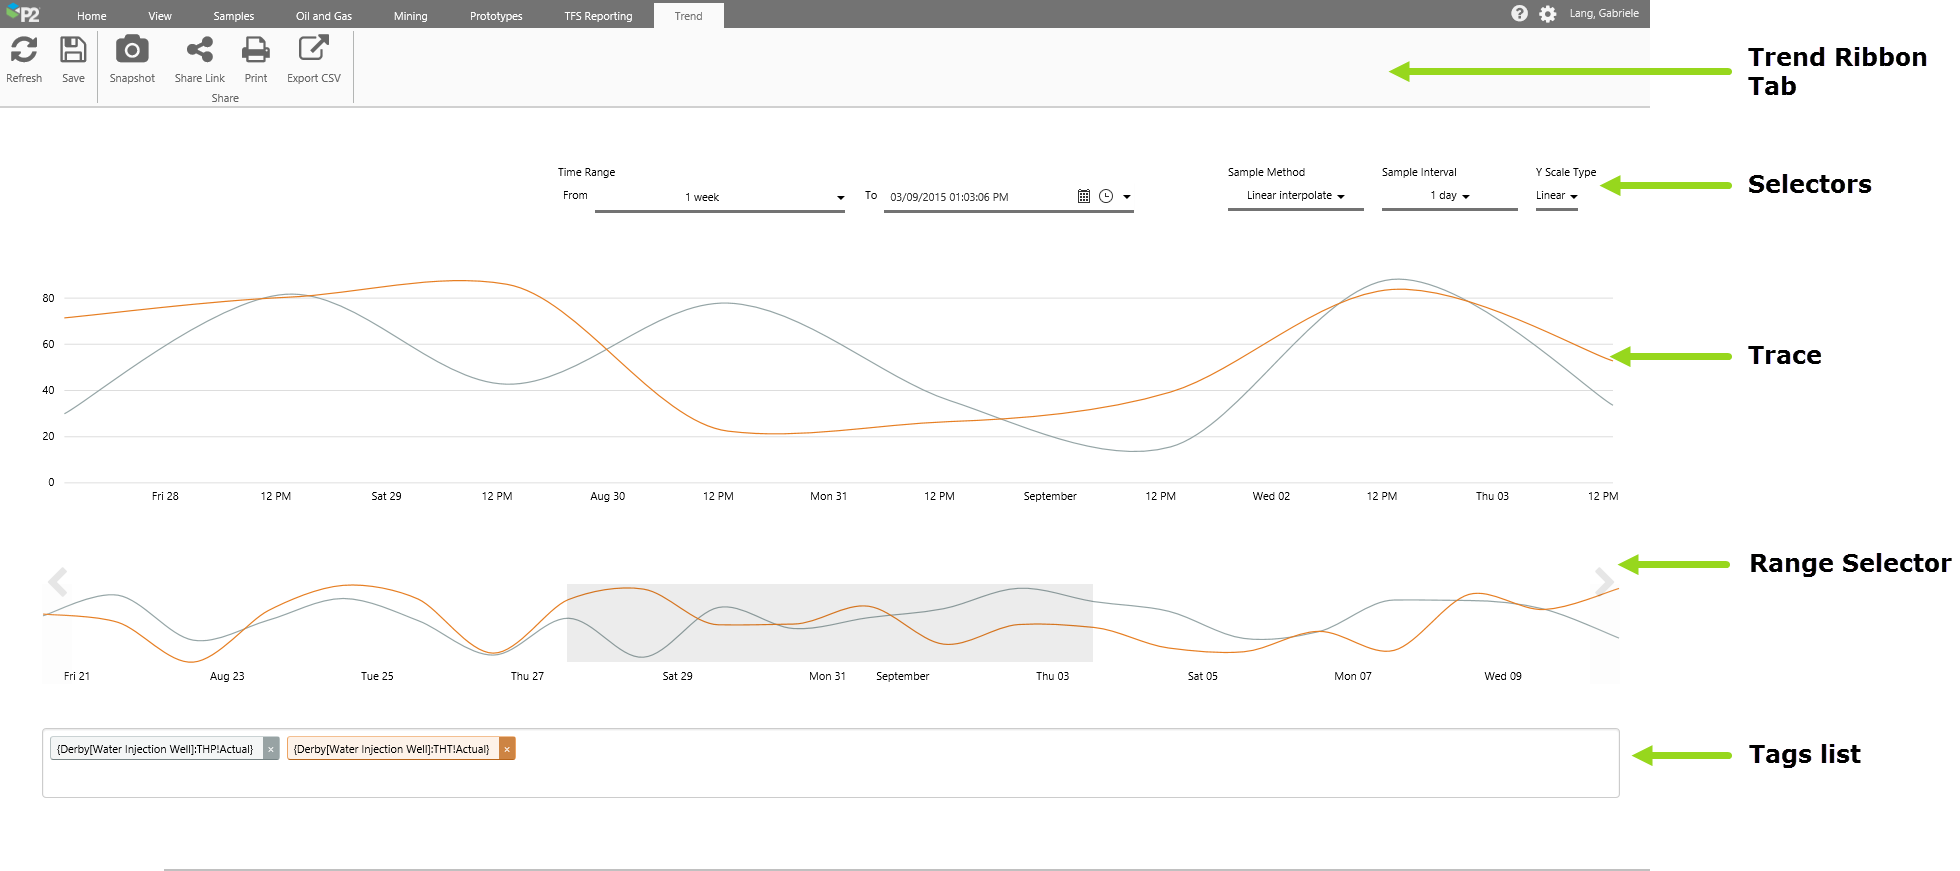
Trend Overview
| Trend Ribbon Tab | Use the buttons on this tab to refresh, save, or share the trend. (Refresh, Save, Snapshot, Share Link, Print, Export CSV) | ||||||||
| Selectors | The selections you make affect the time range of the chart, as well as how P2 Server fetches the data, and how the trace line is displayed. | ||||||||
|
|||||||||
| Trace | The trace displays time-series data, such as tags, over a period of time (Time Range). | ||||||||
| Range Selector | The highlighted section in the range selector matches the start and end of the trend time range. Use the range selector as a longer trend, to help identify highs and lows. You can select smaller periods within the range selector, to pick a new time range. | ||||||||
| Tags List | Drag and drop tags, attributes or attribute values into this list to include them in the trace. Each one is assigned a legend colour. |
Tutorial
In this tutorial we’ll add a new trend, and then drop some attributes into the Tags List, to create a trace. We'll then experiment with features of the resulting trend.
Let's go through this process, step-by-step.
Step by Step: Adding a New Trend
First we'll open a new trend and put some data on there. Next, we'll experiment with changing selections and using the range selector, and then we'll add a hairline with comments. Next, we'll save the trend. And finally, we'll locate and open the saved trend.
If you have access to the training environment, you can follow the steps exactly as outlined here. Otherwise, you will need to adjust the configuration to suit your data.
Step 1. Adding a New Trend
Open the Home tab on the Explorer ribbon, and click New Trend.
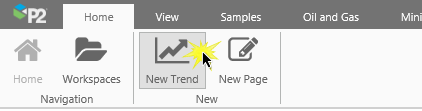
Click New Trend
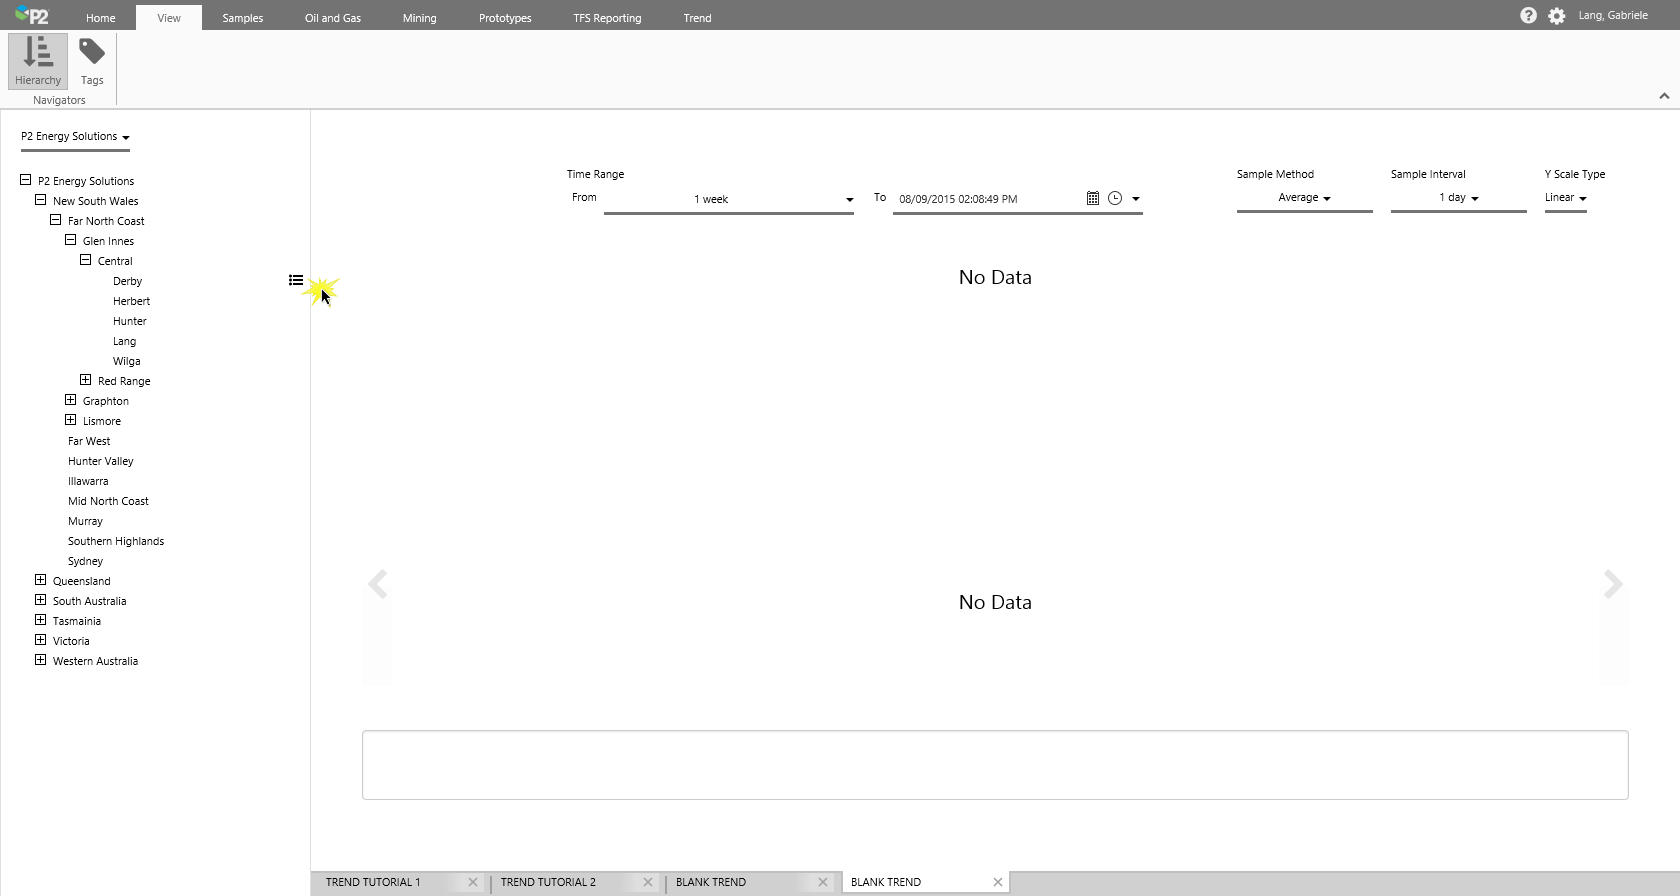
A new Blank Trend opens in Explorer, with the following defaults:
| Time Range: | From 1 week To {current date and time} |
| Sample Method: | Average |
| Sample Interval: | 1 day |
| Y Scale Type: | Linear |
New Blank Trend with Selector Defaults
Note that the Page tab on the ribbon is replaced by the Trend tab.
Step 2. Adding an Attribute or Tag to the Trace
To add attributes or tags to the trace, you need to drop them into the Tags List, or manually type in the names, if known. You can also add calculations to items in the tags list.
Dropping an Attribute into the Tags List
To add an attribute to the Tags List: Open the hierarchy navigator, select a hierarchy, then search for the attribute you want to trace and drag it into the tag list. Follow the steps below:
1. Click the View tab on the Ribbon, then click Hierarchy.
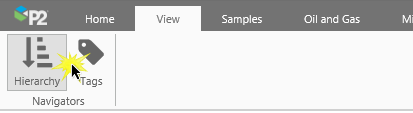
Click Hierarchy
2. Select a hierarchy from the drop-down list, navigate through the hierarchy to find your entity, and click the Attributes button to the right of that entity.
In our example tutorial, we select the P2 Energy Solutions hierarchy, and navigate to Derby entity: New South Wales>Far North Coast>Glen Innes>Central>Derby
Search the Hierarchy
3. Select an attribute from one of the templates, and drag it onto the Tags List. Now add another one in the same way.
The attributes used in our example tutorial are: Derby[Water Injection Well]:THP!Actual and Derby[Water Injection Well]:THT!Actual.
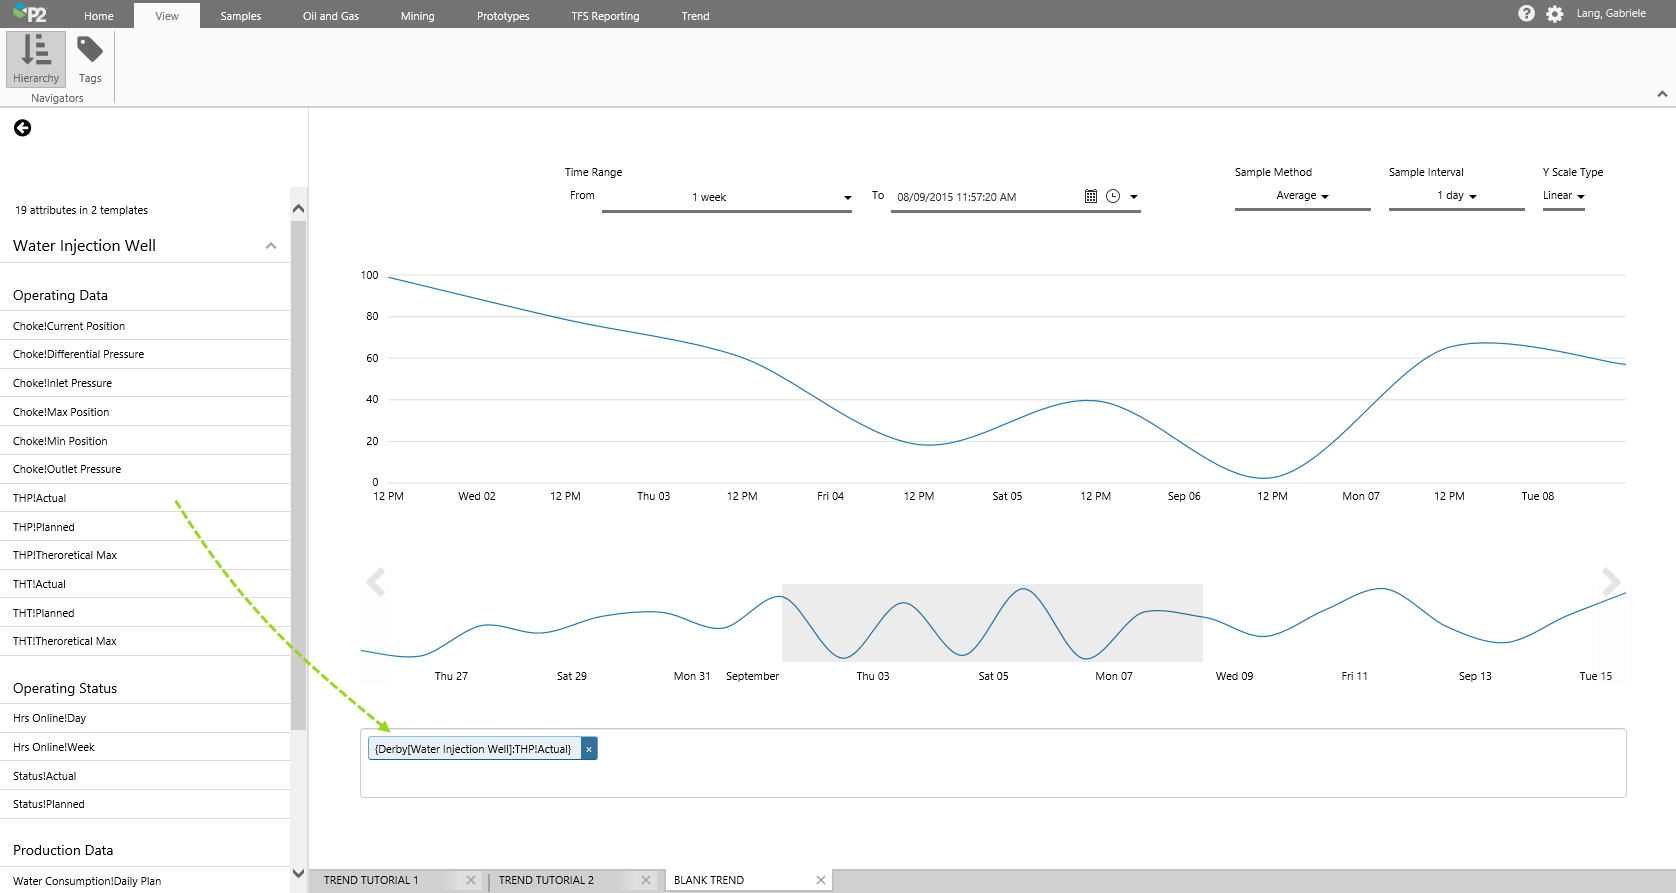
Drop Attribute onto Tags List
Dropping a Tag into the Tags List
1. Click Tags on the View tab.
2. Search for tags in the tags list that appears on a panel on the left. Drag and drop a tag onto the Tags List.
Typing Values into the Tags List
You can type a known tag name or attribute name surrounded by curly brackets {}, for example: {gold} in the Tags List, and then press enter.
You can also type in a calculation, also surrounded by curly brackets {}, for example: {Derby:THP} * 2. Note that the attribute in this list only requires the entity name and attribute name (template name and attribute value are optional).
Step 3. Changing Trend Selections
In this step, we'll experiment with changing the Time Range, Sample Method and Sample Interval, and the Y Scale Type. Note that the selections affect how much data is returned, thus affecting the time taken to render the trend.
Step 3.1. Changing the Time Range
The defaults are: From 1 week to current date and time
Select 3 months from the Time Range drop-down list. Note how the trend range now extends for three months.
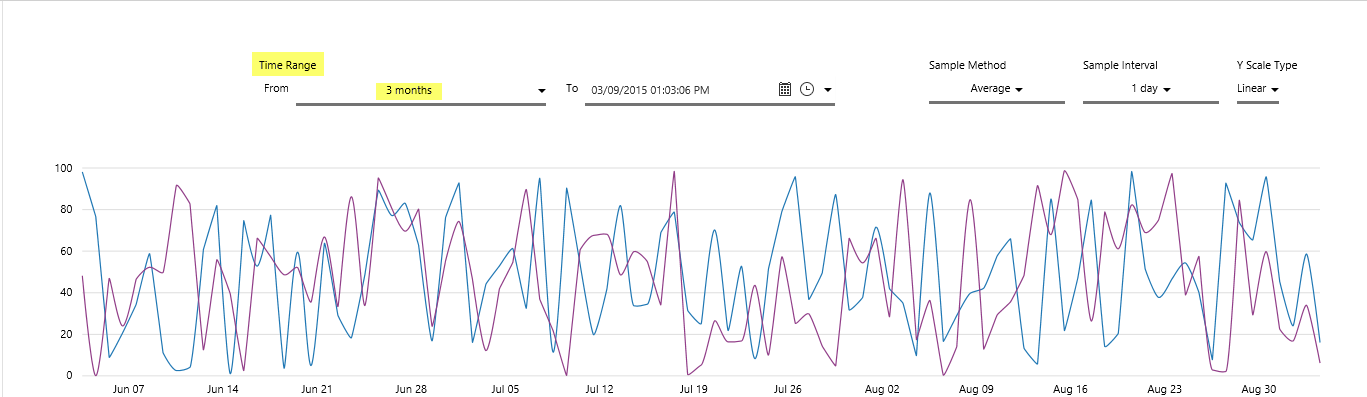
A Trend Spanning 3 Months
Note: If you select a long time range (such as three months or longer) there will be a lot of data returned, which will take longer than if you select a short range, such as 1 week.
Step 3.2. Changing the Sample Method
The default is: Average
Select Linear Interpolate from the Sample Method drop-down list.
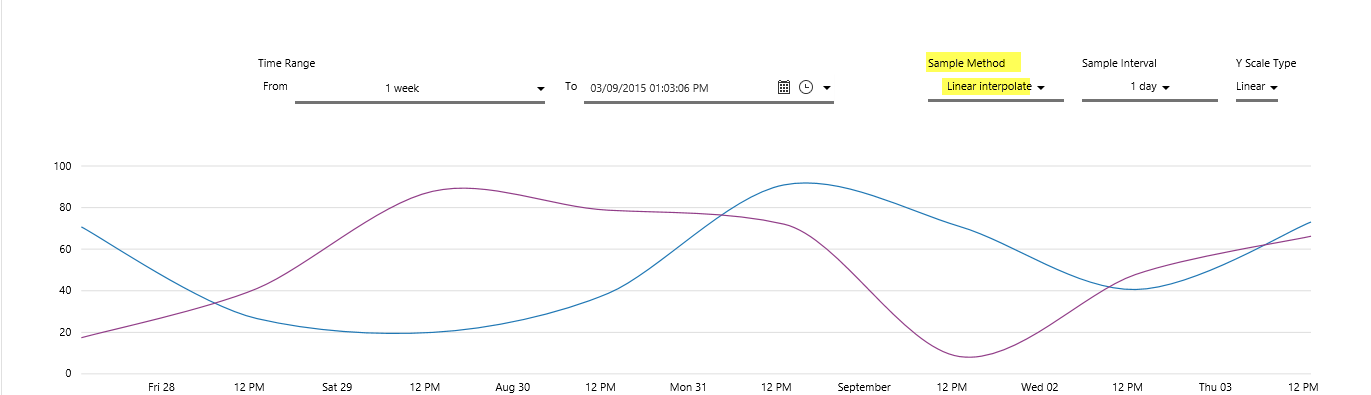
Trend with Linear Interpolate Sample Method
Note: Raw sample method will usually return the highest number of data points, potentially affecting performance.
Step 3.3. Changing the Sample Interval
The default is: 1 day
Select 2 weeks from the Sample Interval drop-down list.
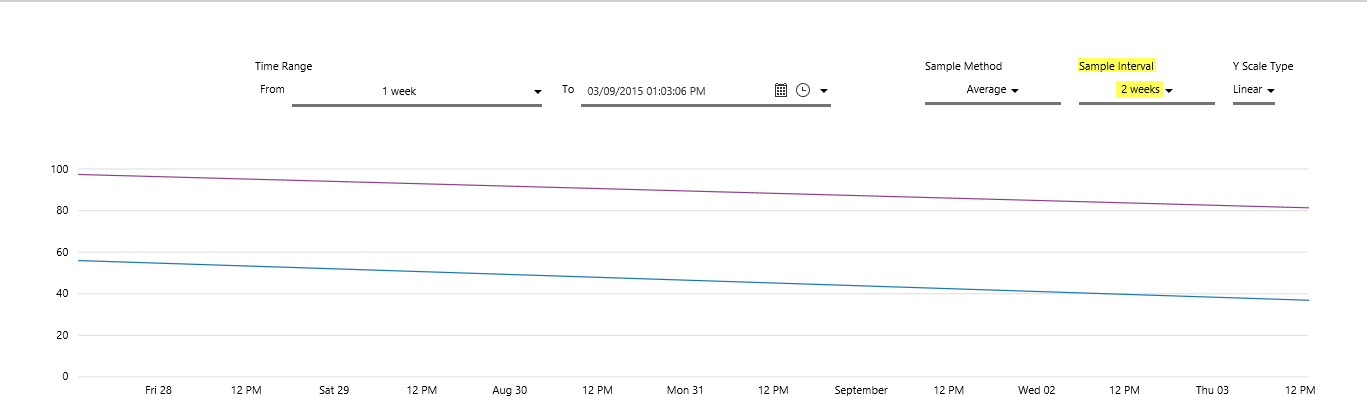
Trend with 2 Weeks Sample Interval
Note: The shorter your interval (for example 5 seconds ) the more data required, potentially affecting performance.
Step 3.4. Changing the Y Scale Type
The default is: Linear
Select Log from the Y Scale Type drop-down list.
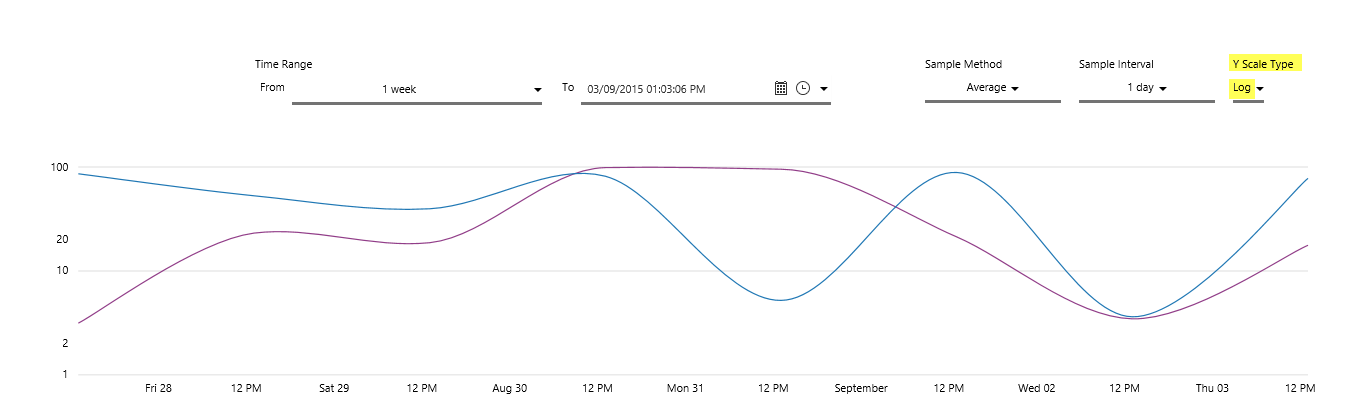
Trend with a Y Scale Type of Log
Note: Negative or zero values cannot render in the logarithmic scale type.
Step 4. Changing your Time Selection with the Range Selector
The Range Selector, found below the Trace, works together with the Time Range selectors to set your trend time range. By default, the range selector has a highlighted section that matches the time range set by the date pickers, with an equal amount of time shown before and after.
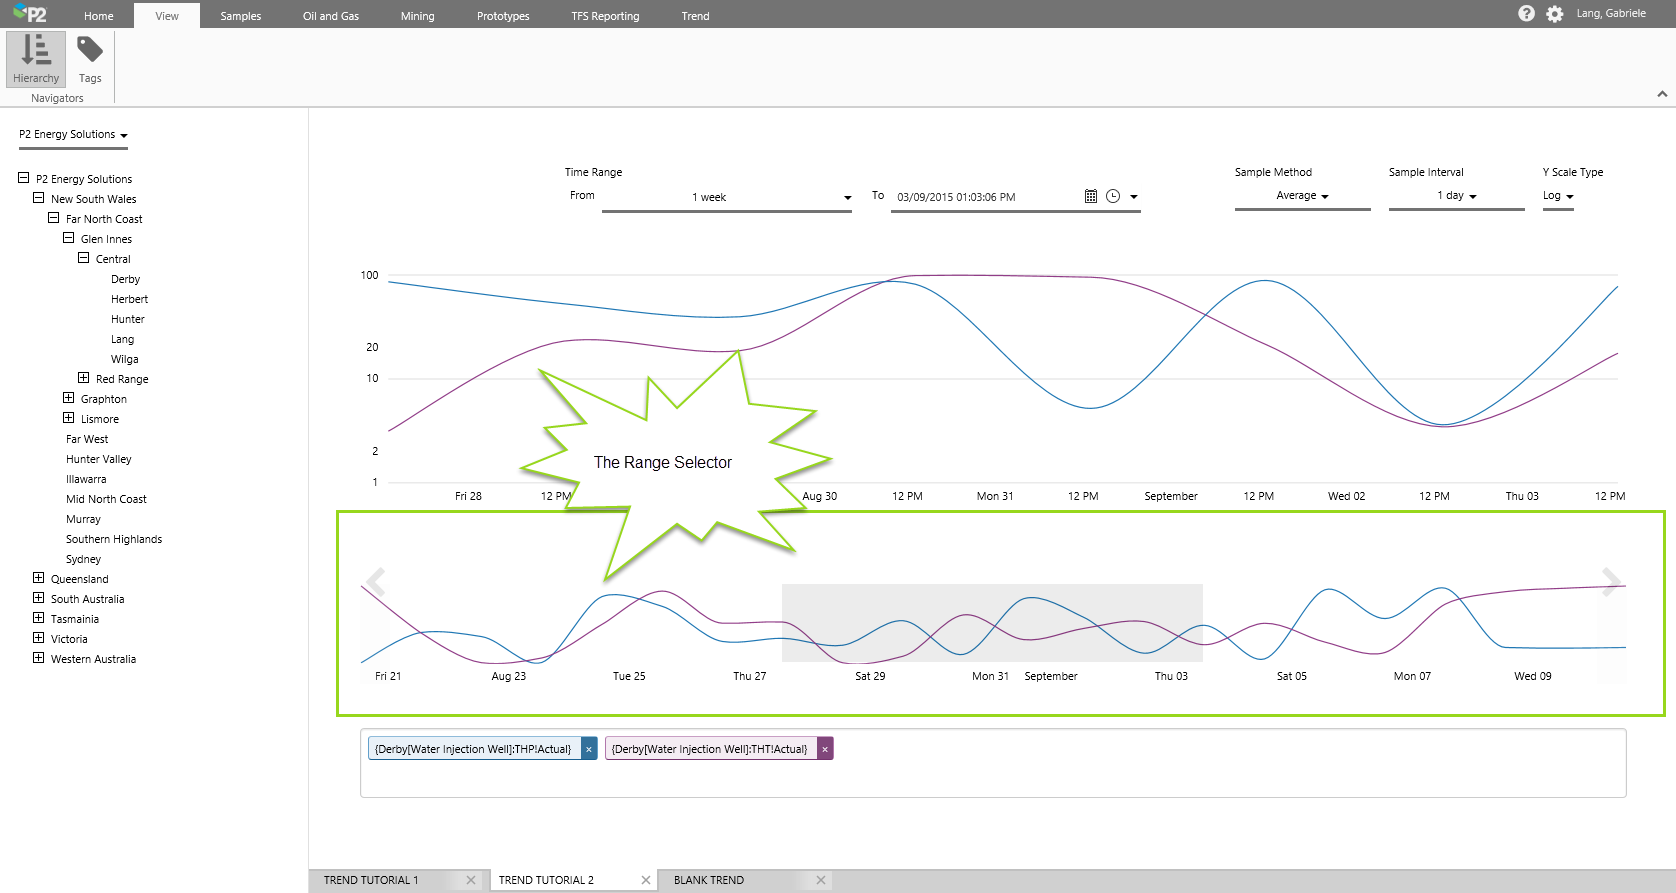
The Trend Range Selector
Resizing the highlighted section
1. Hover the mouse over the left or right edge of the highlighted section, until you see the mouse horizontal resize pointer.
2. Now click and drag to left or right. Note how the trend start and end time changes.
Moving the highlighted section
1. Hover the mouse over the central portion of the highlighted section, until you see the mouse move pointer.
2. Now click and drag the whole highlighted section to left (earlier) or right (later). Note how the trend start and end time changes.
Changing the Range Selector start and end dates
Click on the left or right arrow to move the start and end date of the range selector. Note that the dates on the highlighted section do not change; the highlighted section just moves across (to left or right) in relation to the changing start and end dates of the range selector.
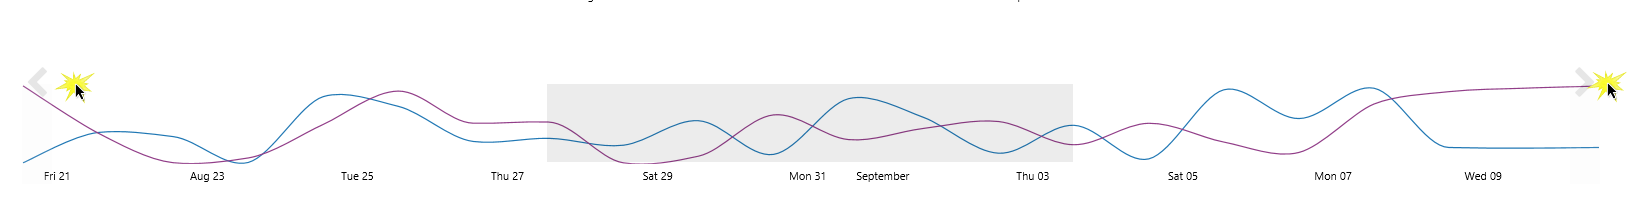
Moving the Trend Range Selector Start and End dates
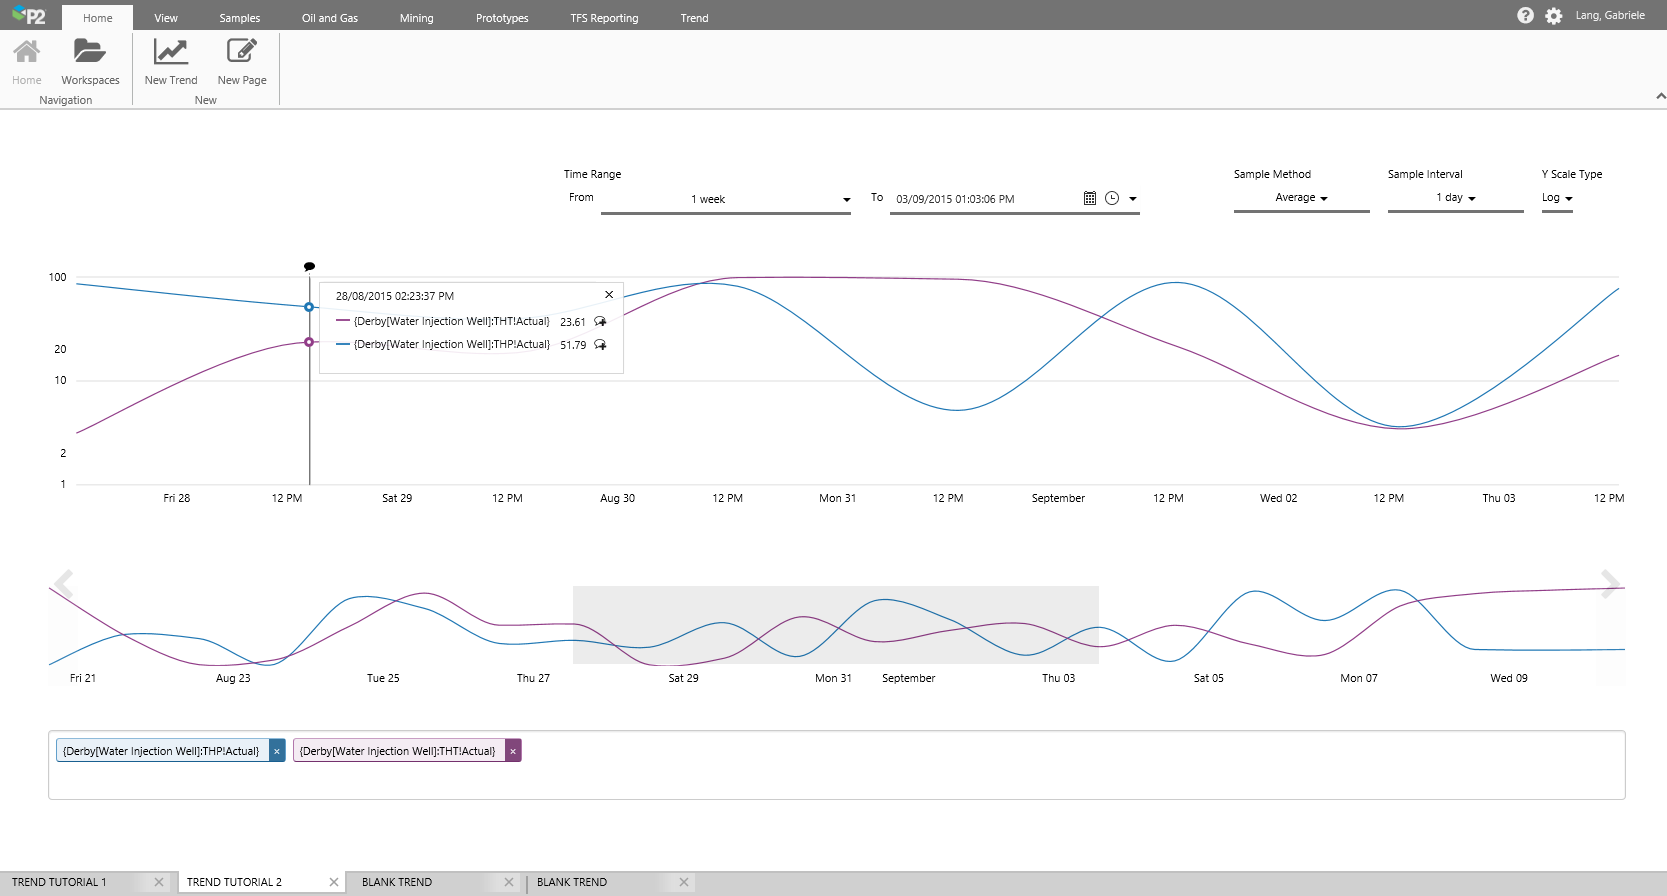
Step 5. Adding a Hairline and Comments
Add a hairline to view values (if any) for all trended tags at a particular point in time. You can leave a comment for a trended tag at the hairline point, or view and reply to other comments.
Trend Hairline
New Hairline
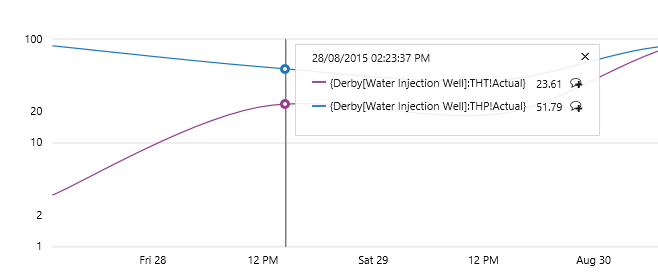
Click a point on the trace to get a hairline, a vertical line marking out this time, with an information box to the side.
To remove the hairline, close information box (click X on the top right corner).
To move the hairline, either drag it along the trace, or add a click another point on the trace.
Hairline Date and Time
This is displayed at the top of the information box, ordered by highest to lowest tag value at the hairline point.
Each tag is identified by its trace legend and its full name. The tag value (if any) is displayed to the right, followed by a comment icon.
Adding a Comment
To add or view comments, click the comment icon for a tag. See below for more on comments.
Step 6. Adding, Viewing and Replying to Comments on a Trend Tag
Comments can be added to tags on a trend. You can reply to comments, locate comments on a trace, and even search for a range of comments by changing the search times in a comment window for a particular tag. All tag comments within the range are listed in the comment window, in order of most recent
Note that you cannot remove comments.
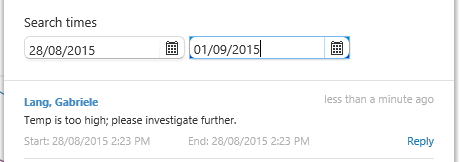
Tag Comment Search Times
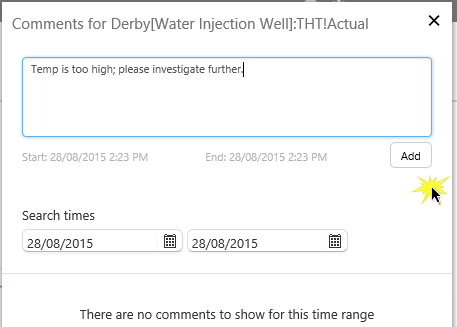
Step 6.1. Adding a Comment
1. Click the comment icon on the hairline information box, to open a blank comment window.
2. Type in a comment, then click Add.
Add a Comment
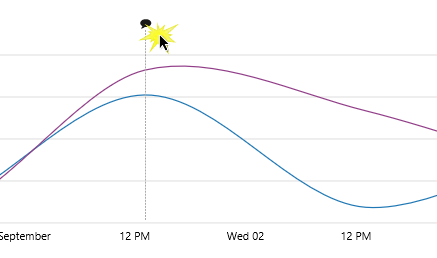
Step 6.2. Replying to Comment
Comments are indicated on the trace by a vertical, dotted line.
1. Click the comment icon to open the comment window. (You can click the comment icon again to close the comment window.)
Locate and Open the Comment
2. In the comment window, click reply, then type in a response and click Add.
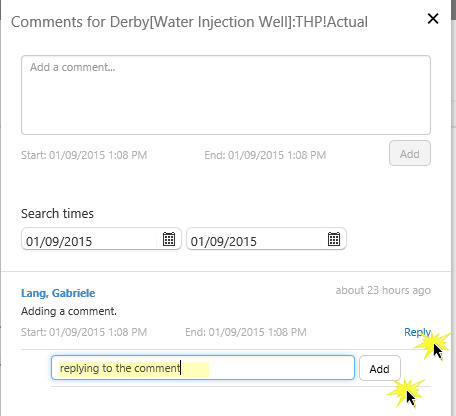
Reply to the Comment
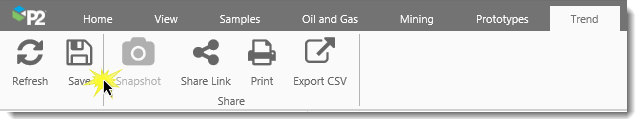
Step 7. Saving Your Trend
Open the Trend tab on the Explorer ribbon, and click Save.
Click Save on the Trend Ribbon
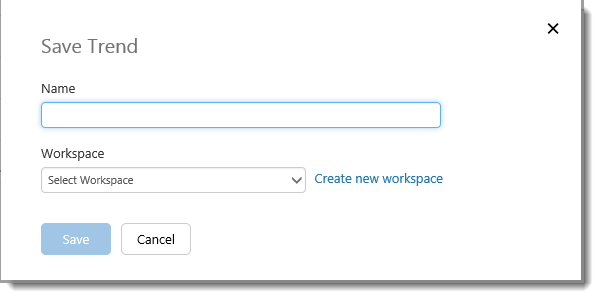
The Save Trend window opens. Type in a Name for your trend, and select a Workspace from the drop-down list, or click Create new workspace, then click Save.
Save Trend
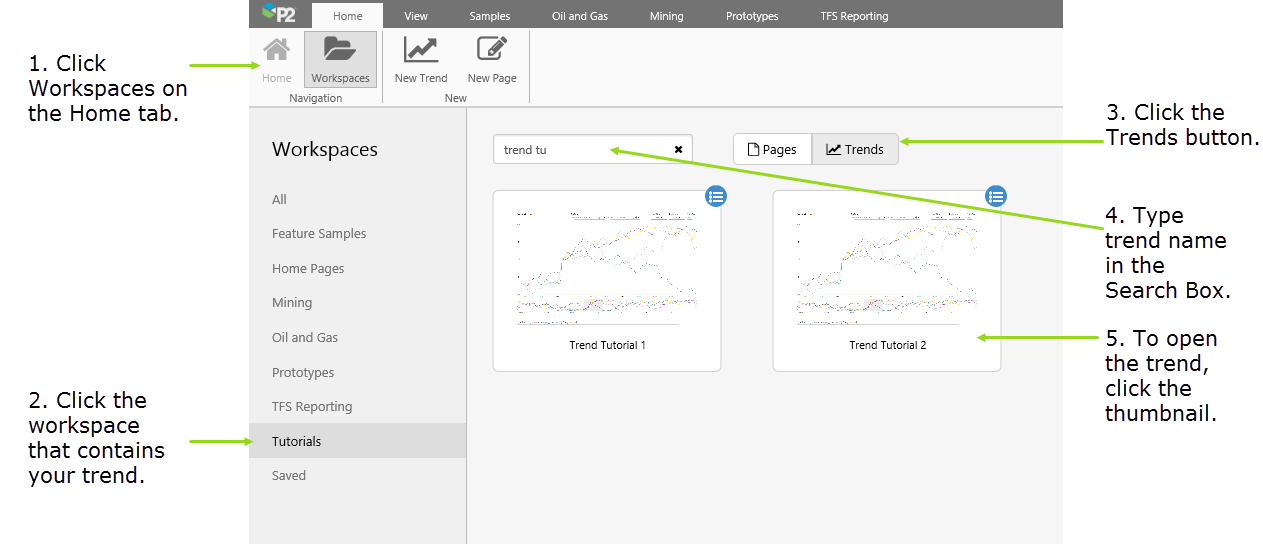
Step 8. Search for a Trend
Now that you have created and saved your trend, here is how you can find it again:
1. Open the Home tab on the Explorer ribbon, and click Workspaces.
2. Click the workspace that contains the trend (for example, Tutorials).
3. Click Trends in the main area.
4. Type the trend name in the Filter Trends search box.
5. Click on the trend thumbnail to open it.
Search for and Open a Trend