Reading a Wind Vane
The Wind Vane shows you when the wind direction approaches a direction that may be considered problematic, such as emissions drifting too closely to a settlement.
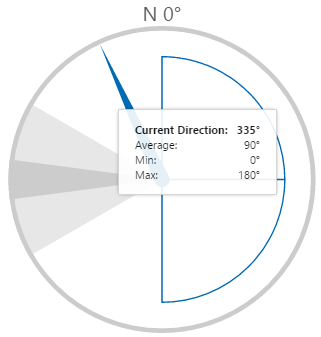
At any time, you can hover over the wind vane to see the actual reading for:
- Current wind direction
- Average wind direction
- Minimum wind direction
- Maximum wind direction
Ordinarily, the wind vane has a transparent background with grey shaded zones. The shaded zones represent 'danger' and 'warning' zones.
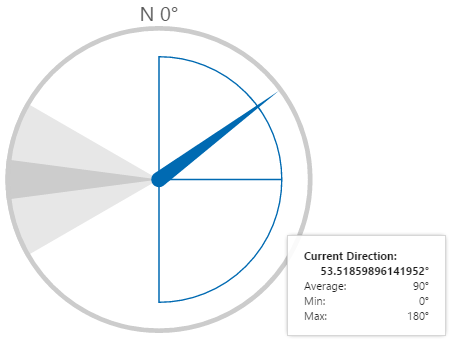
Additionally, the wind vane contains a blue semi-circle divided in two, representing an average wind direction, as well as maximum and minimum directions. These are usually used to indicate the prevailing winds.
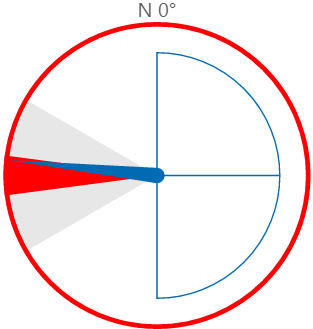
Danger Zone
The 'danger' zone indicates the wind is blowing in a direction that is considered to be a problem.
When the wind direction is within the darker 'danger' zone, the zone and outline of the wind vane change to red.
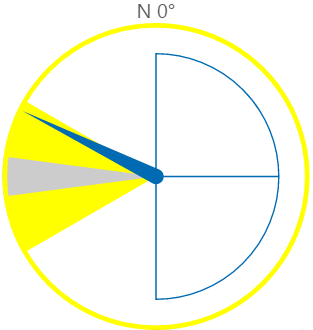
Warning Zone
The 'warning' zone indicates the wind is blowing in a direction that is approaching the danger zone, and a problem may be imminent.
When the wind direction is within the light grey 'warning' zone, the zone and outline of the wind vane change to yellow.
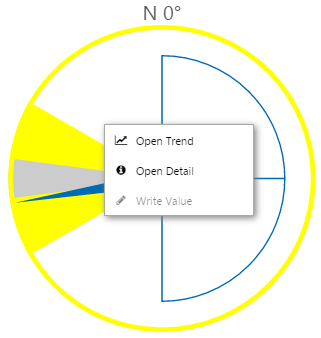
Interacting with a Wind Vane
IFS OI Explorer pages are interactive, allowing you to drill down and find further information on various components of a page.
Right-click
Depending on what data your wind vane has been configured to display, when you right-click the component, a variety of menu options will be presented.
| Menu option | Displayed for |
| Open Trend | Time series data. Opens a trend containing a trace of the data. |
| Open Detail | Attribute value or tag. Opens the Point Detail page of the data point. |
| Write Value | Attribute value or tag, if the datasource allows writing to the database. Opens the Enter value dialog, where you can change the value of the data point. |
Hover
When you hover over the wind vane, a tooltip appears showing values for the current wind direction, average wind direction, and min/max wind directions.