ON THIS PAGE:
The Calculation Tester is a fully-featured tool that allows you to test the results of your calculation.
This allows you to have even greater confidence in the calculation, beyond simply knowing that the syntax is correct, and enables you to determine whether or not you are getting the data you need from the calculation.
With the calculation tester, you can compare test results of the calculation run against different inputs, including:
- Entity (if required)
- Time Range (calculated from 'now')
- Sample Method
- Sample Interval
You can also:
- Export test results
- Open test results in separate windows, and keep them open so you can compare the results of different inputs
- See the time taken to run the calculation
The ‘Test’ button will become available only when the calculation is recognised as being syntactically correct.
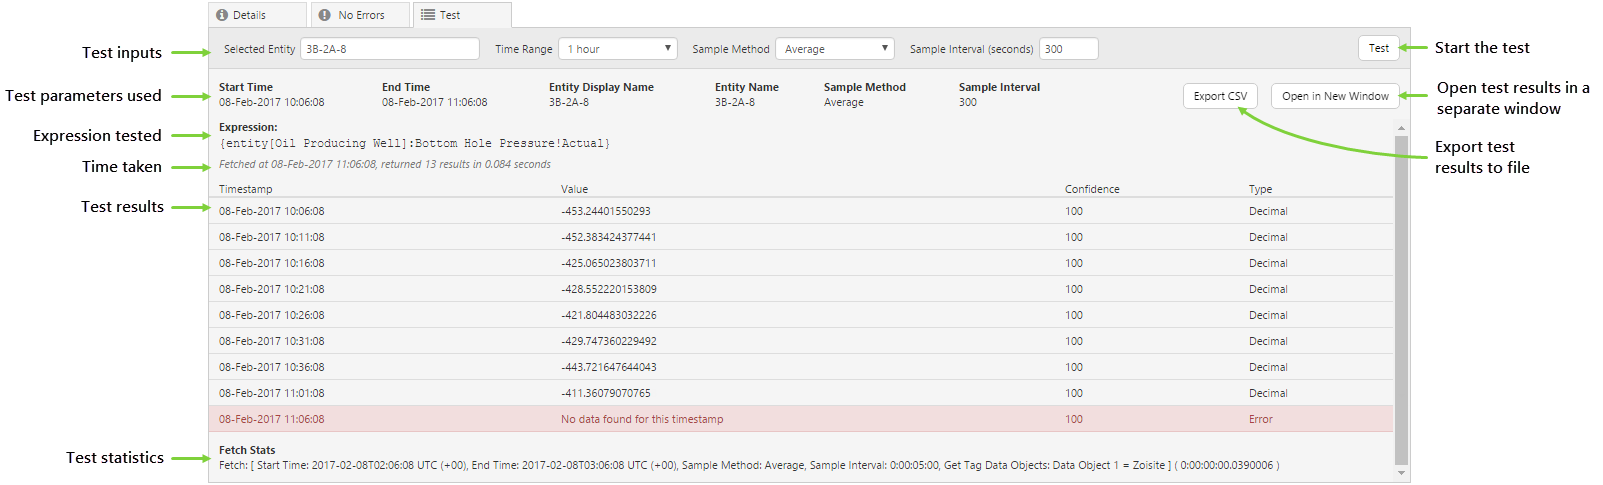
The Test Results are displayed below the parameters, after the ‘Test’ button is clicked. The results show not only the returned data, but also a summary of the parameters used, as well as the time taken for the calculation and options to export to .csv or to open the results in a new window.
How to Use the Calculation Tester
The tester will only become available when the error tab displays no errors, and when all of the required input parameters have been entered.
Step 1. Ensure no errors
First, ensure that the Error tab displays no errors. The Test button will not be available if the calculation expression contains any syntax errors. These can include:
- Mismatched brackets
- Use of square brackets [] - these are used as placeholders for optional parameters in functions, and are intended to be replaced
- Unrecognised keywords, e.g. Time being used instead of Time()

Syntax error in calculation expression
Step 2. Complete all required test inputs
By default, the Time Range, Sample Method, and Sample Interval are completed by default, but can be changed by selecting values from the drop down list (for Time Range and Sample Method), or by entering an number for the Sample Interval (the default of 300 seconds represents 5 minutes).

All required inputs are completed, inputs not required are greyed out, and test button becomes available
However, if your expression requires an entity name, you will need to enter the name in the Selected Entity field before the Test button becomes available.

Required input not entered
Click in the field and start typing, and a drop-down list will appear and be filtered as you type.
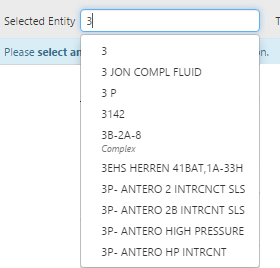
Selected Entity drop-down list, being filtered as you type
Select your entity from the list by using the arrow keys, and clicking Enter when your entity is highlighted.

All inputs completed, and test button becomes available
Step 3. Click Test
When you have no errors and all your inputs have been completed, click the Test button. The test will run and your results are displayed in the panel below.
What to Do With Your Results
Your results appear in the Test panel after you have clicked the Test button.
Here you can check your fetch results, the parameters you used, the expression being tested, and the performance of the calculation.
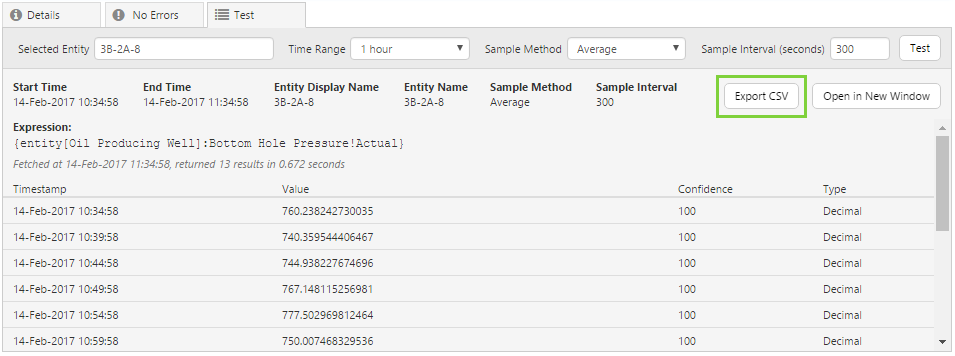
Save Your Results
If you want to save your test results for future reference, click the Export CSV button. This will enable you to download the test results in .csv format.
Retest Using Different Parameters
If you want to test your expression using different parameters, you can also display your current test results in a new window, by clicking the Open in New Window button.
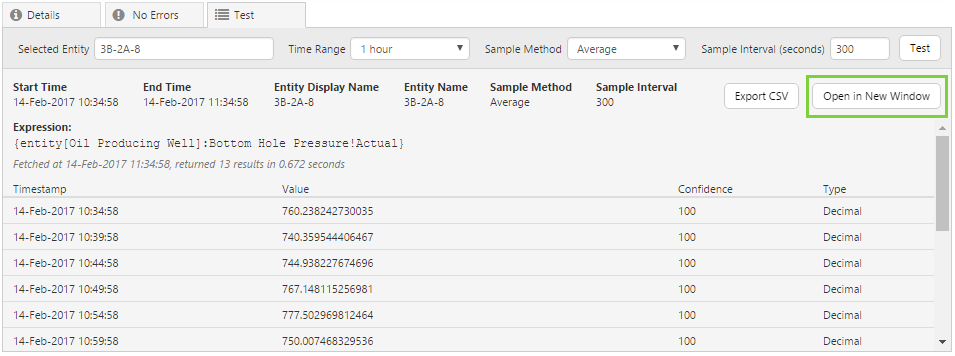
You can then retest the calculation, and display the two sets of results side by side for comparison. You can have several result windows open at the same time, closing them individually as needed.
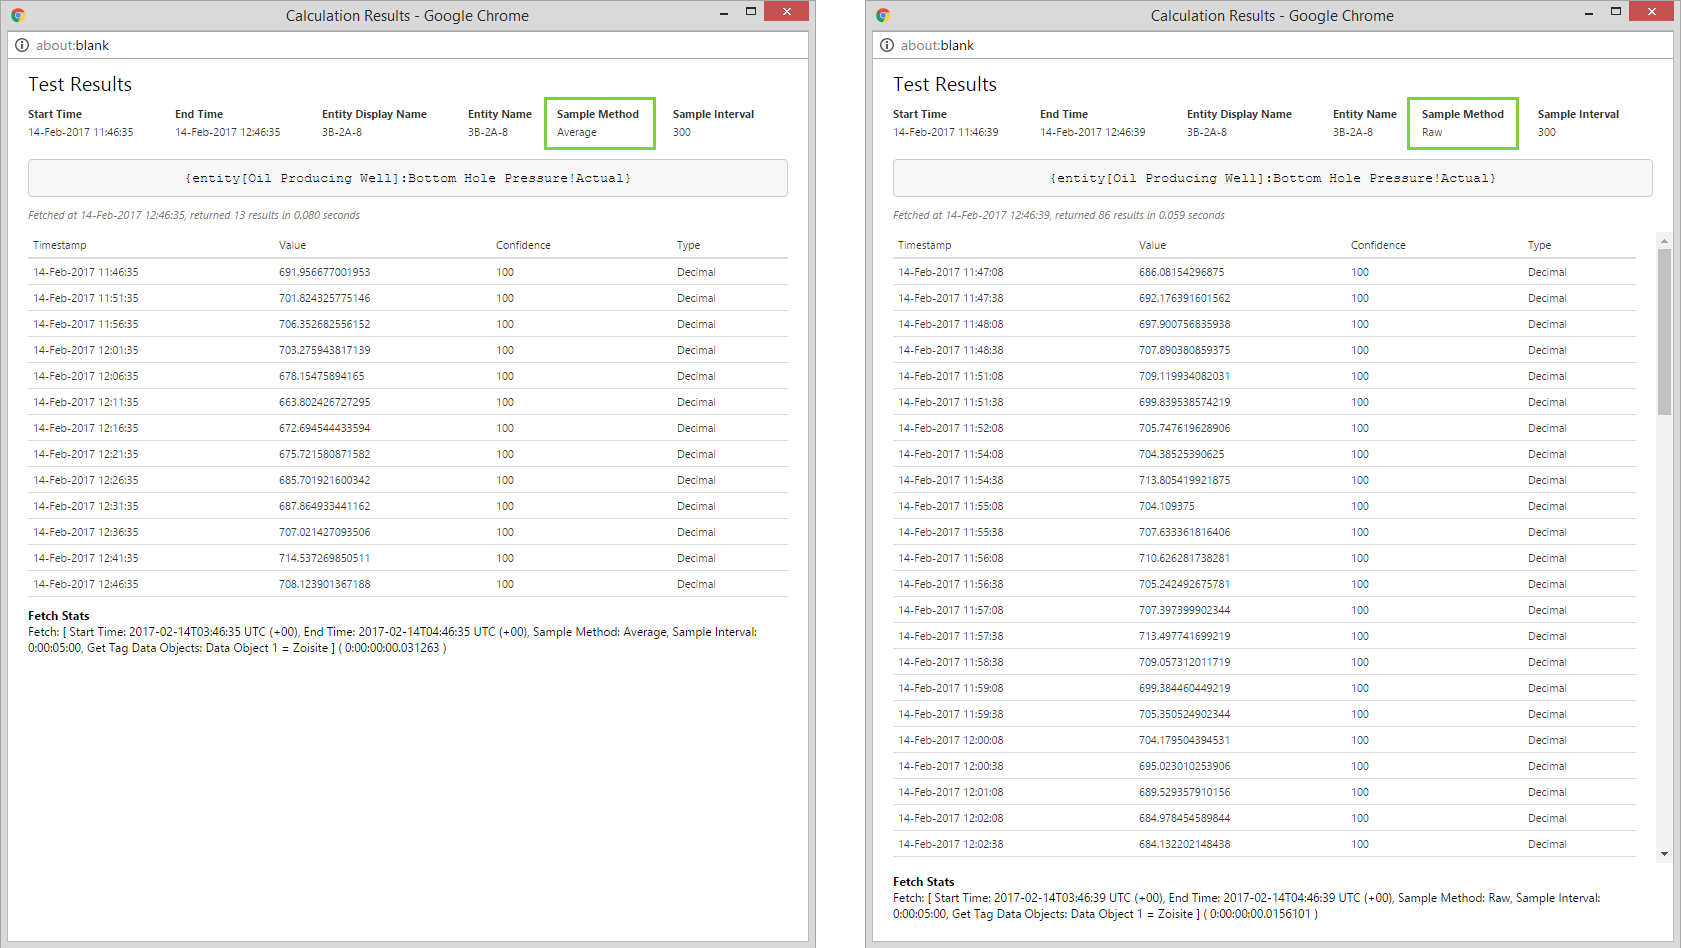
All the information from the test panel, including fetch results, parameters used, expression tested, and performance results, are displayed in the floating windows.
Check the Fetch Statistics
When using the Calculation Editor to test a calculation that involves a tag fetch, the Test tab will display some statistics about the tag fetch – the date and time of the fetch, the number of results, and the time taken to process the calculation.
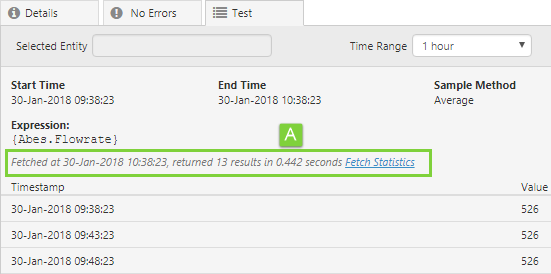
Details of the Fetch Statistics can be accessed by clicking the Fetch Statistics link.
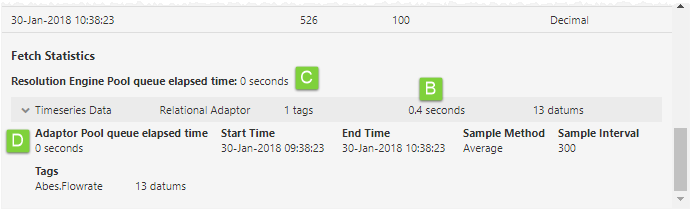
The grey bar presents a summary of the fetch statistics. You can click this to see more statistics, as annotated above. The following notes describe the available statistics:
A. The total execution time of the request in the calculation editor (i.e. time elapsed between sending the request to IFS OI Server and receiving a response). Note that the calculation editor always sends a single request as there is only one expression to evaluate, and it always waits for a single response. This is different to Explorer which may send multiple requests and receive multiple responses, depending on how many calculations are being processed in the request.
B. How long it took for an adaptor to fetch the tag data. It is useful for diagnosing slow datasources, adaptors, or historians.
C. How long the tag fetch request was queued before a Resolution Engine became available to process it. The number of Resolution Engines scales with the number of logical processors available on the host machine. A high number here might indicate that improving your hardware could assist in resolving performance issues.
D. How long the tag fetch request was queued before an adaptor became available to process it. A high value here can mean that the size of the adaptor pool should be increased (this can be configured on the datasource in IFS OI Server Management).
Note: You will see high numbers if the Data Broker is under heavy load. Options to mitigate this could include increasing the size of the adaptor pool, allocating more hardware to the source data system, improving the hardware or network, reducing the load on the datasource (e.g. running scheduled tasks at a different time), etc. Each situation is unique.
Release History
- Using the Calculation Tester 4.5.5 (this release)
- Added fetch statistics for Resolution Engine Pool queue and Adaptor Pool queue
- Using the Calculation Tester 4.4.5
- Initial release