The Timeline displays a Gantt Chart view of events for the selected site and area, limited by the period selected.
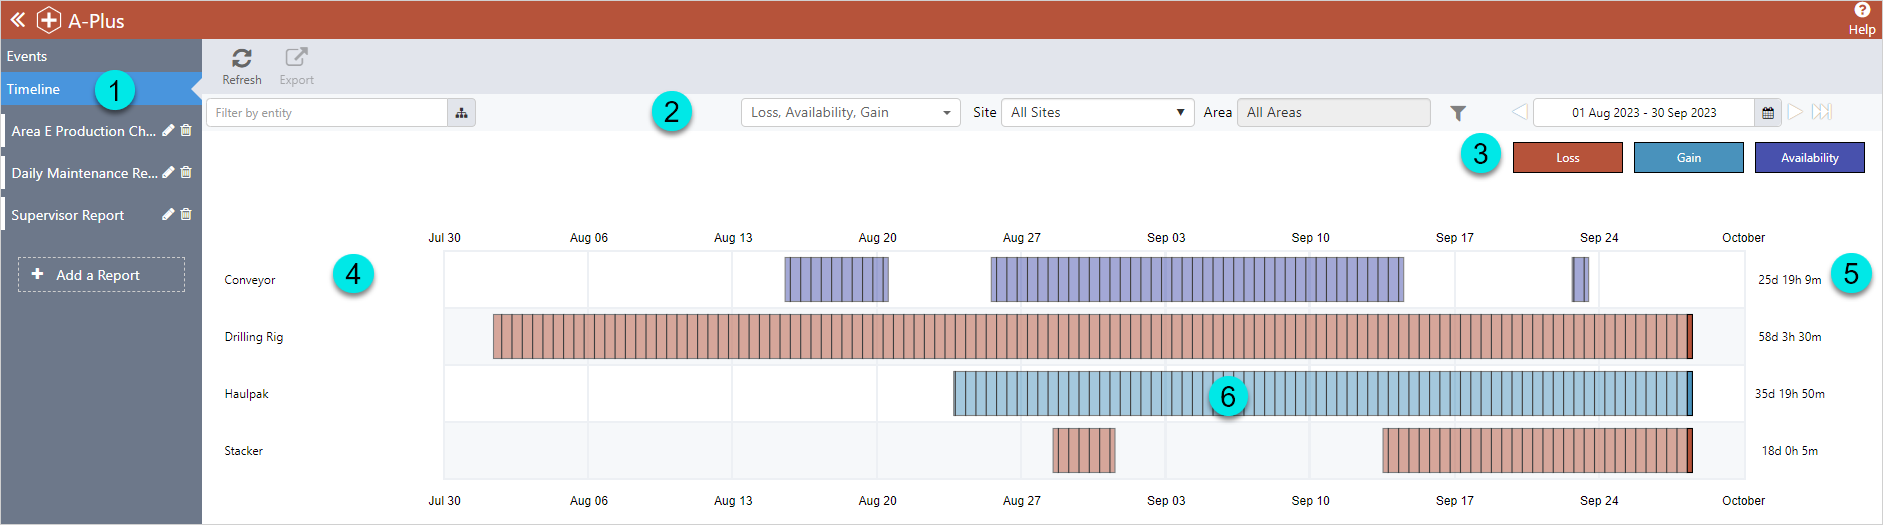
| 1. | Timeline | Select Timeline to display a Gantt Chart of the events in the selected period. | ||||||
| 2. | Filter Bar | Apply one or more filters to show only the entities and events that match the specified criteria. | ||||||
| 3. | Legend | The different event types are colour coded.
|
||||||
| 4. | Entity | The entity represented by the row in the chart. | ||||||
| 5. | Downtime Hours | Combined downtime hours for the entity. | ||||||
|
6. |
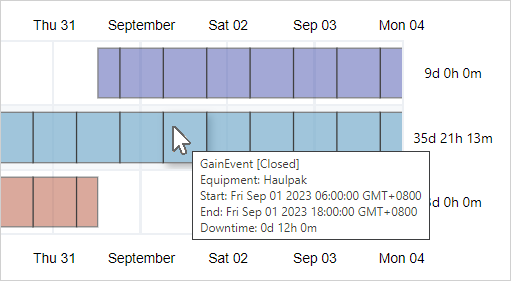
Transactions | Each column represents an event transaction. Hover over a transaction to display a tool tip with event details.
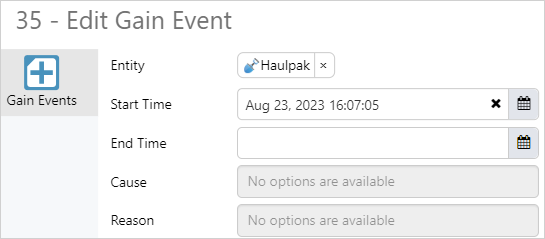
Click on a transaction to open the edit event dialog.
|