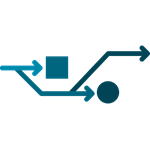
The Switch Layout is a powerful component that can change the components that are displayed on a page depending on what the user selects on that page. It’s typically used in conjunction with a grid layout on dashboard-style pages. This tutorial walks you through a scenario for configuring the Switch component, and applies to versions 4.3.2 and earlier of P2 Explorer.
Read more
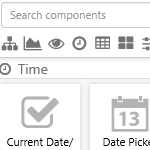
This article describes how to get a single page ready for date/time tutorials. ON THIS PAGE:OverviewPage Defaults for startTime and endTimePreparing the PageDate Time Tutorials Overview There are several date/time components in Explorer, and each of these uses one or more dates. To save yourself some time, it's worth setting…
Read more
The Level Meter is used for measuring levels against configurable limits. Its appearance changes when limits/alarm thresholds are exceeded. This article applies to Version 4.4.1 of P2 Explorer.
Read more

Hyperlinks provide a useful way to direct the navigational flow between various Explorer pages. They are also useful for opening trends, creating new trends, and opening external sites. This article shows how to configure hyperlinks in versions 4.4.4 and later of P2 Explorer.
Read more
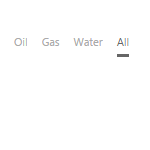
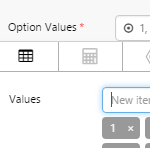
Option Links is similar to a Combo Box, but instead of displaying the options in a drop-down list, it displays them as a line of buttons. This article describes how to configure option links in versions 4.4 and later of P2 Explorer.
Read more
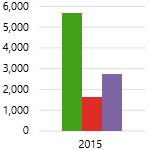
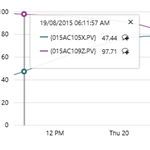
P2 Explorer charts work together with user controls to display source data interactively.
Learn about the different types of chart series, how to configure charts to use different types of data, and how to use variables for controlling charts in run-time.
This article refers to versions 4.4.0.
Read more
Many of the Explorer components are used for displaying data. For example, the data label, charts, the dataset table, target bars, meters.
Learn how to select and define data within Explorer Studio, using the data selector editor, for versions 4.3.2 and earlier of P2 Explorer.
Read more
This article describes how to get a page ready for the tutorials on how to use the components in IFS OI Explorer Studio.
Read more