The Time Windows option in the Explorer Trend extends the capabilities of the trend to associate time windows with event data.
A Time Window is a defined time period of interest and would typically be associated with significant events that have occurred, such as a shut in or downtime event.
Time Windows can be created for any data item: tags, attributes, calculations, or analyses.
Creating a Time Window
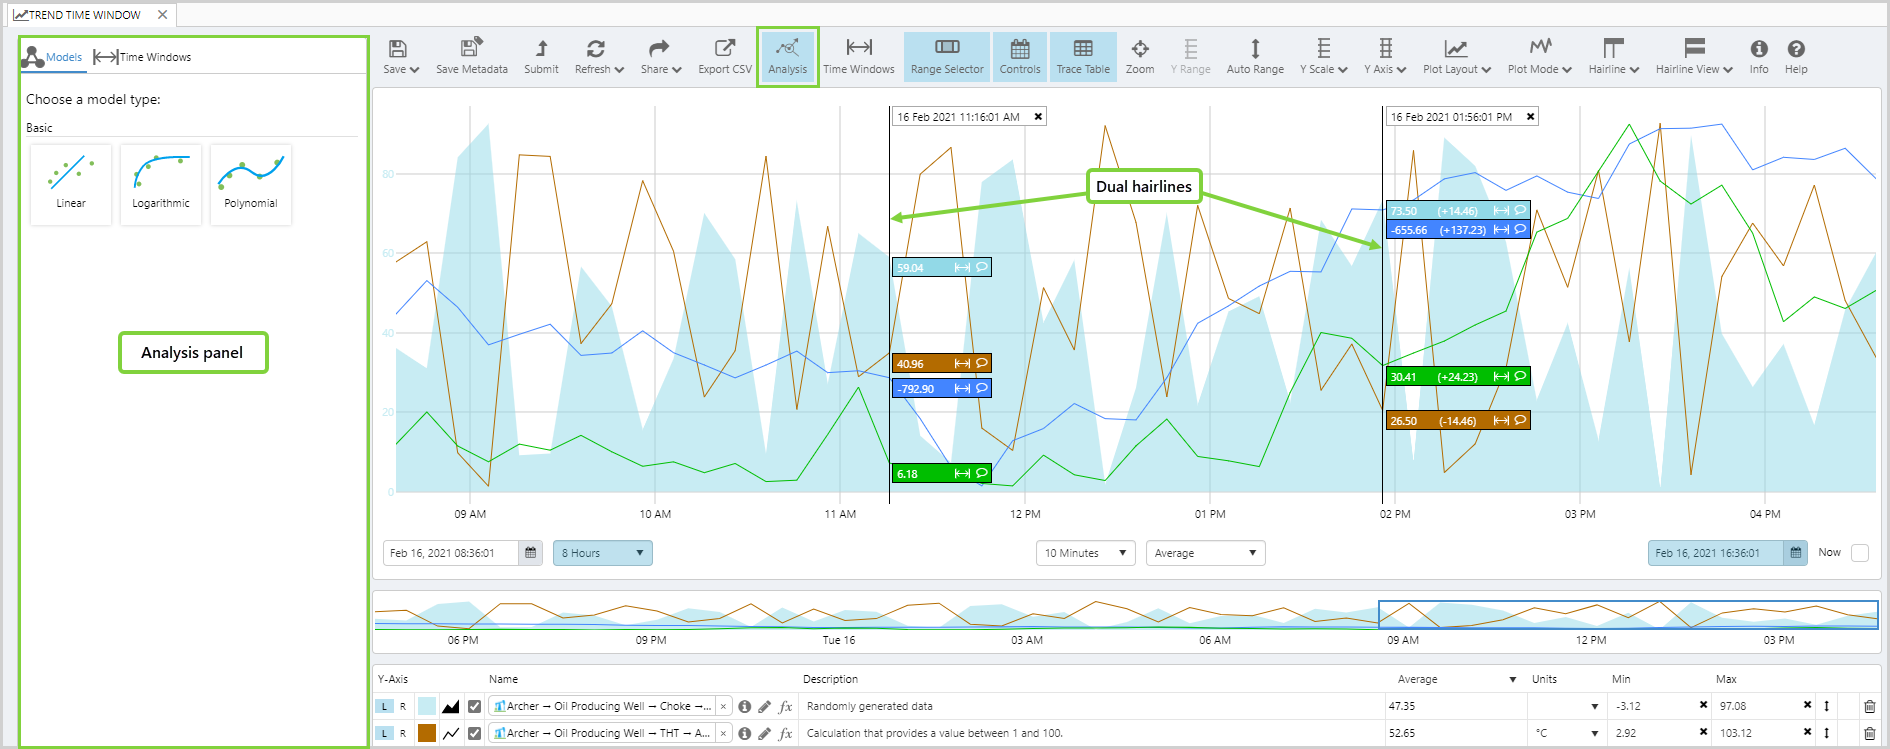
Time Windows are created from the Analysis panel.
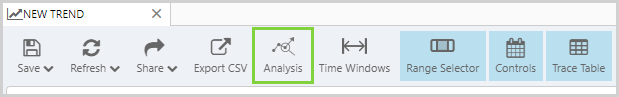
1. On the Trend toolbar, click Analysis. The Analysis panel opens to the left of the Trace Window.
-
- Dual hairlines are automatically added to the trend in the Trace Window.
2. In the Analysis panel, select Time Windows.
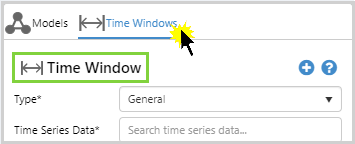
3. In the Time Windows panel, click the Add ![]() button.
button.
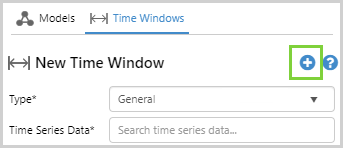
-
- All data items on the trend are automatically added, and the start and end times are set to the hairline times.
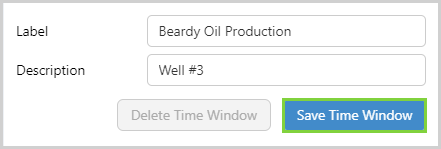
- You may change the data items and start/end time if you wish, and optionally add a label and description to a Time Window.
- Note that End Time is optional, so that ongoing Time Windows can be created.
4. Select Save Time Window. The new Time Window is added to the Time Windows table.
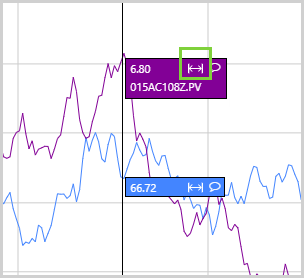
Alternatively, you can click the Time Window ![]() icon in a hairline to open the Time Windows panel. In this instance, only the data item you selected is automatically added to the new Time Window, and the timestamp becomes the Start Time.
icon in a hairline to open the Time Windows panel. In this instance, only the data item you selected is automatically added to the new Time Window, and the timestamp becomes the Start Time.
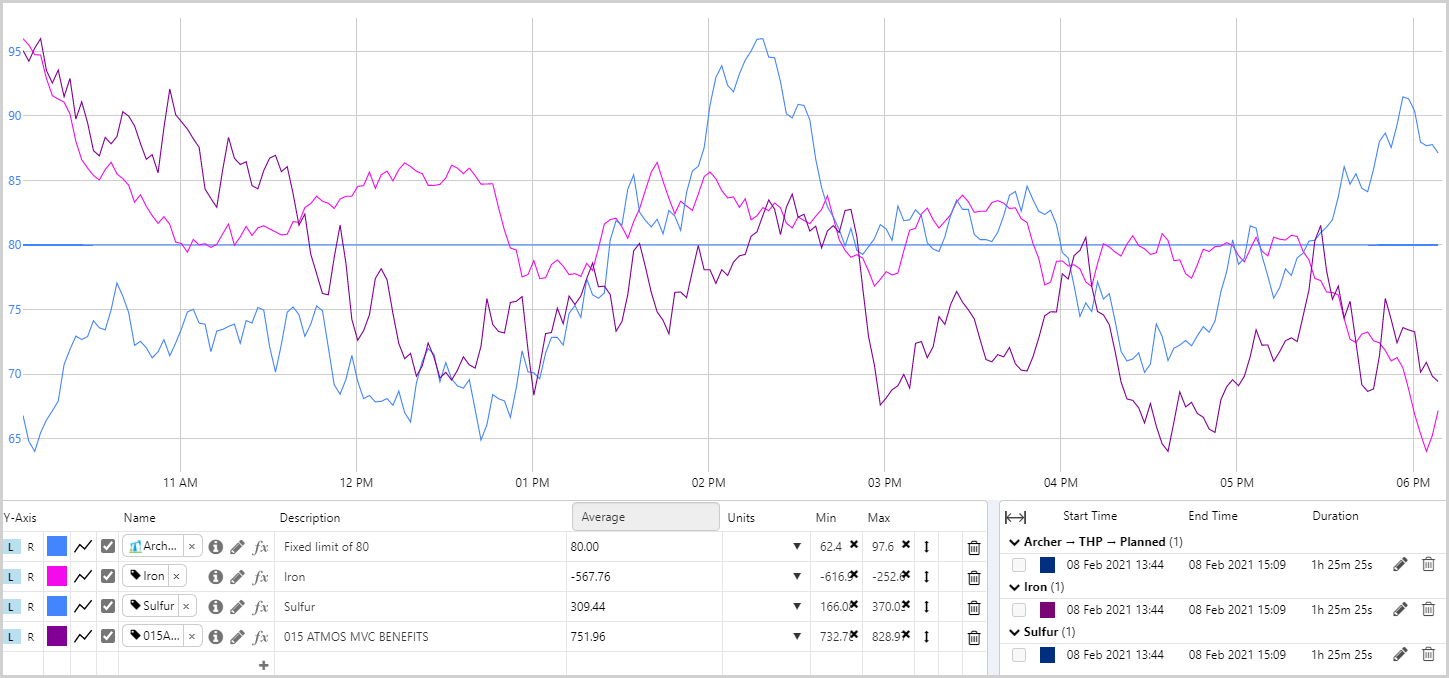
Viewing Time Windows
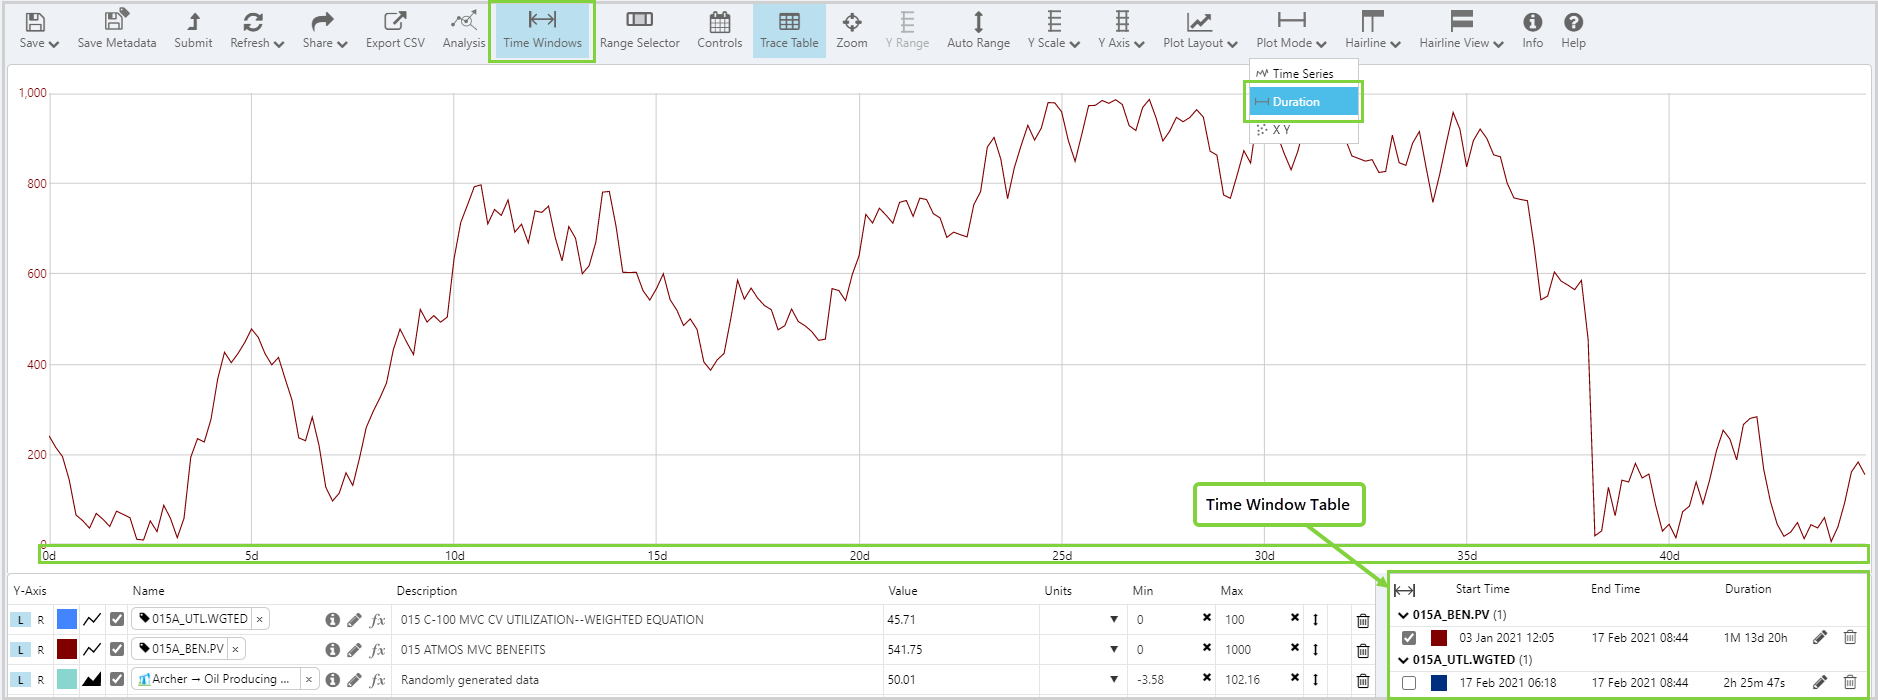
The Duration mode is used to view Time Windows and has the effect of changing the x-axis so that it starts at 0, and represents a period of time, rather than a time range.
When the Duration mode is turned on, Time Windows are automatically enabled, with the Time Windows table being shown to the right of the Trace Table.
The Time Windows table can be toggled on and off by selecting the Time Windows button in the Trend toolbar; it is only displayed if the Trace Table is toggled on.
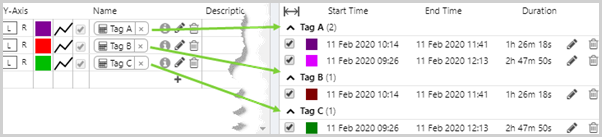
Time Windows can only be shown for data items that have been added to a trend. So if you’ve added Tag A and Tag B to the trend, you will see Time Windows for those tags.
If a tag has multiple associated time windows, they will be grouped with each window in a different shade of the same colour.
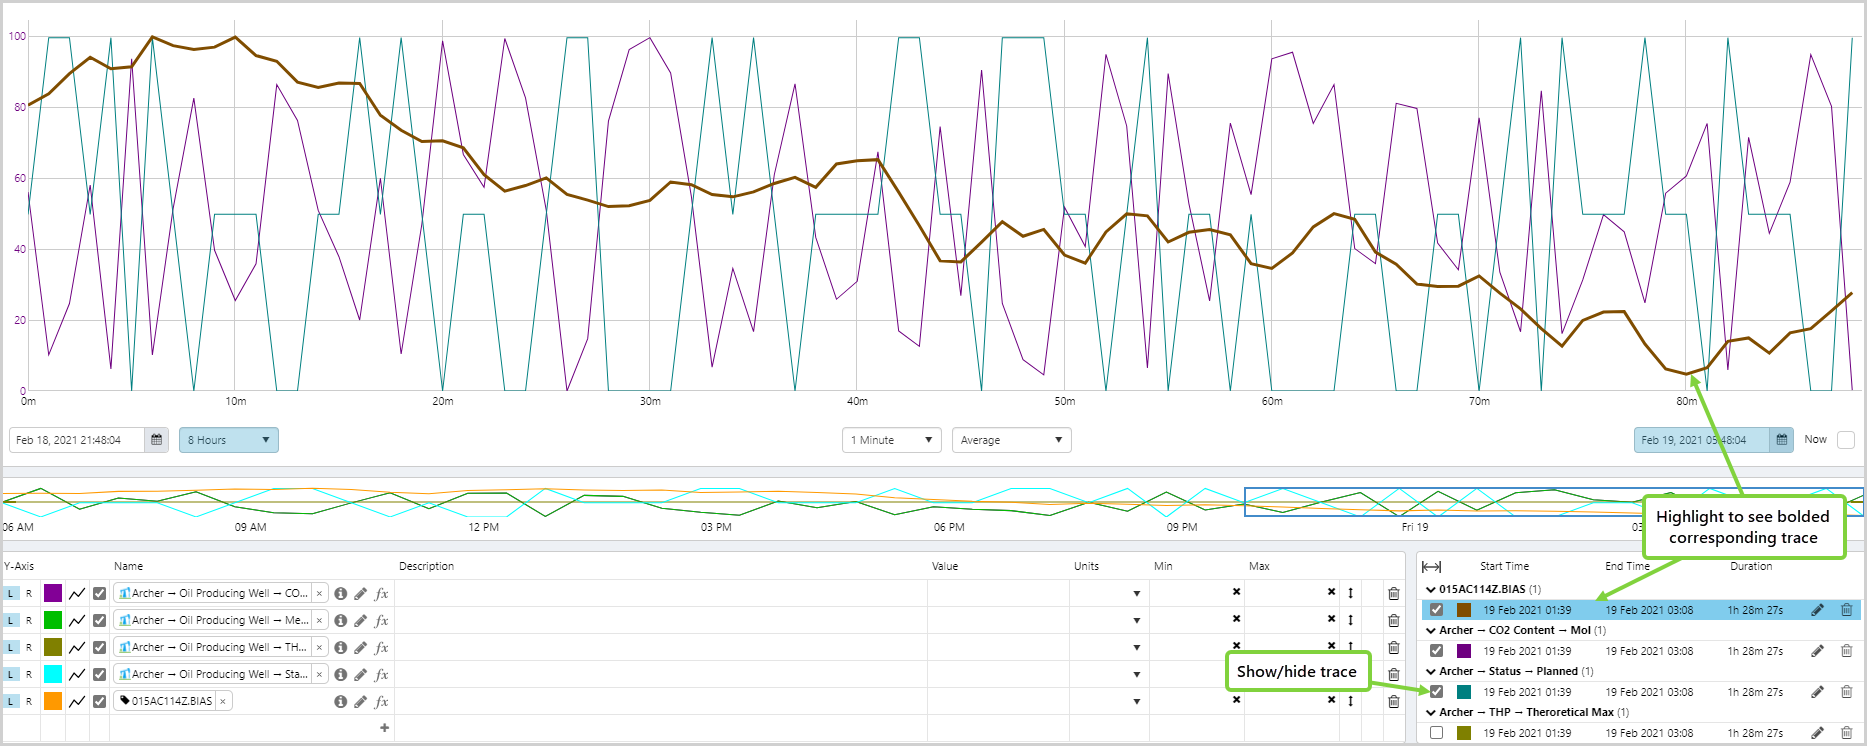
In the Duration mode,
- When you highlight a Time Window in the table, the corresponding trace lines are bolded, for each data item in that time window.
- Select the check box to display that trace.
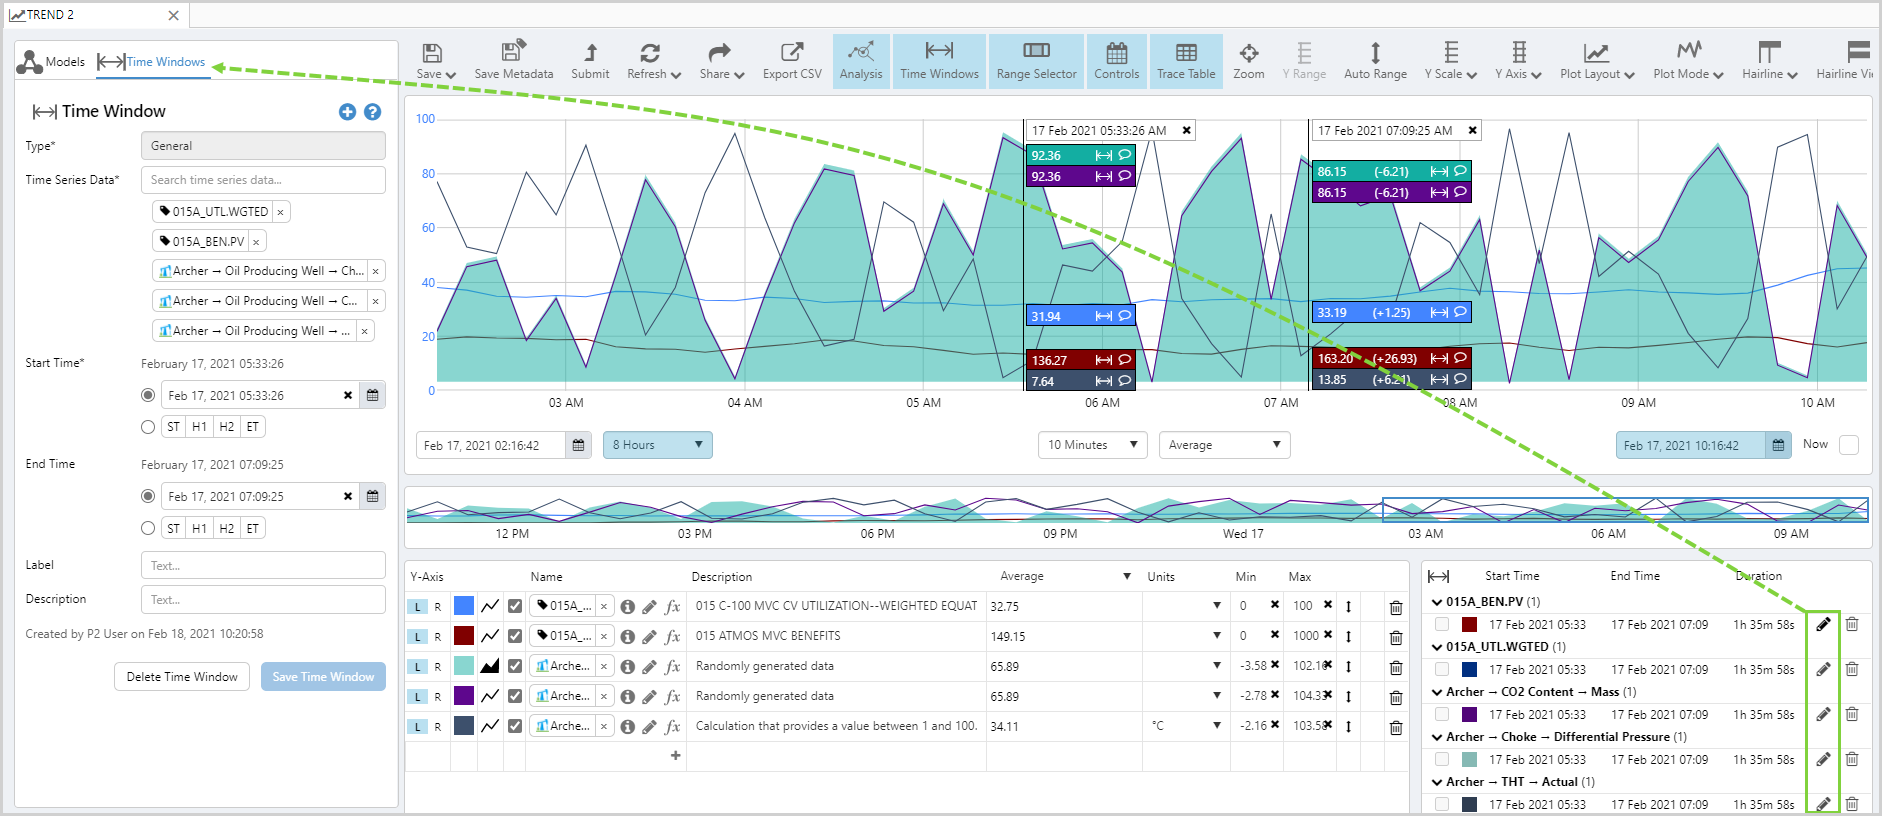
Editing a Time Window
To edit a Time Window, click the Edit ![]() icon next to the data item in the Time Windows table.
icon next to the data item in the Time Windows table.
The Analysis panel will open with the Time Windows tab automatically selected, enabling you to make changes to that Time Window.