The pie chart is a circular chart divided into sectors. Each sector represents a different value, and is sized in proportion to that sector's percentage of the sum of values.
Features of the Pie Chart
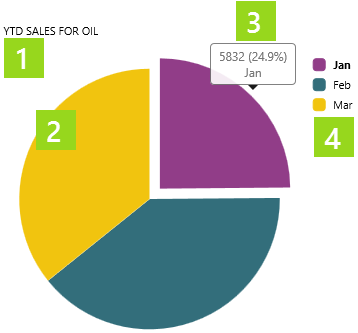
1. A separate label:
An Explorer text label for the chart.
2. Pie segment:
The different pie segments are in proportion to their value as part of the sum of all values, and follow the same order (in a clockwise direction) as the list of legends.
3. Hover for tool-tip, or click for interaction:
Hover over the segment to see its numerical value, percentage of the total, and the legend. (The legend is highlighted as you do this.)
If the pie has been configured to perform actions, then clicking on the segment may cause a change elsewhere on the page - for example, filtering a bar chart by the month represented by this segment.
4. Chart legend:
These have colours and labels corresponding to the different segments. For interactive charts, you can click on a legend.
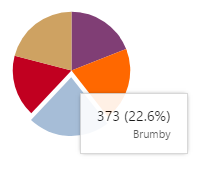
Hover and Selection
When you hover over a pie chart, a tooltip appears showing relevant values, and the segment is extended.
When you click a segment, if the pie chart has been configured to link to other controls on the page, the selected segment can affect the values shown in the other linked controls.
Watch the video below to see how the pie chart sections interact when different months and products are selected, and how a selected pie section changes the bar chart next to it.