Sparklines
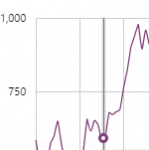
A Sparkline is a small Chart component without gridlines, often used to show data trends amidst text (in a table) or alongside images, labels and lines in a process mimic or schematic. This page explains how to add a sparkline to a page.
Information on something, designed to increase general understanding of that thing.
A Sparkline is a small Chart component without gridlines, often used to show data trends amidst text (in a table) or alongside images, labels and lines in a process mimic or schematic. This page explains how to add a sparkline to a page.
The Box Plot component is used to show the distribution of a set of data, using a Median and Quartiles. Learn how to interpret the representation of data, and find out more about what values are displayed.
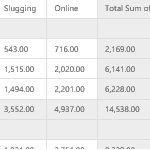
IFS OI Explorer Pivot Tables provide a fast way for you to interactively analyse, summarize and present data in any way you choose.
This article shows you how to use Pivot Tables to sum and group your data by region, period, or any other category from your data, in just a few straightforward steps.
Explorer Charts can be used to represent Continuous Data or Discrete Data. Find out more about the two types, and how to configure each of them.
Search for Pages, Trends or Tags in Explorer, in the Search Page.
You can search for tags by description here, as well as by name.
The Point Detail page shows various details and links for a tag or an attribute value. See how to open the two Point Detail pages: Attribute Value Detail and Tag Detail.
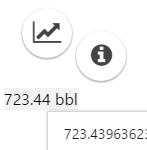
P2 Explorer pages are interactive, allowing you to display labels that can change depending on various selections made on a page. This article describes how labels can change and how to use them to obtain further information from your data.
Although there is no exact formula to making a perfect Explorer page, there are some rules you should follow to make sure your page works well. This page provides a list of best practices to follow when creating a page using Explorer Studio.
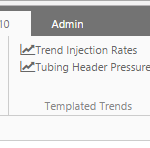
This article explains how to create a templated trend. A link to the trend is added to a template of an entity, so that it appears on an entity's Table of Contents tab on the Explorer ribbon. Tasks are performed in P2 Server as well as P2 Explorer to achieve this.
Tags and attributes have values that can be added to trends or viewed on pages, as is or as part of calculations, to help you diagnose problems and visualise value changes over time.
This article shows you how to navigate or search for entities from a selected hierarchy, and then select attributes, as well as how to search for tags, in versions 4.4.5 and later of P2 Explorer. The article also describes what you can do with tags and attribute values.