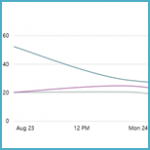
Line Chart (4.3.2)
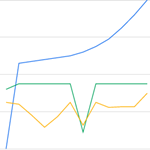
The line chart plots your data in a line.
The line chart plots your data in a line.
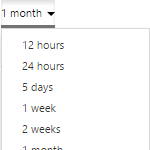
The Duration Picker is used to retrieve data from a selected period. This is usually used to provide a time range for other controls on the page, typically a line chart. This article describes how to add a Duration Picker control to a page during the page design process, in versions 4.3.2 and earlier of P2 Explorer.
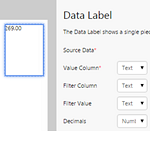
The Data Label displays a single numeric data value, and is often used on schematics when you want to display the value of a single entity attribute. This article describes how to configure a data label, and applies to versions 4.3.2 and earlier of P2 Explorer.
A P2 Explorer chart is made of series. Select the series depending on how you want to display your data.
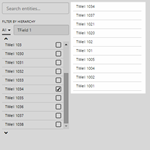
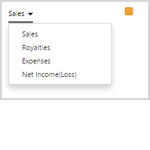
The Selection List shows a list of values where the selection is made by another component. The Selection List must be used in conjunction with another component that publishes a list as an event. This article describes how to configure a selection list, and applies to versions 4.3.2 and earlier of P2 Explorer.
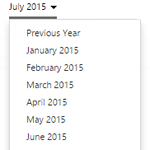
The Month Picker allows a user select a monthly time period. This is usually used to provide a time period for other components on the page, such as a chart. The component publishes the start and end of the month period for use by other components. This article describes how to add a Month Picker control to a page during the page design process, in versions 4.3.2 and earlier of P2 Explorer.
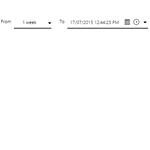
The Date/Time Range Picker provides 2 date/time pickers, and lets the user select two different date/times. These are usually used to provide a start time and end time for other controls on the page, such as a chart or trend. This article describes how to add a Date/Time Range Picker control to a page during the page design process, in versions 4.3.2 and earlier of P2 Explorer.
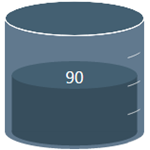
The Tank displays a data value as the percentage fill in a simulated tank shape. This article describes how to configure a tank, and applies to versions 4.4 and later of P2 Explorer.
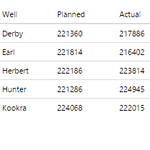
The Dataset Table displays data in a pre-defined tabular format. Configuration settings allows the page designer to select the columns to be displayed in the table. This tutorial guides you through how to add a Dataset Table to a page.
The Status Indicator displays different icons depending on whether set thresholds are reached. It is typically used for presenting KPI data in an easy to digest format. This article describes how to configure a status indicator in versions 4.4.1 and later of P2 Explorer.