Explorer's purpose is to show data on pages and trends. To show data on a page, you first need to add time series or tabular data to your page or trend.
Step 1. Click "Add Data"
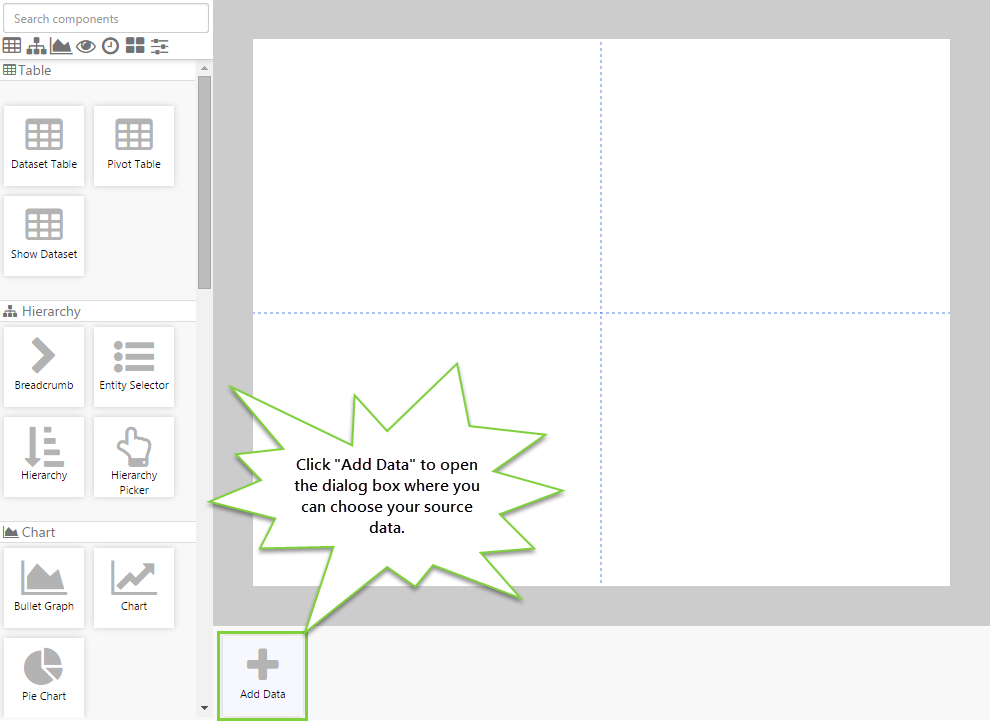
Start by clicking the Add Data button, on the border below your page.
Step 2. Choose Time Series or Tabular data
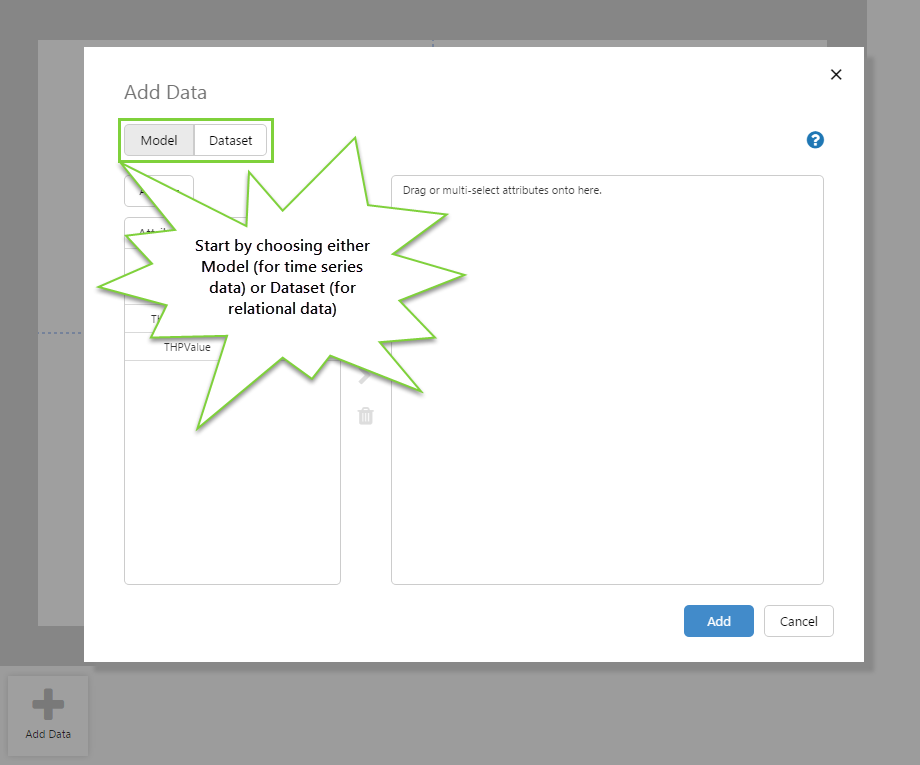
The Add Data window appears. The first thing you need to do is choose whether you want to add time series data or tabular data.
- For time series data which models your assets, choose Model.
- For tabular datasets, choose Dataset.
When you have chosen your data, click Add to add it to the page.
- For instructions on how to add and configure a model, see Add Time Series Data.
- For instructions on how to add and configure a dataset, see Adding a Dataset.
Step 3. Design the Page
Although you can add data at any point while you're designing a page, the data will form the basis for all aspects of your page. So it's a good idea to add this first, so you know what you're dealing with. Once you've done that, go ahead and add the components that will give your data context.
![]() Don’t forget to save your page!
Don’t forget to save your page!