ON THIS PAGE:
Overview
Your dataset uses a datasource to connect to a database or other source of data. You need to add the dataset that you require and then configure the parameters so that you can use the returned data on your page.
A dataset represents the results of a query on a dataset datasource defined in P2 Server. For example, P2 Server may contain an Accounting datasource that connects to an Oracle database. The Accounting datasource may contain several queries that return specific data. The results of these queries are referred to as “datasets”. For example, there may be a dataset for KPI targets and thresholds (AccountingTargets) or sales (AccountingSales).
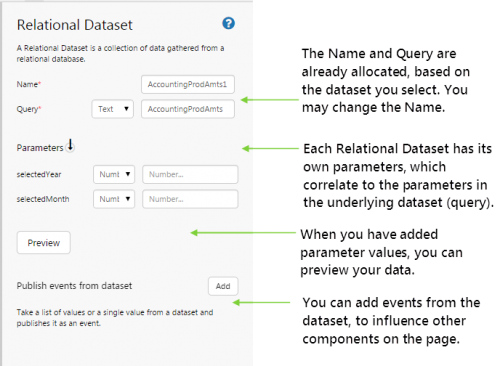
| Name: | The name defaults to the query name, suffixed by a number (1, 2, etc.). |
| Query: |
This is the actual name of the dataset which you select when you add the dataset. You should not change this name. Important! Understanding how the query itself works will go a great way towards alleviating confusion when building your pages. The query that generates the dataset has a significant impact on your results and consequently on how you can configure your controls. If your query “almost” does what you want it to do, sometimes this is not enough to get you the results you want, and you may be better off writing another query. As an example, your query (stored in P2 Server) may be constructed in such a way as to require you to filter data in a certain way when you add the dataset to Explorer, so that your dataset only shows a subset of all available entities. For example, you might have a query with a “name” parameter which is used to filter the entities in the dataset results. If you use this query, your dataset will not list all available entities – it will only list the entities that have been filtered by the “name” parameter. This means that if you want to add, say, a combo box that lists all available entities from the dataset, the combo box will only be able to display the entities that have been filtered by the “name” parameter. |
| Parameters: |
Every dataset has parameters, which are used within the query to filter results. You can set fixed parameters, or use events to set variable parameters. Explorer displays the data type of the parameter, and your parameter (event or actual) must match this (for example Number, Datetime, Text, List etc.). When configuring the parameters of a dataset, it is assumed that you are familiar with the query used by the dataset and what sort of results you expect. Some examples of what your parameters could look like:
Tip: The parameters are case sensitive, so if something doesn't work the way you expect it to, try using different combinations of upper case and lower case. |
| Preview: |
When you have set up the parameters, you should be able to see some data. Clicking Preview runs the query and displays the returned data in a table. You can keep this window open as you build your page. |
| Publish events from dataset: |
You can take a list or a single value from the dataset, and publish this as an event to be used by other controls on the page.
List: Here your event is a list of values, such as when you want to use this list in a combo box. Example: Assign Event Areas, with the values of Column Area, and make the list Distinct (no duplicates). (This will assign the list of areas from the query results, to the Areas event.)
Single: Here your event is a single value from a specified column. This would be a good event to use in a label or as a parameter to another query. Example: Assign Event OilValue, with the value of Column OIL where column Mnth (Filter Column), is equal to Jul (Filter Value).
|
Tutorial Overview
The dataset control is essential for getting data onto your page. In this tutorial we’ll add a dataset from the Explorer Training data datasource to populate a combo box (using the dataset event). We'll use this combo box to display some data on a chart, and then we'll update the chart to display sales data for different products.
This tutorial is quite involved, so we'll do it in 3 parts. Let’s go through this process, step-by-step.
Tutorial 1: Adding a Dataset to Populate a Combo Box
Before you start, open a new tab in Explorer and click the “Create a New Page in Studio Mode” thumbnail. Choose the Grid Layout – you can adjust the rows and columns if you like but it’s not important for this exercise.
If you have access to the training environment, you can follow the steps exactly as outlined here. Otherwise, you will need to adjust the configuration to suit your data.
Step 1. Add a Dataset
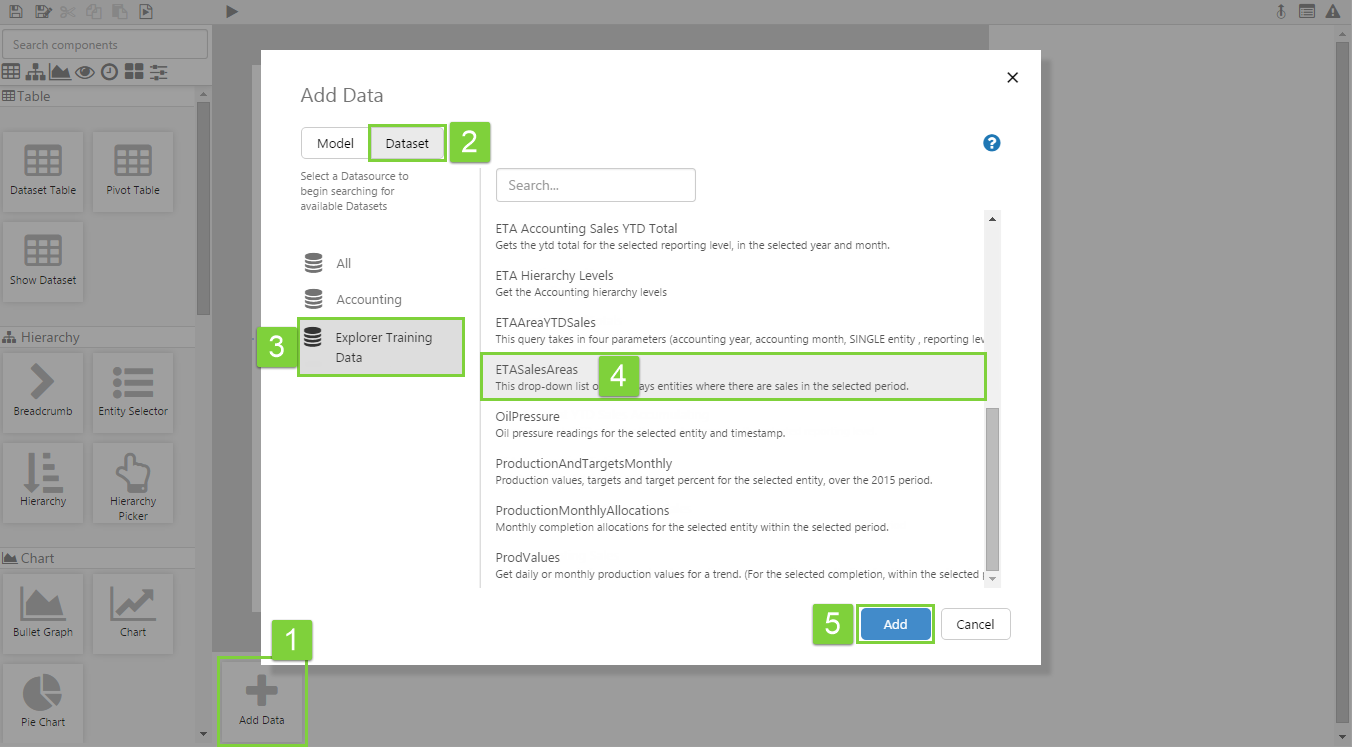
This is the first step to getting your dataset working.
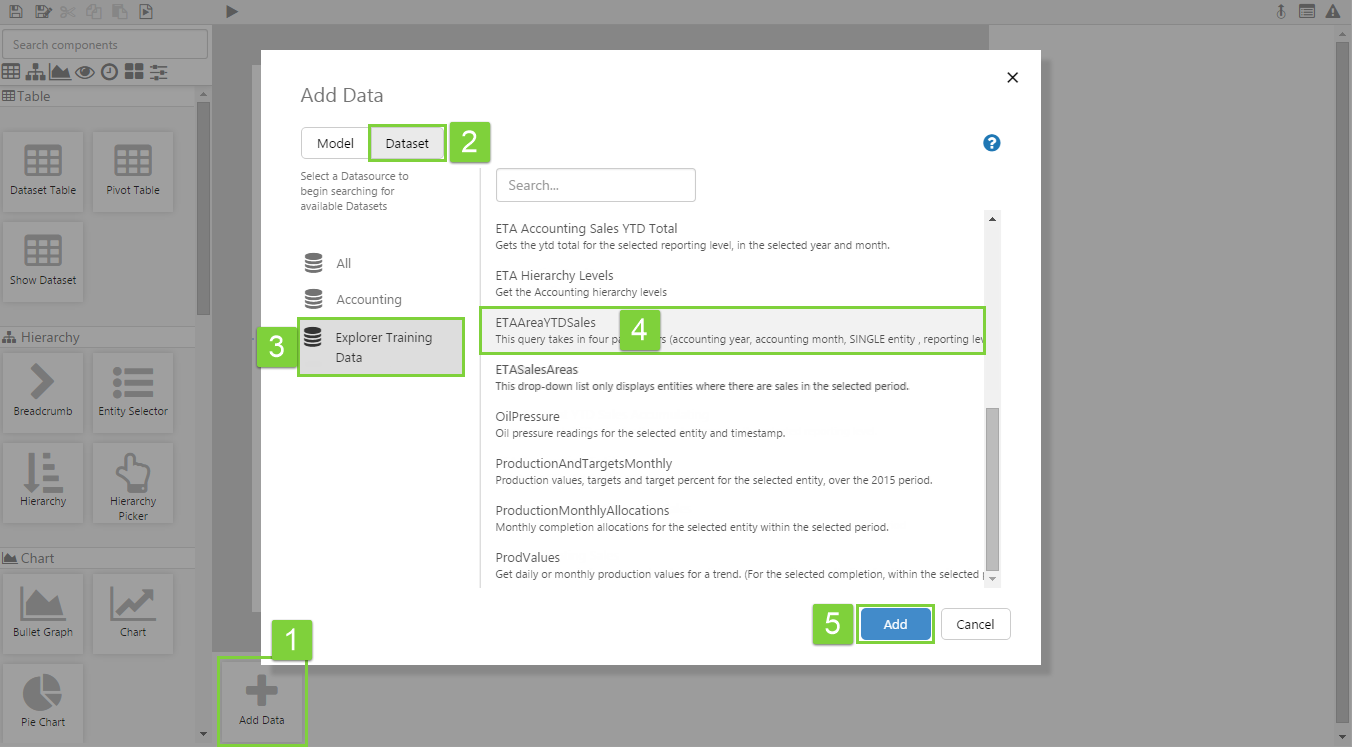
- Click Add Data.
- Select the Dataset option.
- Select the Explorer Training datasource, from the panel on the left.
- Select the ETASalesAreas dataset.
- Click Add.
The configuration panel for the dataset will appear to the left of the canvas, with Name and Query pre-populated.
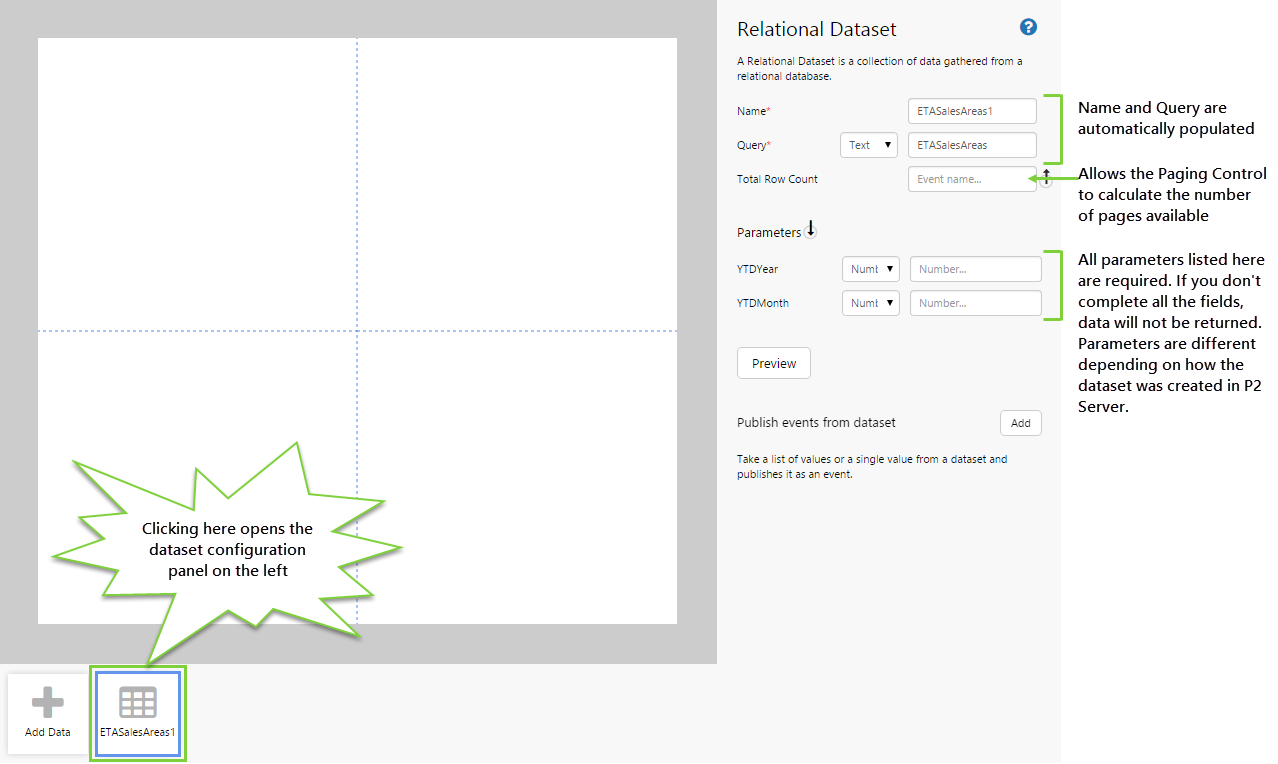
Step 2. Configure the Dataset
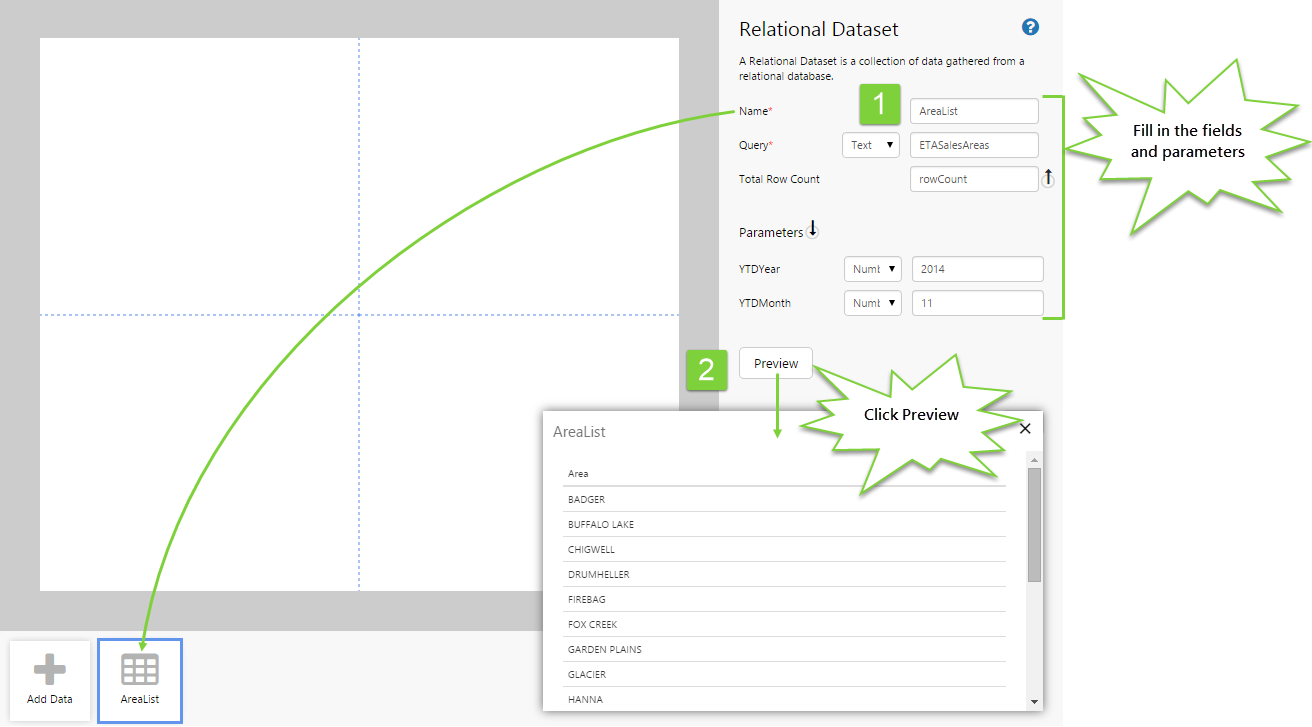
Fill in the fields and parameters as follows:
- Name: AreaList
- Query: keep as is (ETASalesAreas)
- Parameters:
- YTDMonth: (Number) 11
- YTDYear: (Number) 2014
(We've added fixed parameters; you can get these to run off events if you'd prefer.)
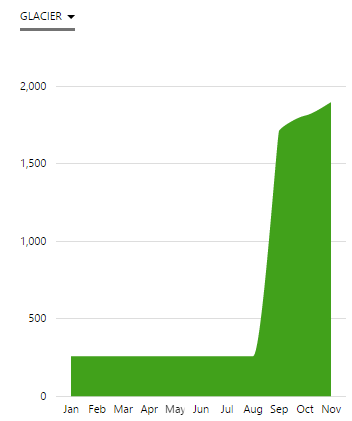
- Click Preview to see what the data looks like. The dataset should return a list of areas.
It's a good idea to always click Preview to make sure you are getting the data you think you are.
Step 3. Publish an Event from the Dataset
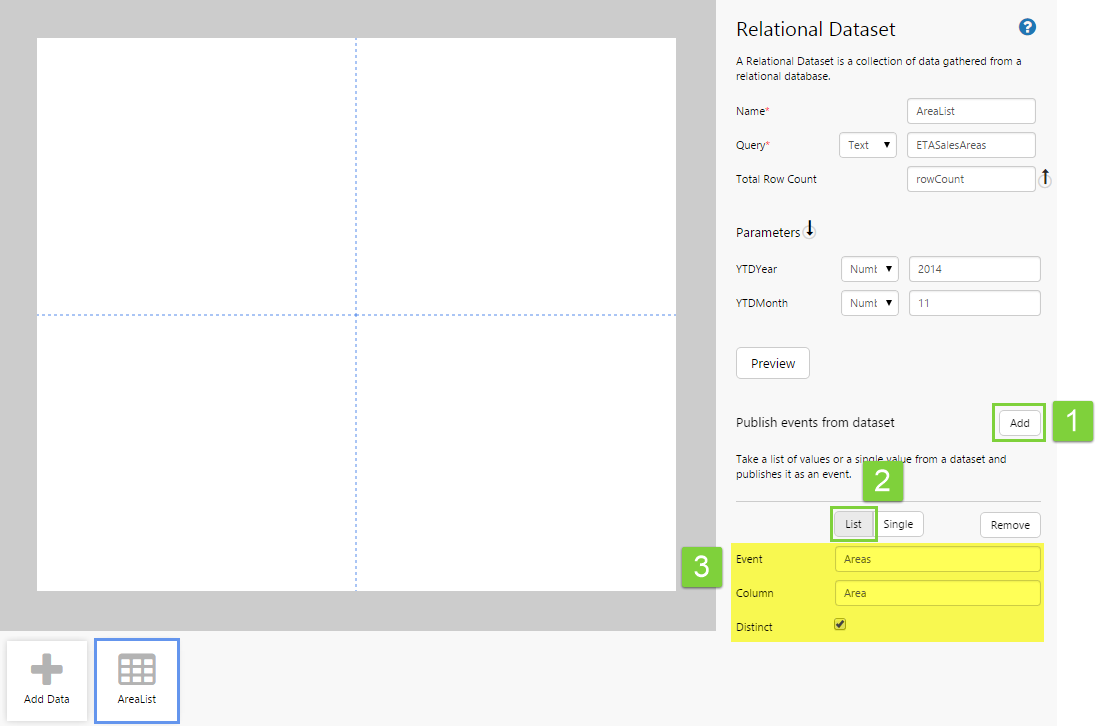
Now that we know we've got some data, we want to display this data in a combo box. A combo box can only display data from a dataset by subscribing to an event. So we'll get this dataset to publish an event that contains a list of values that will populate the combo box.
- In the Publish events from dataset section, click Add.
- Click List.
- Configure the event as follows:
- Event: Areas
- Column: Area (this corresponds to the Area column when you click Preview)
- Select Distinct so that there are no duplicates in the list.
Step 4. Display the Area List in a Combo Box
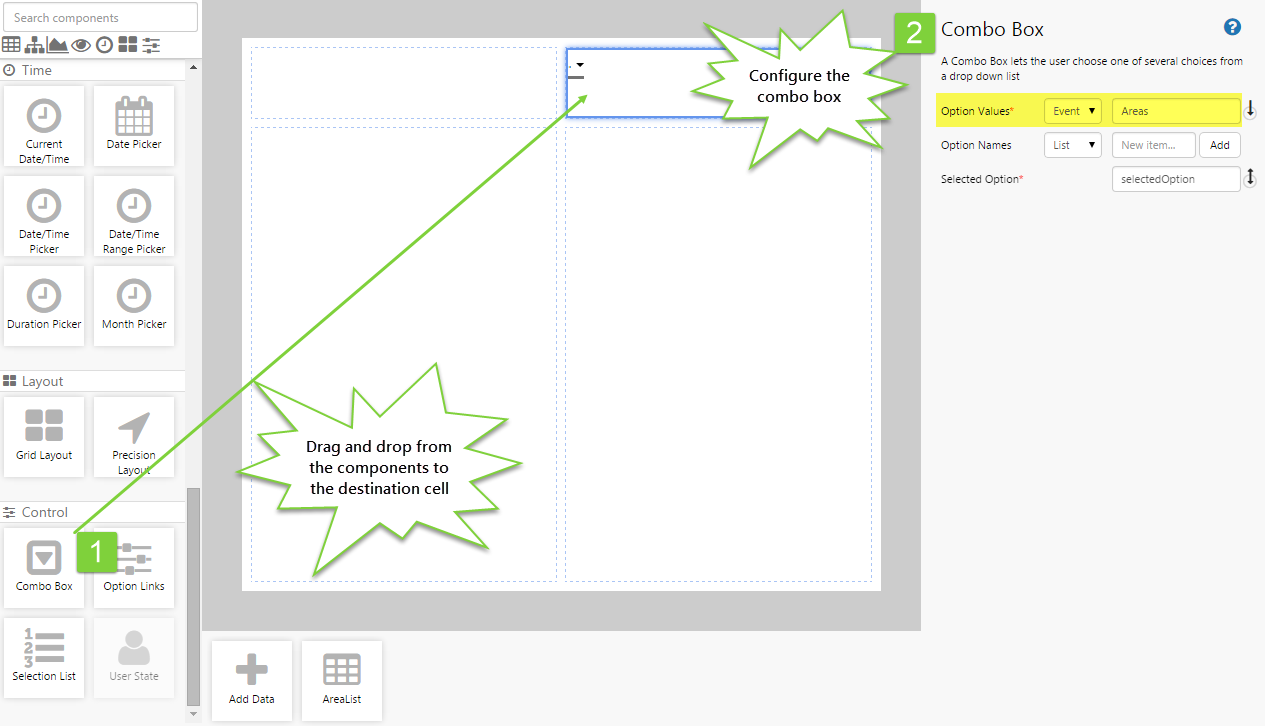
We've now got our event sorted, but we now need to add the combo box to display it.
- Drag and drop a combo box onto a grid cell.
- Configure the combo box as follows:
- Option Values (Event): Areas
- Option Names: (leave blank)
- SelectedOption: selectedOption
Step 5. Add a Default Value for the Event
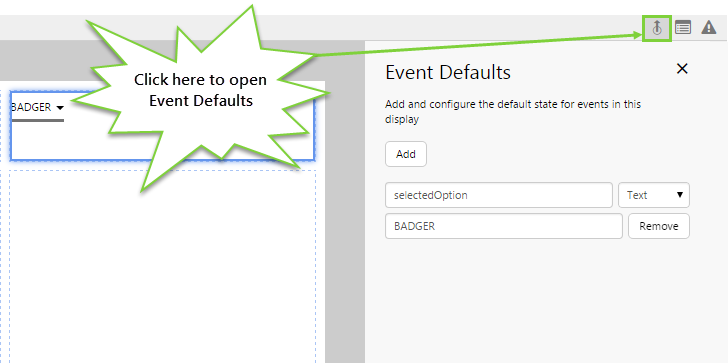
In doing this, we can populate the combo box automatically when the page loads. You can create an event at any time.
- Click the Event Defaults button on the far right side of the Studio toolbar.
- Click Add.
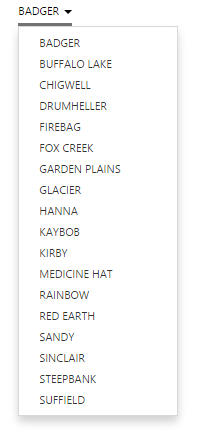
- Add an event called “selectedOption” with a text value of BADGER. (Note that BADGER was one of the values from the AreaList dataset.)
As soon as you add this default, the combo box updates to display the new value.
Step 6. Done!
Congratulations! You have configured a dataset and published an event from it, which populates a combo box.
- Click the preview
 button on the Studio toolbar to see the data displayed from the dataset.
![]() Don't forget to save your page!
Don't forget to save your page!
Tutorial 2: Use the Combo Box to Update a Chart
In the first step-by-step we added a dataset from the Explorer Training data datasource to populate a combo box (using the dataset event). Let's go a step further and use this combo box event as a parameter to another dataset. We'll then display this data in a chart.
Step 1. Add a New Dataset
First, let's add the 2nd dataset we will be working with.
- Click Add Data.
- Select the Dataset option.
- Select the Explorer Training datasource, from the panel on the left.
- Select the ETAAreaYTDSales dataset.
- Click Add.
Step 2. Configure the Dataset to Use the Combo Box Event as a Parameter
We want to add a different dataset that contains our sales data. But we only want to show the data for the area selected by the combo box. To do this, we add the event published by the combo box as an input parameter for this dataset. Configure the dataset as follows:
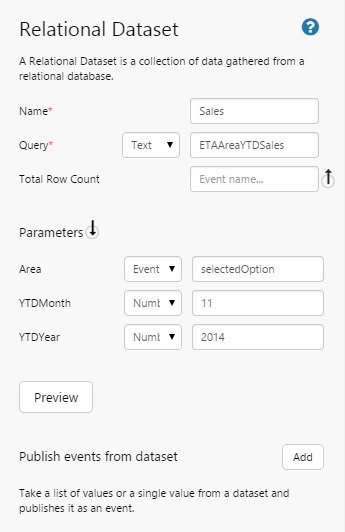
- Name: Sales
- Query: (keep as is)
- Parameters:
- Area: (Event) selectedOption
- YTDMonth: (Number) 11
- YTDYear: (Number) 2014
Note that we've specified selectedOption as the event that drives the Area parameter.
- Click the preview button on the Studio toolbar to see the data displayed from the dataset.
Step 3. Add a Chart to Show YTD Sales
Let's add a Chart to display our data.
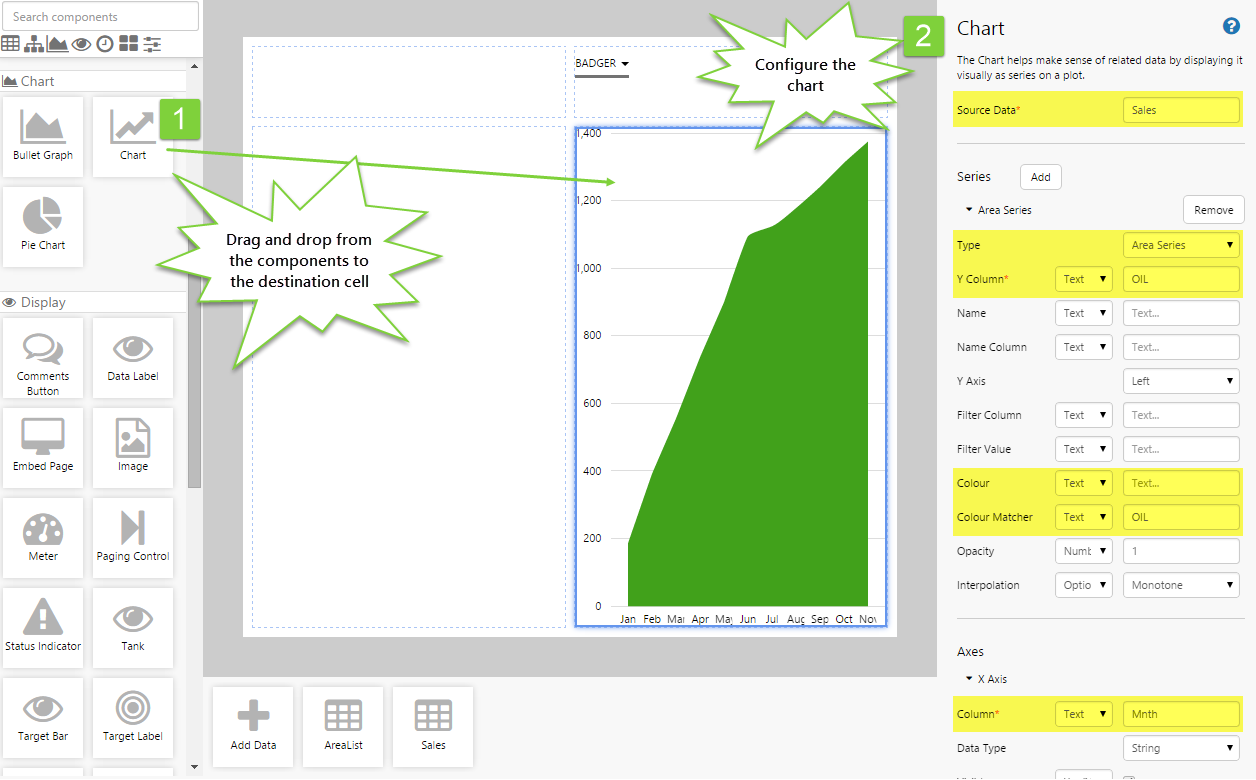
- Drag and drop a chart onto another cell on the page, and configure an area chart as follows.
- Source Data: Sales
-
- Series:
- Type: Area Series
- Y Column: (Text) OIL
- Colour: (Text) remove the default and keep blank.
- Colour Matcher: (Text) OIL
- Axes:
- X Axis
- Column (text): Mnth
- X Axis
- Series:
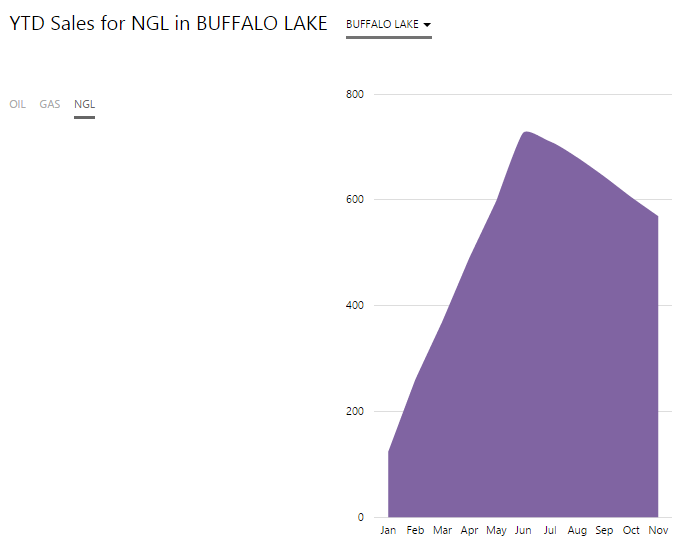
Step 4. Done!
Congratulations! You have configured the two datasets so that you can see the available areas in a combo box, and you can view YTD Sales from a selected area.
- Click the preview button on the Studio toolbar to see what your page will look like in run-time.
- Try selecting various areas from the combo box to see the chart change.
![]() Don't forget to save your page!
Don't forget to save your page!
Tutorial 3: Use Option Links to Update the Chart
In the first tutorial we added a dataset from the Explorer Training data datasource to populate a combo box (using the dataset event). In the next one, we went a step further and used this combo box event as a parameter to another dataset for display in a chart. Now we'll add another dimension, and change the chart so that it display either oil, gas, or NGL sales for the area selected in the combo box.
Step 1. Add an Event Default
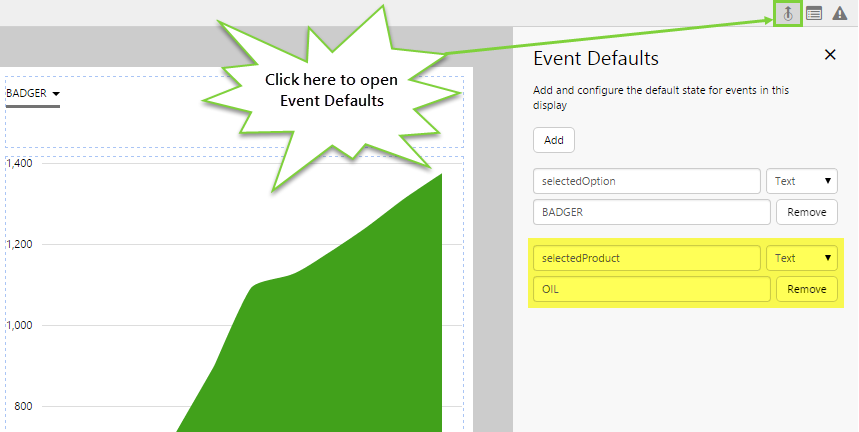
Firstly, let's add an event default that represents the product that will be chosen by the Option Links.
- Click the Event Defaults button on the far right side of the Studio toolbar.
- Click Add.
- Add an event called “selectedProduct” with a text value of OIL.
Step 2. Add a Label
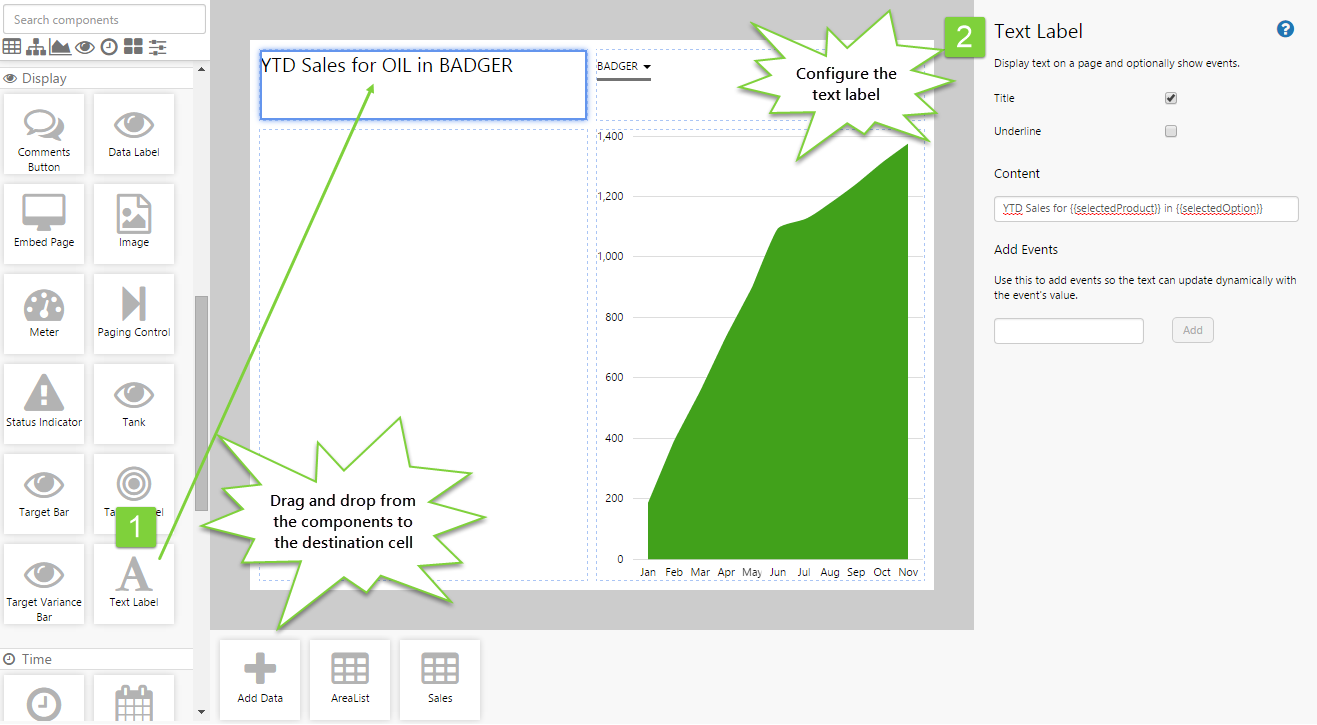
Let's add a text label for the title of the page, and let's use it to display the selected options from the combo box and option links.
Drag and drop a Text Label component into a cell on the page, and configure it as follows:
- Title: Selected
- Content: YTD Sales for {{selectedProduct}} in {{selectedOption}}
Step 3. Add Option Links
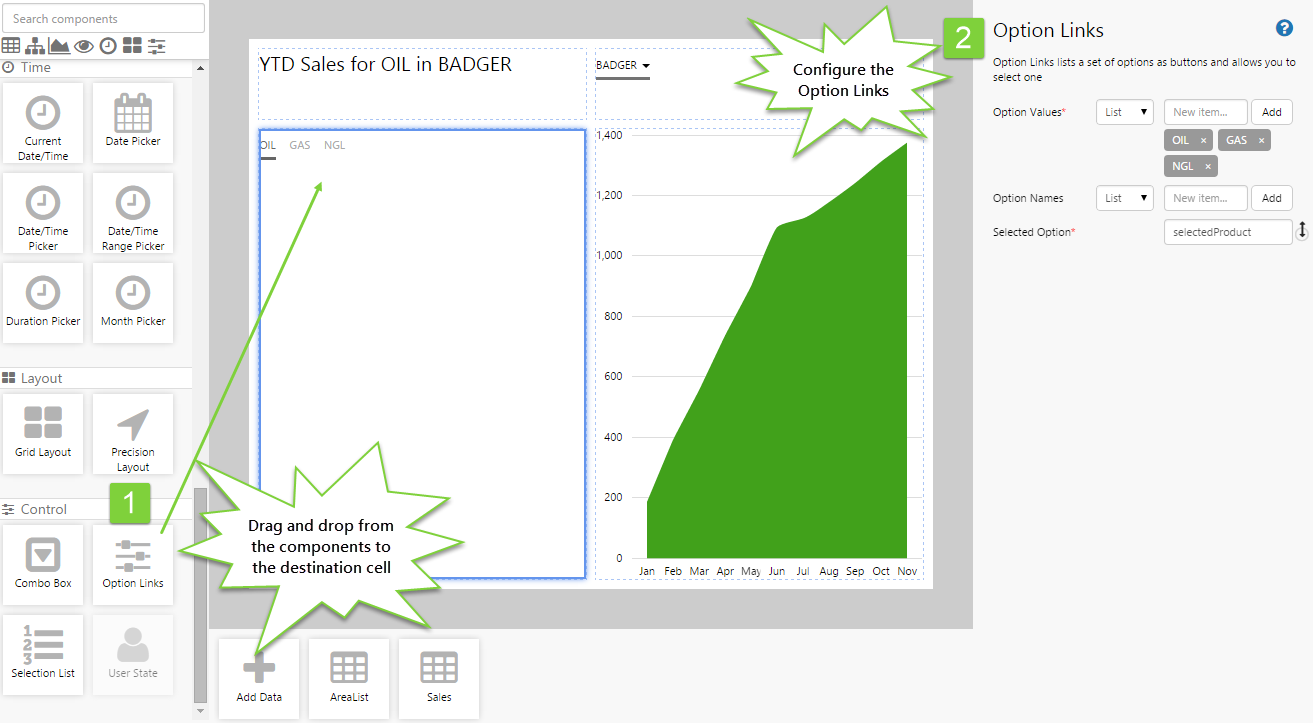
Let's add an Option Links component that will allow the user to select Oil, Gas, or NGL. The user's selection will be reflected in the text label we just added.
- Drag and drop an Option Links component onto another cell, and configure it as follows:
- Option Values: (List) OIL, GAS, NGL
- Selected Option: selectedProduct
Step 4. Modify the Chart Configuration
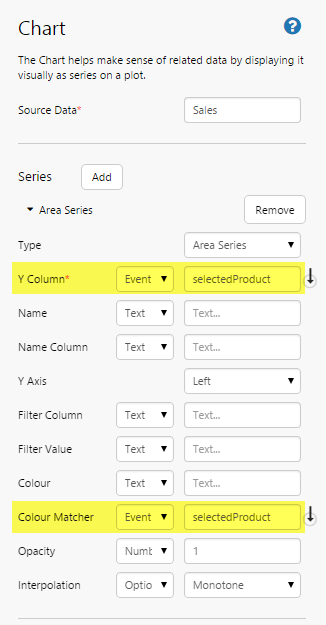
Remember that up to this point, the chart has been configured to only show oil sales. We now have to change this so that it can also display sales for gas and NGL. This will be done by using the SelectedProduct event in place of text for the Y Column and the Colour Matcher.
- Click the chart component and reconfigure it as follows:
- Series:
- Y Column: (Event) SelectedProduct
- Colour Matcher: (Event) SelectedProduct
- Series:
Don't forget to change from Text to Event, this is a common oversight.
Step 5. All done!
Congratulations! You have configured two datasets so that you can see the available areas in a combo box, and you can view YTD Sales from a selected area and for a selected product.
- Click the preview button on the Studio toolbar, to see what your page will look like in run-time.
- Try selecting various areas from the combo box, and select the different options (OIL, GAS, NGL) to see the chart change.
![]() Don't forget to save your page!
Don't forget to save your page!