ON THIS PAGE:
Overview
Your dataset uses a datasource to connect to a database or other source of data. You need to add the dataset that you require and then configure the parameters so that you can use the returned data on your page.
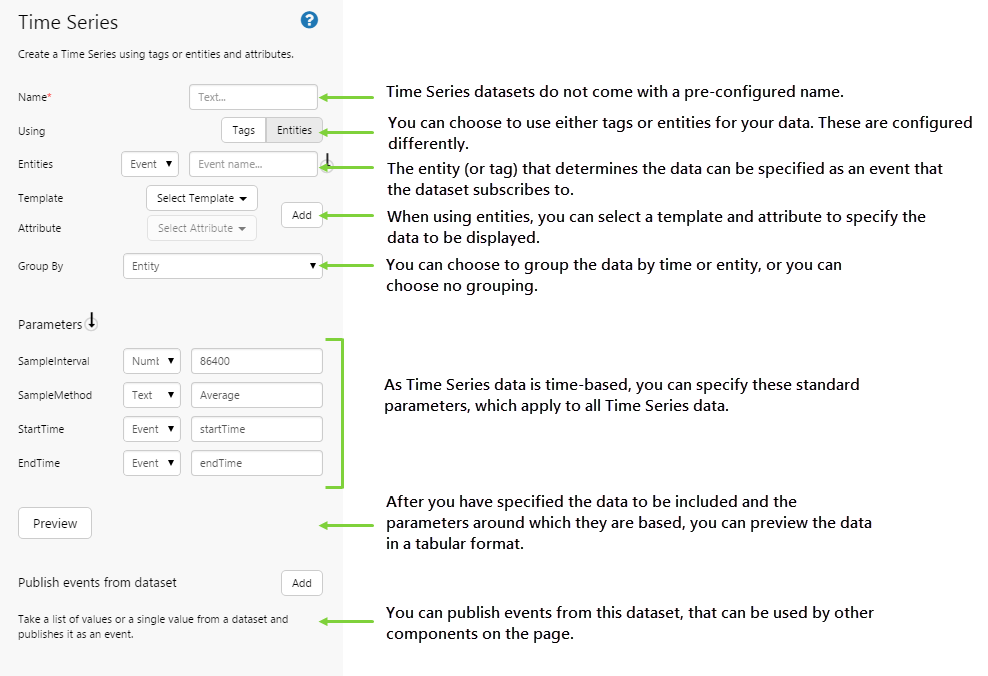
| Name: | Unlike tabular datasets where the name is based on an SQL query, Time Series data does not have a default name. You should give the data an appropriately descriptive name. |
| Using: | Time Series data can be based on either tags or entities. |
| Tags: |
Specify one or more tags for which to display data. You can choose the list these tags explicitly or you can subscribe to an event. |
| Entities: |
Specify one or more entities for which to display data. You can choose the list these entities explicitly or you can subscribe to an event. You can further restrict the entities to ones that are associated with a specific template (e.g. Oil Producing Well) and that have a specific attribute (e.g. tubing head pressure). |
| Group by: |
You can choose to group the data by time or entity, or you can choose no grouping. |
| Parameters: |
Parameters are used to provide the time series data with boundaries that determine the type of data and the frequency with which it is returned. SampleInterval: The frequency with which the data is collected. This is a number that is specified in seconds. SampleMethod: The way in which data is selected from a continuous stream. Available options:
StartTime: Only data between (and including) the specified start and end times will be returned. EndTime: Only data between (and including) the specified start and end times will be returned. |
| Preview: |
After you have specified all your settings and parameters, you should be able to see some data. Click Preview to display the data in a table. You can keep this window open as you build your page. |
| Publish events from dataset: |
You can take a list or a single value from the dataset, and publish this as an event to be used by other controls on the page.
List: Here your event is a list of values, such as when you want to use this list in a combo box. Example: Assign Event Areas, with the values of Column Area, and make the list Distinct (no duplicates). (This will assign the list of areas from the query results, to the Areas event.)
Single: Here your event is a single value from a specified column. This would be a good event to use in a label or as a parameter to another query. Example: Assign Event OilValue, with the value of Column OIL where column Mnth (Filter Column), is equal to Jul (Filter Value).
|
Tutorial
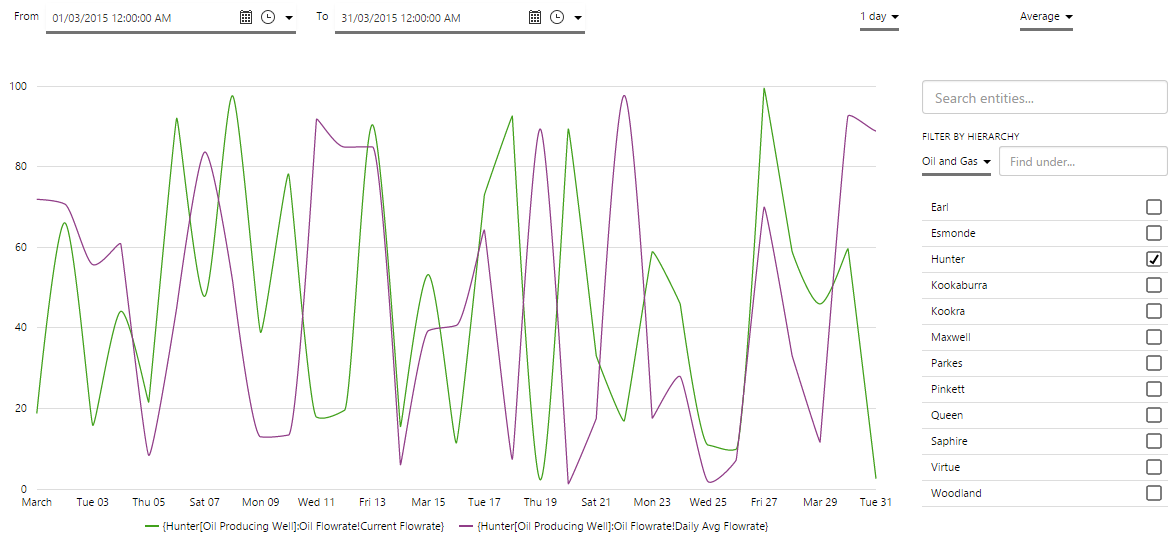
Time Series data is used to display real-time data on a page, and is useful in live monitoring situations. In this tutorial we’ll add Time series data for a well to a line chart. We'll also add components that allows the user to change the time range, sample interval, sample method, and the well being monitored.
This tutorial is quite involved, so we’ll do it in 2 parts. Let’s go through this process, step-by-step.
Step by Step 1: Adding Time Series Data and Events
Before you start, open a new tab in Explorer and click the “Create a New Page in Studio Mode” thumbnail. Choose the Grid Layout – you can adjust the rows and columns if you like but it’s not important for this exercise.
You will need to adjust the configuration to suit your data at your site.
Step 1. Add Time Series Data
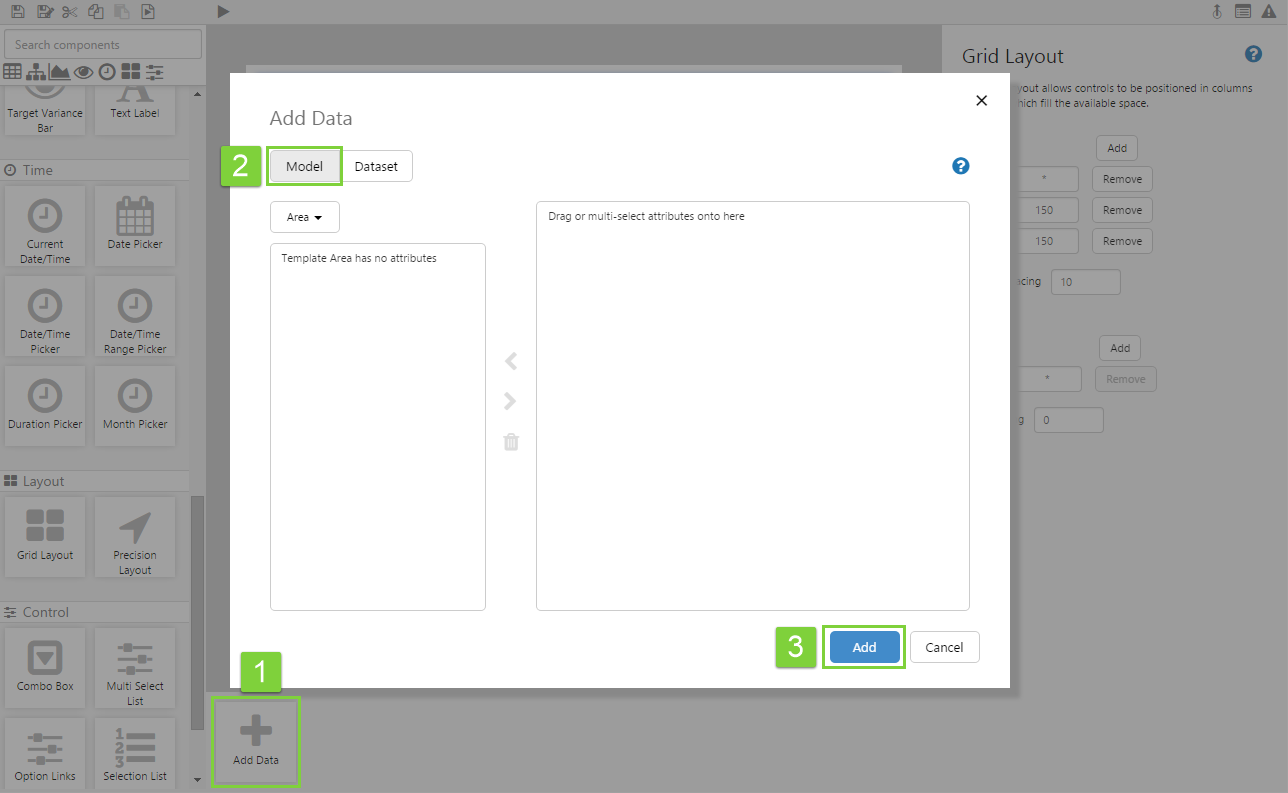
This is the first step to adding time series data.
- Click Add Data.
- Select the Model option.
- Click Add.
The configuration panel for the time series data will appear to the left of the canvas, with the parameters pre-populated.
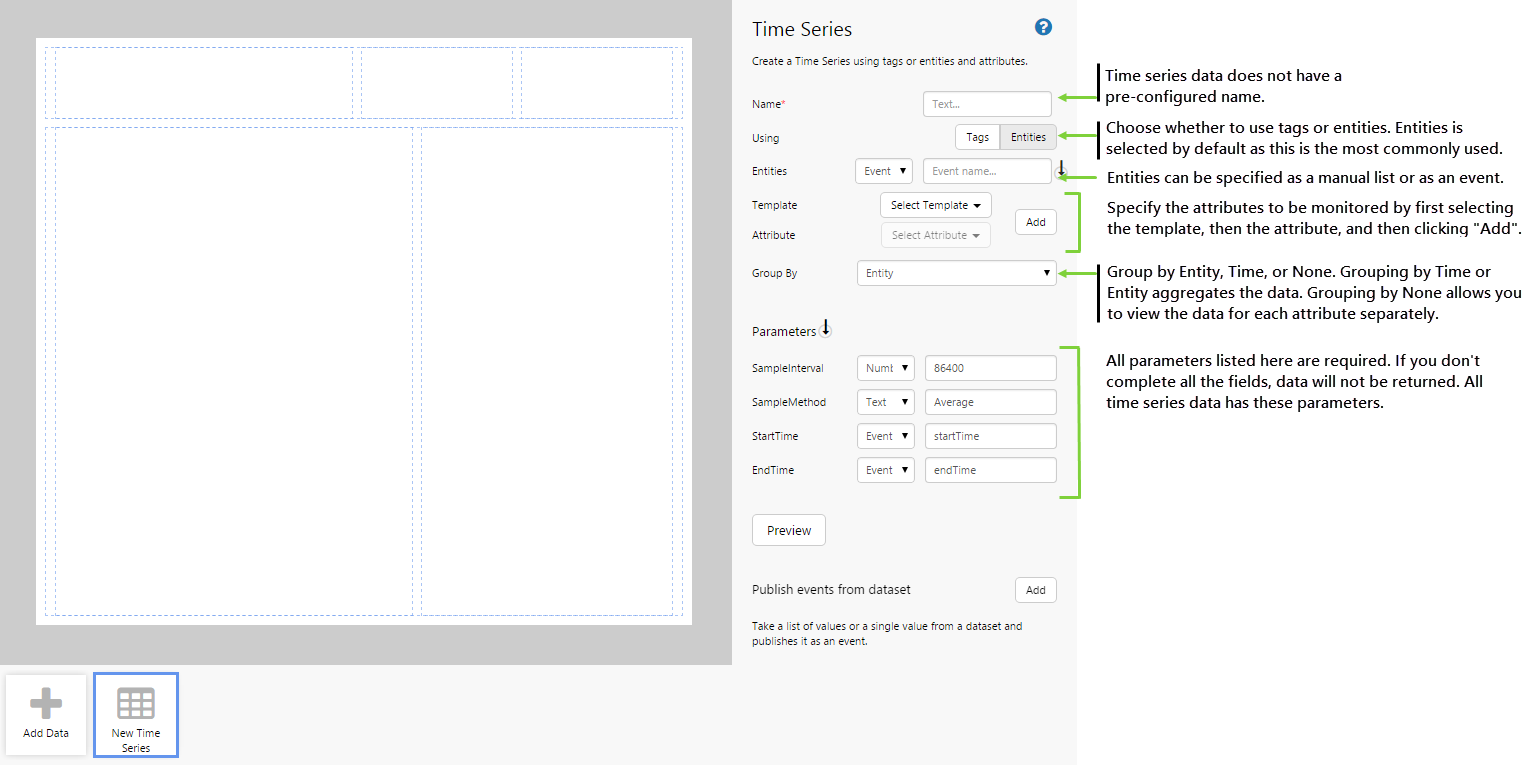
Step 2. Configure the Time Series Data
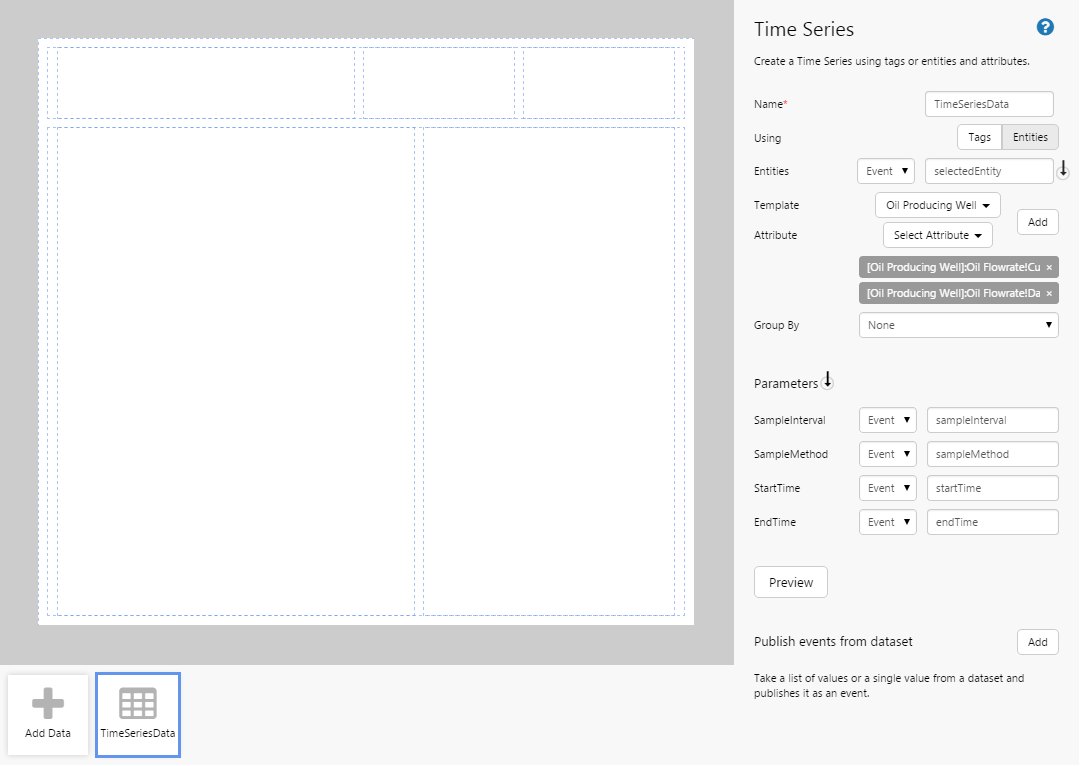
Fill in the fields and parameters as follows:
- Name: TimeSeriesData
- Using: Entities
- Entities: (Event) selectedEntity
Templates and Attributes are specified slightly differently. First you need to select the template, then select the attribute, and then click Add. Repeat this to add multiple attributes. Let's add the first attribute.
- Template: Select "Oil Producing Well"
- Attribute: Select "Current Flowrate" (grouped under "Oil Flowrate")
- Now click Add.
Now let's add the 2nd attribute.
- Template: Select "Oil Producing Well" (this should still be selected after you've added the 1st attribute)
- Attribute: Select "Daily Avg Flowrate" (grouped under "Oil Flowrate")
- Now click Add.
Now let's complete the remaining fields.
- Group By: None
- SampleInterval: (Event) sampleInterval
- SampleMethod: (Event) sampleMethod
- StartTime: (Event) startTime
- EndTime: (Event) endTime
It’s a good idea to always click Preview to make sure you are getting the data you think you are. At this point, however, we need to specify some event defaults before the data will appear.
Step 3. Add Default Values for the Events
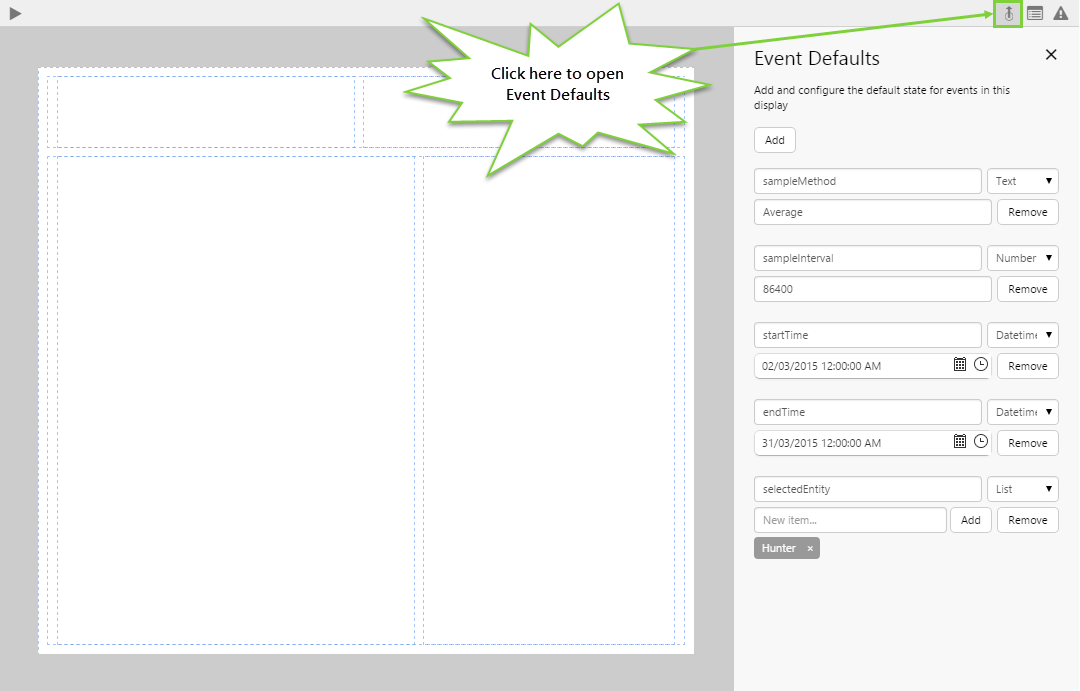
Adding default values allows the components in the page to display default data and selection values. In doing this, we can populate combo boxes automatically when the page loads, and avoid having an empty page. You can create an event at any time, but let's do this now.
- Click the Event Defaults button on the far right side of the Studio toolbar.
- Click Add.
- Add an event called “sampleMethod” with a Text value of Average.
- Add an event called "sampleInterval" with a Number value of 86400 (this is the number of seconds in a day).
- Add an event called "startTime" with a Datetime value of 02/03/2015 12:00:00 AM.
- Add an event called "endTime" with a Datetime value of 31/03/2015 12:00:00 AM.
- Add an event called "selectedEntity" with a List value of Hunter.
Step 4. Done!
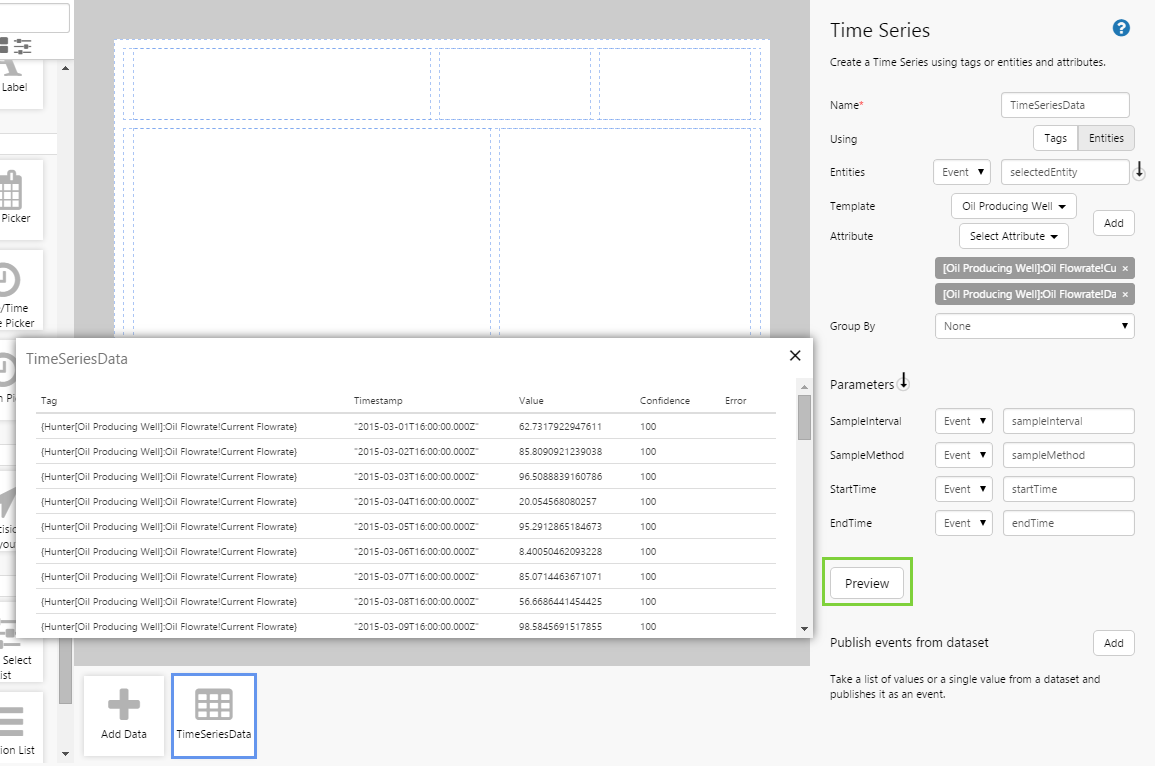
Congratulations! You have configured some Time Series data and some default events.
- Go back to the Time Series data and click the preview
 button to see the data in a table format.
![]() Don’t forget to save your page!
Don’t forget to save your page!
Step by Step 2: Adding Components to the page
In the first step-by-step we added some Time Series data and configured some event defaults. Let’s finish off the page by adding some components. First we’ll add a chart so we can see the default data in action, and then we'll add some controls so the user can manipulate the data.
Step 1. Add a Chart
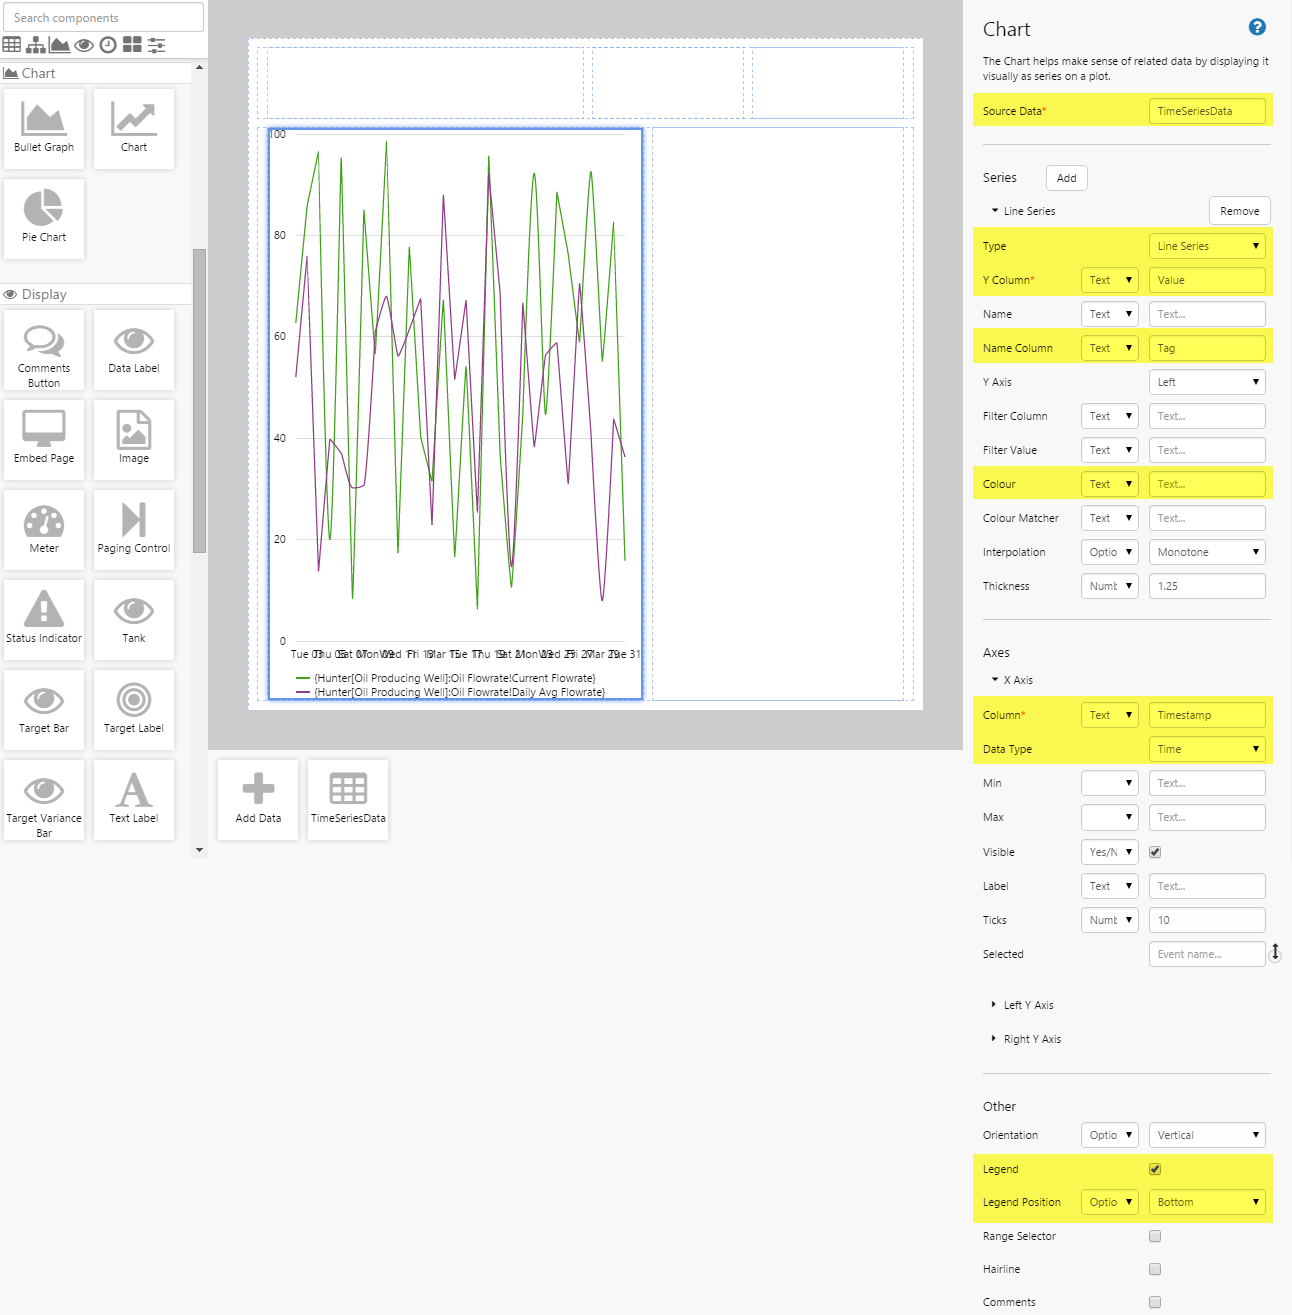
Let’s add a Chart to display our data. Drag and drop a Chart component onto another cell on the page. Configure a line chart as follows.
- Source Data: TimeSeriesData
- For the chart series:
- Type: Line Series
- Y Column: (Text) Value
- Name Column: (Text) Tag
- Colour: (remove the default and keep blank)
- For the X Axis:
- Column (Text): Timestamp
- Data Type: Time
- Other:
- Legend: (select this check box)
- Legend Position: (Options) Bottom
Step 2. Add and Configure an Entity Selector
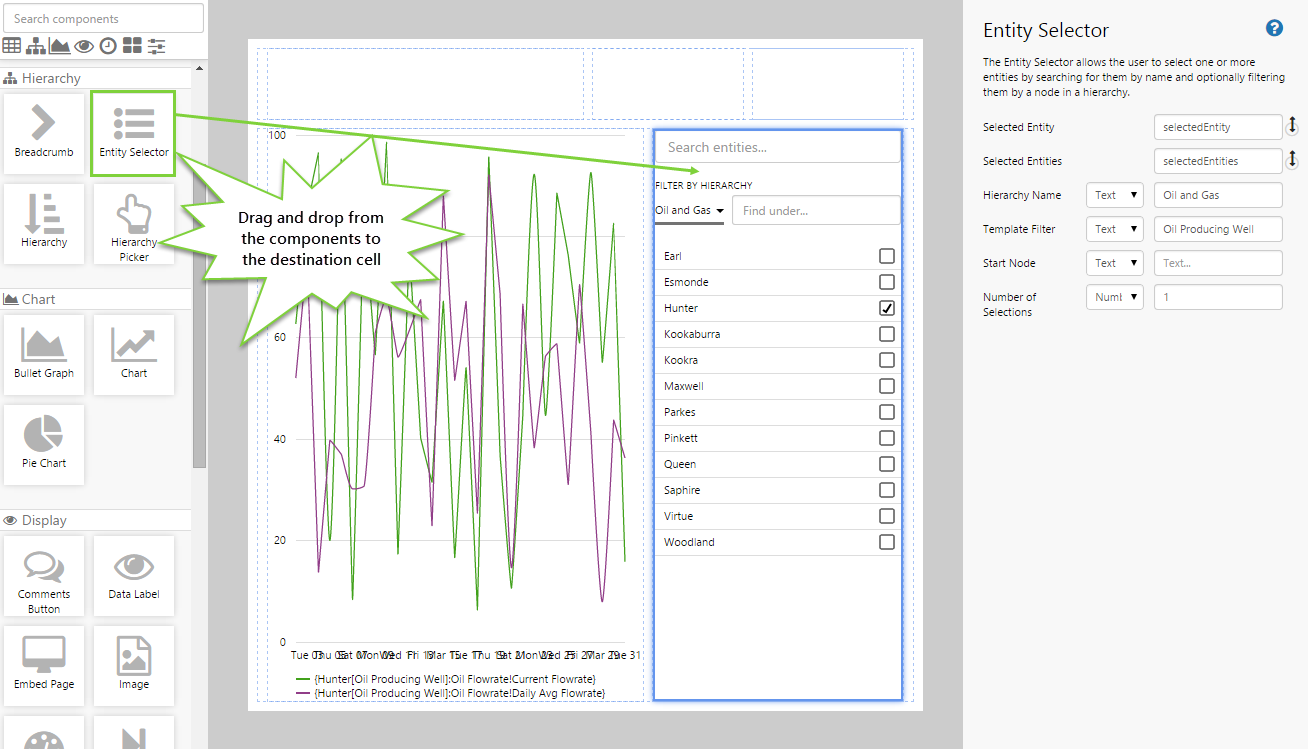
This step allows the user to select the well to display time series data for.
- Drag and drop the Entity Selector control onto the canvas.
- Configure it as follows:
- Selected Entity: selectedEntity
- Hierarchy Name: (Text) Oil and Gas
- Template Filter: (Text) Oil Producing Well
- Number of Selections: 1
Step 3. Add and Configure a Date/Time Range Picker
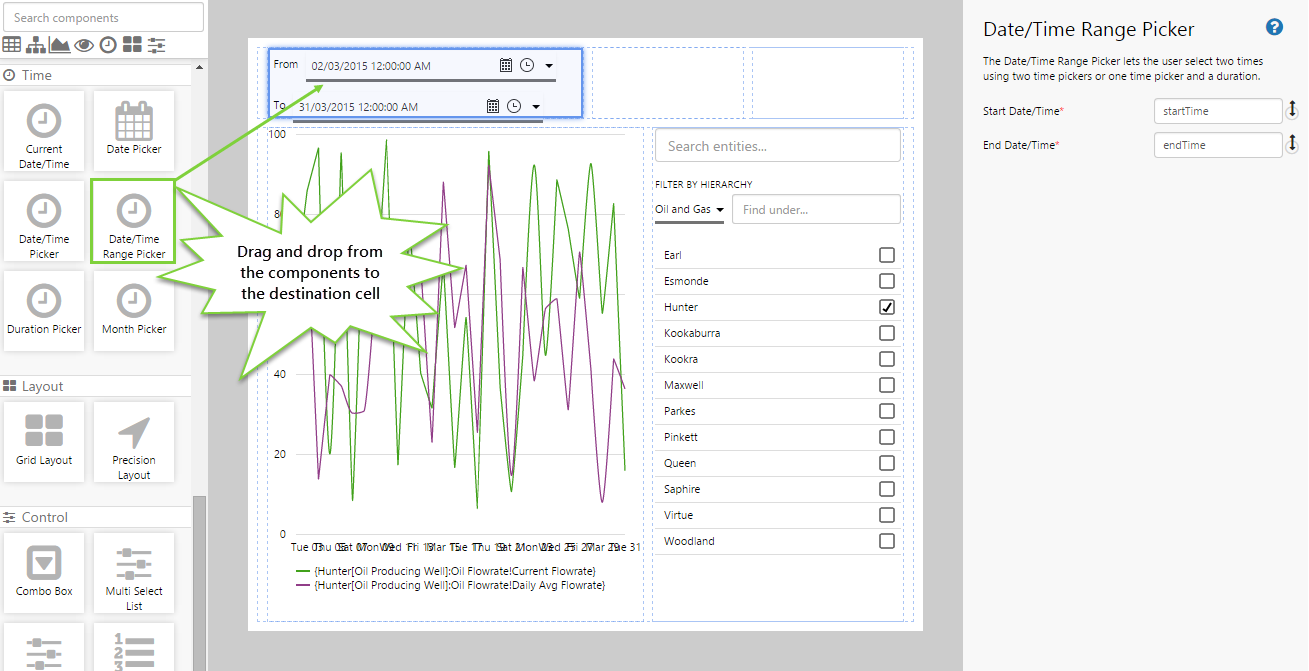
This step allows the user to select the start and end dates for the data they want to display.
- Drag and drop the Date/Time Range Picker component onto the canvas.
- Use the default events as follows:
- Start Date/Time: startTime
- End Date/Time: endTime
Step 4. Add and Configure a Combo Box for the Sample Method
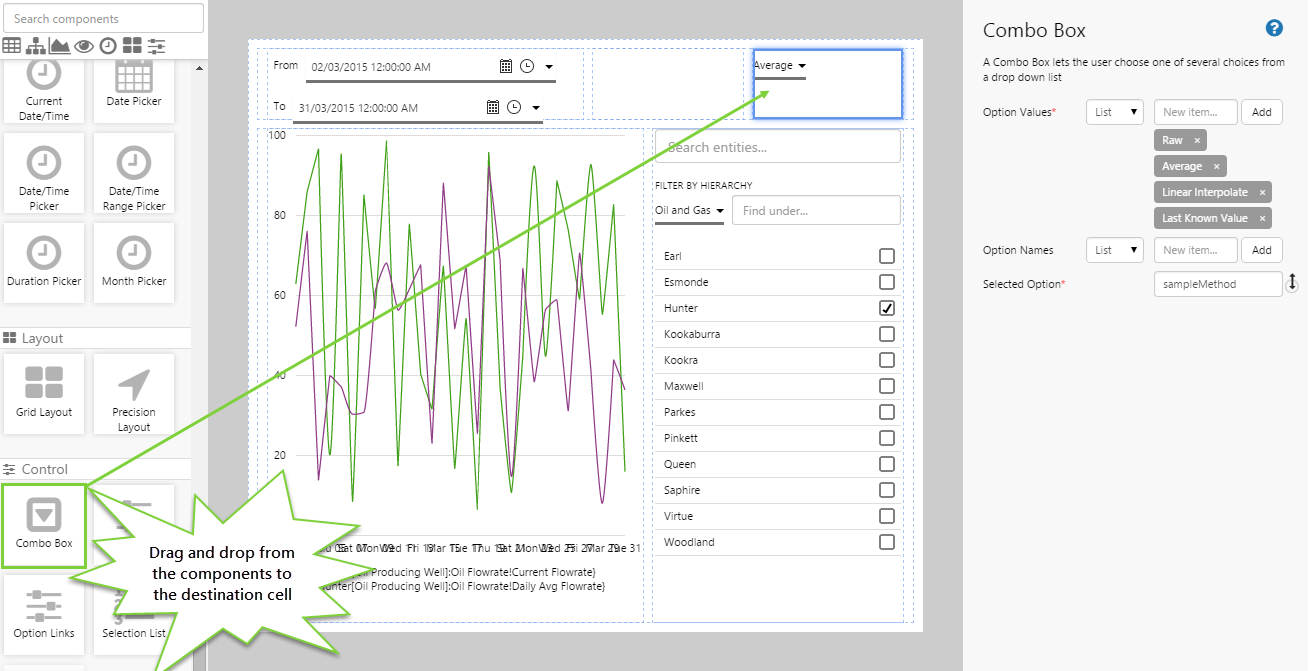
This combo box will allow the user to select the sample method for the data.
- Drag and drop the Combo Box component onto the canvas.
- Configure it as follows:
- Option Values: (List) Raw, Average, Liner Interpolate, Last Known Value
- Selected Option: sampleMethod
Step 5. Add and Configure another Combo Box for the Sample Interval
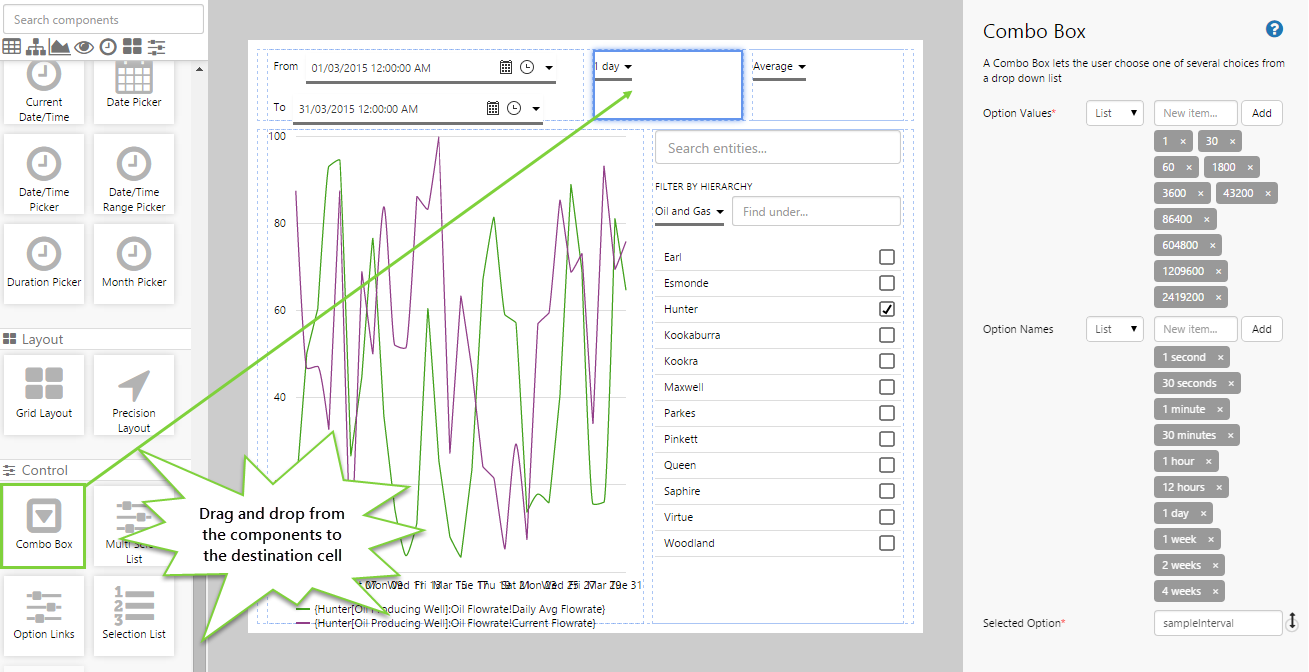
This combo box will allow the user to select the sample interval for the data. The sample interval is defined in seconds, however we want to present more user-friendly names to the user. Remember that when entering these values and names, order in important to get the mapping correct.
- Drag and drop the Combo Box component onto the canvas.
- Configure it as follows:
- Option Values: (List) 1, 30, 60, 1800, 3600, 43200, 86400, 604800, 1209600, 2419200
- Option Names: (List) 1 second, 30 seconds, 1 minute, 30 minutes, 1 hour, 12 hours, 1 day, 1 week, 2 weeks, 4 weeks
- Selected Option: sampleInterval
Step 6. All Done!
Congratulations! You have configured time series data that displays well flow rates in a line chart. The user to change the time range, sample interval, sample method, and the well being monitored.
- Click the Finish and Open
 button on the Studio toolbar to save your page and see what it will look like in run-time.
 - Try selecting different wells, times, sample intervals and sample methods, to see the chart change.
![]() Don’t forget to save your page!
Don’t forget to save your page!