Overview
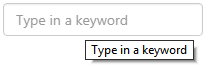
When a user types text or a number into a Text Input, the associated variable is updated. This variable can be used to change the data displayed on the page. If the variable is updated from another part of the page (for example, in the Default Value), then this appears in the control; otherwise either the hint text appears, as shown below, or if there is no hint text then the words 'Text Input...' appear.
The Text Input's value is retained in snapshots and page links.
The primary purpose of a Text Input is to enable a user to filter a dataset query by typing in text or a number which is then used as a variable parameter to a dataset query. This is covered in the tutorials.
Properties of the Text Input
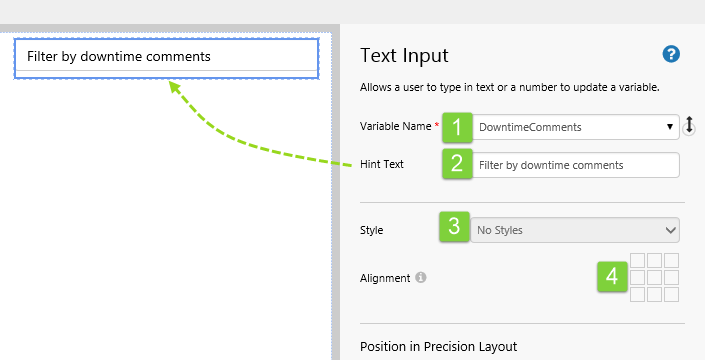
1. Variable Name: Select a Text or Number variable. In display mode, the user types into the Text Input control to update the selected variable. This variable can be used elsewhere on the page, or as a dataset query parameter.
2. Hint Text: Optionally add a hint, which appears over the text input in display mode, when the user's mouse hovers over it. This is also displayed in the text box if the Variable Name has no value.
3. Style: Select a suitable style from the drop-down list (no styles are available in the example).
4. Alignment: Click on one of the boxes to override the selected style's alignment.
Tutorial 1
If you're unfamiliar with the process of building pages, read the article Building an Explorer Page.
In this tutorial we will use the Text Input component to allow the user to search a column (DowntimeComments) in a dataset. To achieve this, we'll add a Text Input component, and configure it to update a variable used as a parameter in a dataset query.
Next, we'll add a data table component that uses the dataset query, and a text label to describe the table.
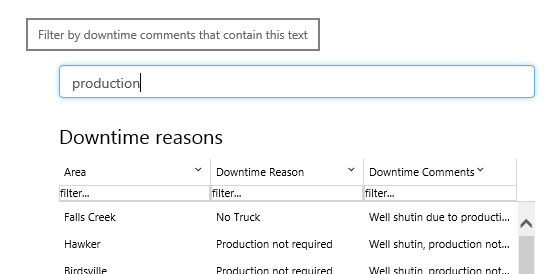
Finally, in Display Mode, we will demonstrate how to limit the dataset query result set by typing some text into the Text Input control. Note that this functionality is specific to this dataset, although the principle can be applied to other datasets. In this example, the result set will contain only rows where the DowntimeComments field contains part or all of the text that the user enters into the Text Input field.
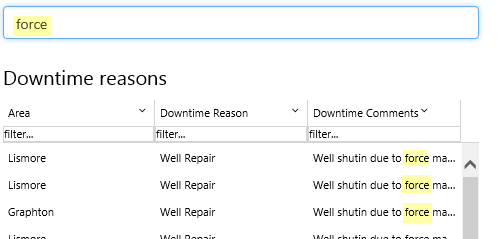
Filtering a dataset to limit the rows returned to the data table
There are four steps in this tutorial:
- Step 1. Prepare the new tutorial page.
- Step 2. Add a new default value.
- Step 3. Add and configure a text input component.
- Step 4. Add and configure a data table, and a text label.
First, the dataset is described in the following section.
About the Dataset used to Populate the Data Table
The dataset used here is called DowntimeQuery, with the description: Get all downtime from sample data, for the given period. The user can filter by comments. This dataset is in the Oil and Gas Data datasource.
declare @DowntimeComments varchar(100)
set @DowntimeComments = ltrim(rtrim(PARAM(DowntimeComments, string)) )
set @DowntimeComments = '%' + @DowntimeComments + '%'

Select Corporation, [Business Unit], Region, Area, Location, Entity, EntityType, StartDate, EndDate, DowntimeHours,
DowntimeReason, DowntimeComments
From SampleData
Where StartDate Between PARAM(StartDate, datetime) and PARAM(EndDate, datetime)
and DowntimeComments like @DowntimeComments
We will be configuring the Text Input to update the variable DowntimeComments which we will assign to the dataset's DowntimeComments parameter.
To add or update a dataset, you need access to IFS OI Server Management. Read more about How to Write a Dataset Query.
Step 1. Prepare the Tutorial Page
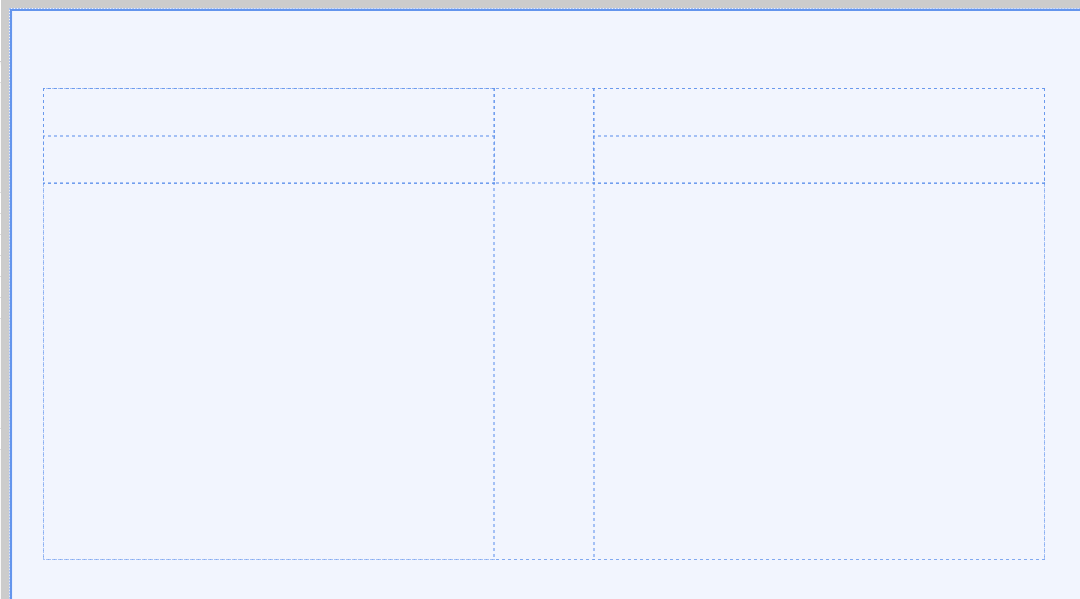
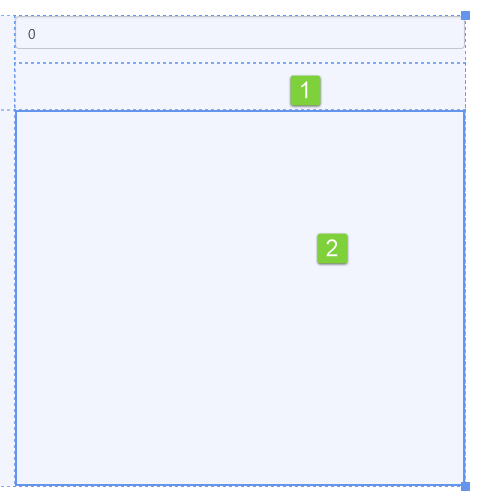
1. Drag and drop a Grid Layout onto the page, and give it a Width of about 1000 and a Height of about 470. Configure it to have three columns and two rows. Resize the first column to 45*, the second to 10*, and the third to 45*. Resize the first row to 20* and the second to 80*.
2. Drop a second grid layout onto the page onto the top left cell, and another onto the top right cell, of the first grid. Configure each of these grid layouts to have one Column, and two Rows.
This is how the page should look at this stage:
Step 2. Add a new Default Value
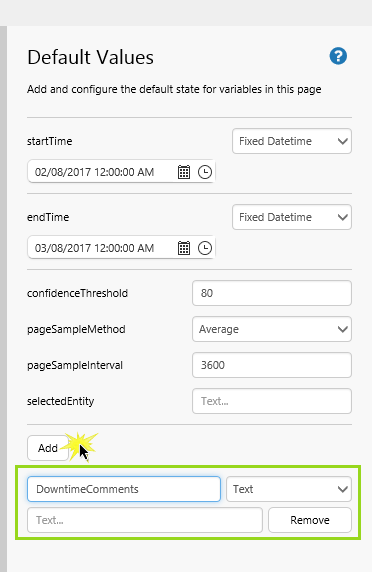
1. Open the Default Values panel.
2. Click Add to add a new default value.
3. Type the variable name DowntimeComments and keep the Text type.
Note: Leave the default value blank.
Step 3. Add and Configure a Text Input Component
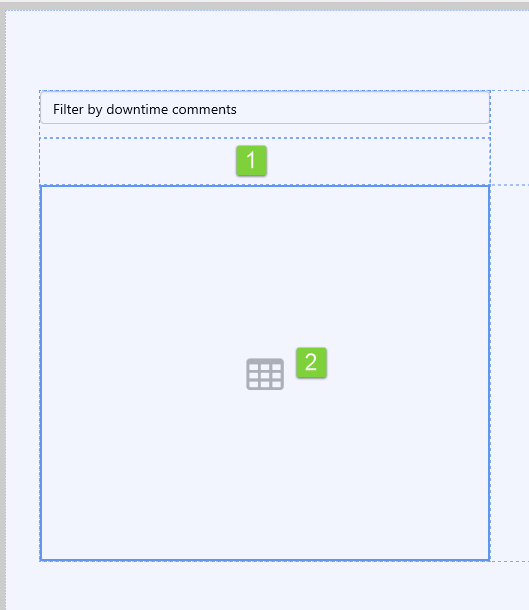
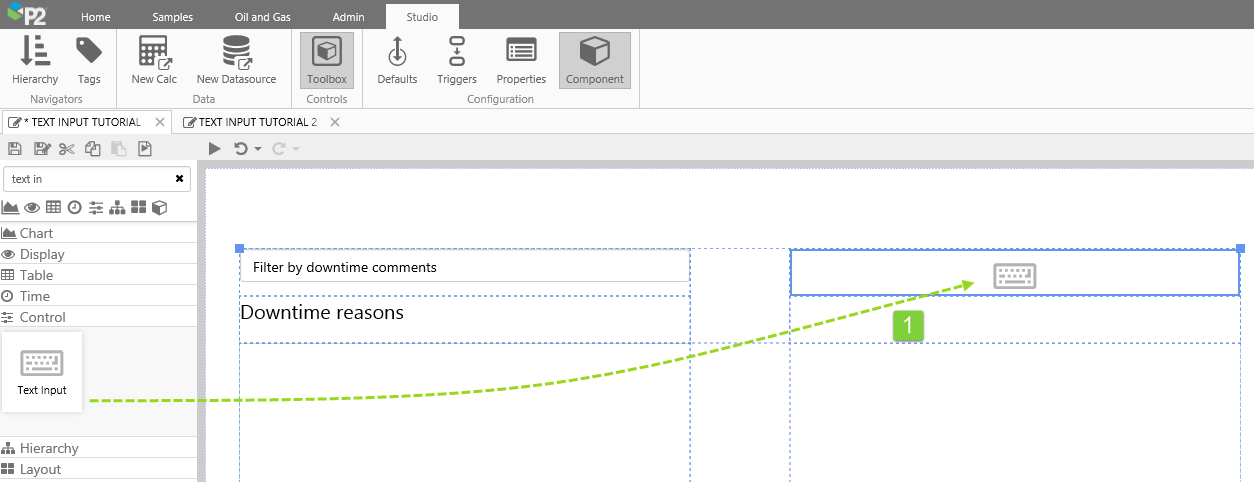
1. Drag and drop a Text Input component onto the top left grid cell. The Text Input is in the Control ![]() group in the Toolbox.
group in the Toolbox.
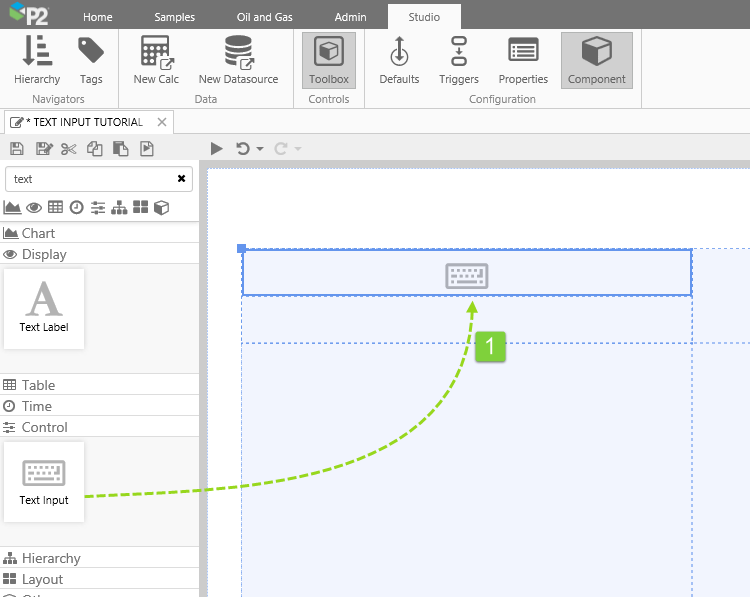
Click the Text Input to configure it.
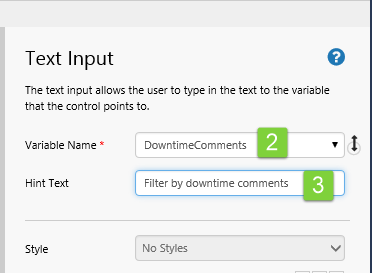
2. Select the new variable DowntimeComments from the Variable Name drop-down list.
3. Type Filter by downtime comments into the Hint Text box.
Step 4. Add and Configure a Data Table and a Text Label
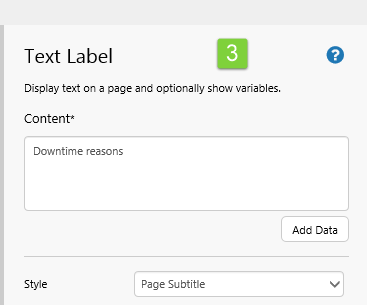
1. Drag and drop a Text Label (from the Display group in the Toolbox) into the cell below the Text Input.
2. Drag and drop a Data Table (from the Table group in the Toolbox) into the cell below the Text Label.
3. Give the Text Label a Content of Downtime reasons and select a title Style, such as Page Subtitle.
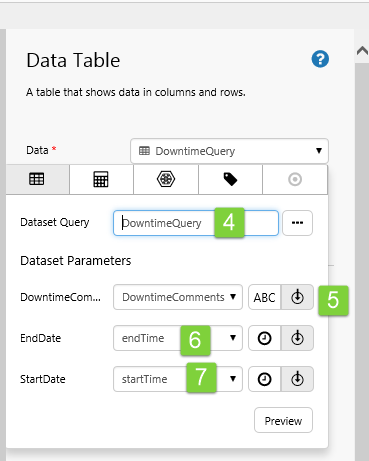
Give the Data Table's Data property a dataset:
4. Assign the Downtime Query dataset to the Data Table's Dataset Query.
Allocate the Dataset Parameters:
5. Select the DowntimeComments variable for the DowntimeComments parameter.
6. Select the endTime page variable for the EndDate parameter.
7. Select the startTime page variable for the StartDate parameter.
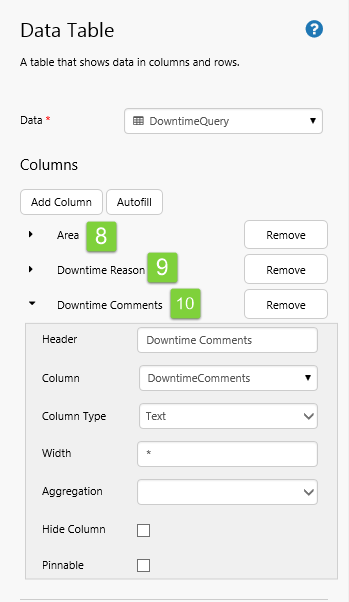
Add three table columns:
8. First column: Header: Area, Column: Area, Column Type: Text.
9. Second column: Header: Downtime Reason, Column: DowntimeReason, Column Type: Text.
10. Third column: Header: Downtime Comments, Column: DowntimeComments, Column Type: Text.
You now have a functioning Text Input component, which updates the dataset query each time the user changes the text. The dataset query results appear in the Data Table.
To try out the new functionality:
- Click the Preview
 button on the Studio toolbar to see what your page will look like in display mode.
 - Note the hint that appears when you hover over the control.
- Type some text, 'force', into the Text Input box, and note how the data table returns only rows where the downtime comment includes this text.
Tutorial 2
We're going to update the page from Tutorial 1, by adding another Text Input component. We'll use this one's variable as a parameter to a different dataset query.
Next, we'll add a chart component that uses the dataset query, and a text label to describe the chart.
Finally, in Display Mode, we will demonstrate how to limit the dataset query result set by typing a number into the Text Input control.
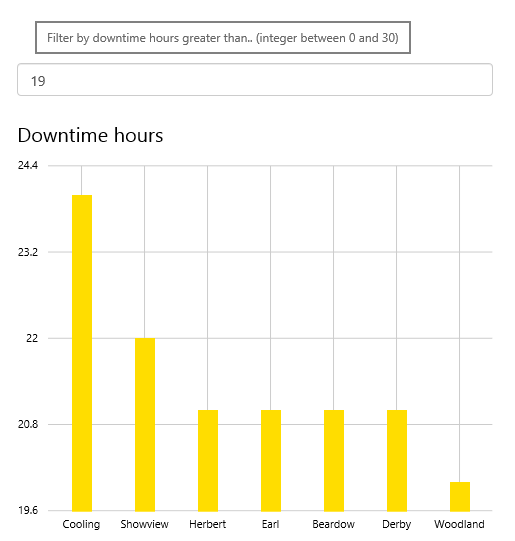
Filtering the dataset to limit the results that are used by the chart
There are three steps in this tutorial:
- Step 1. Add a new default value.
- Step 2. Add and configure a text input component.
- Step 3. Add and configure a bar chart and a text label.
First, the dataset is described in the following section.
About the Dataset used to Populate the Chart
The dataset used here is called MiningDowntime, with the description: Select mining downtime data where the downtime hours are greater than input downtime hours. This is in the Mining Data datasource.
select Entity,
       DowntimeHours
  from SampleData
where StartDate = PARAM(StartDate, datetime)
  and DowntimeHours > PARAM(DowntimeHours, integer)
  order by DowntimeHours desc
To add or update a dataset, you need access to IFS OI Server Management. Read more about How to Write a Dataset Query.
We will be using the Text Input to update the variable DowntimeHours which we will assign to the dataset's DowntimeHours parameter.
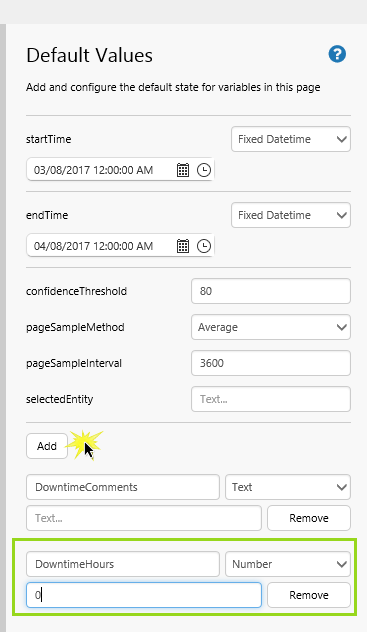
Step 1. Add a new Default Value
1. Open the Default Values panel.
2. Click Add to add a new default value.
3. Type the variable name DowntimeHours and select the Number type. Type 0 in the value text box.
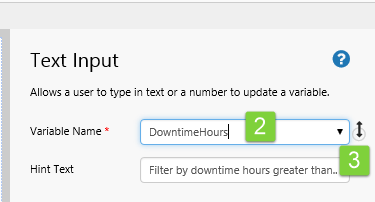
Step 2. Add and Configure a Text Input Component
1. Drag and drop a new Text Input component onto the top right grid cell.
Click the Text Input to configure it.
2. Select the new variable DowntimeHours from the Variable Name drop-down list.
3. Type Filter by downtime hours greater than.. (integer between 0 and 30) into the Hint Text box.
Step 3. Add and Configure a Chart and a Text Label
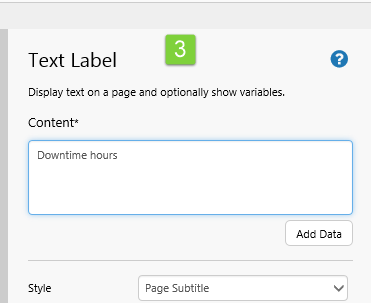
1. Drag and drop a Text Label (from the Display group in the Toolbox) into the cell below the new Text Input.
2. Drag and drop a Bar Chart (from the Chart group in the Toolbox) into the cell below the Text Label.
3. Give the Text Label a Content of Downtime hours and select a title Style, such as Page Subtitle.
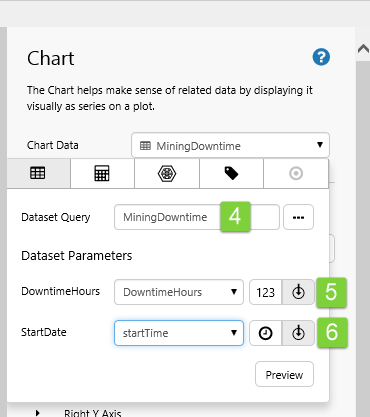
Give the Bar Chart's Data property a dataset:
4. Assign the MiningDowntime dataset to the Chart's Dataset Query.
Allocate the Dataset Parameters:
5. Select the DowntimeHours variable for the DowntimeHours parameter.
6. Select the startTime page variable for the StartDate parameter.
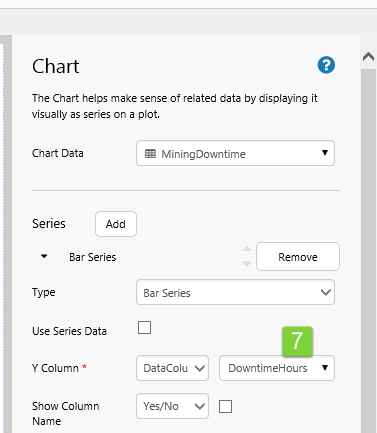
Configure the Bar Series to show the data:
7. Select DataColumn, then DowntimeHours for the Y Column.
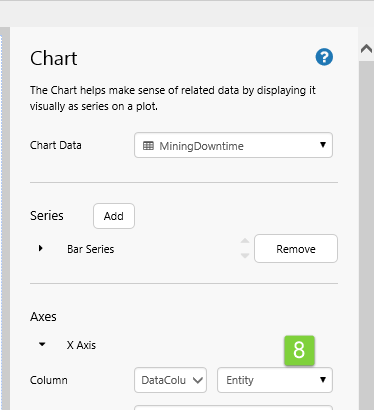
Configure the X Axis:
8. Click X Axis to expand the X Axis properties, then select DataColumn, then Entity for the Column.
You now have a second functioning Text Input component, which updates a dataset query each time the user changes the text. The dataset query results appear in the Bar Chart.
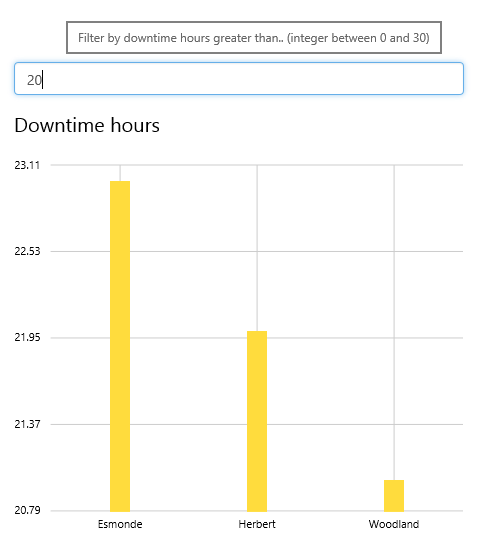
To try out the new functionality:
- Click the Preview button on the Studio toolbar to see what your page will look like in display mode.
- Note the hint that appears when you hover over the control.
- Type a number, 20, into the Text Input box, and note how the chart's dataset returns only rows where the downtime hours are greater than this number.
Tips and Best Practices
Note that if the Text Input's variable is used as a parameter for a dataset query, the dataset query refreshes for every letter or number that the user enters.
Ensure that your dataset queries are optimised to handle frequent updates, if you are using these with a Text Input variable.