ON THIS PAGE:
Overview
The Trend Controls can be found at the top of the trend, just below the ribbon.
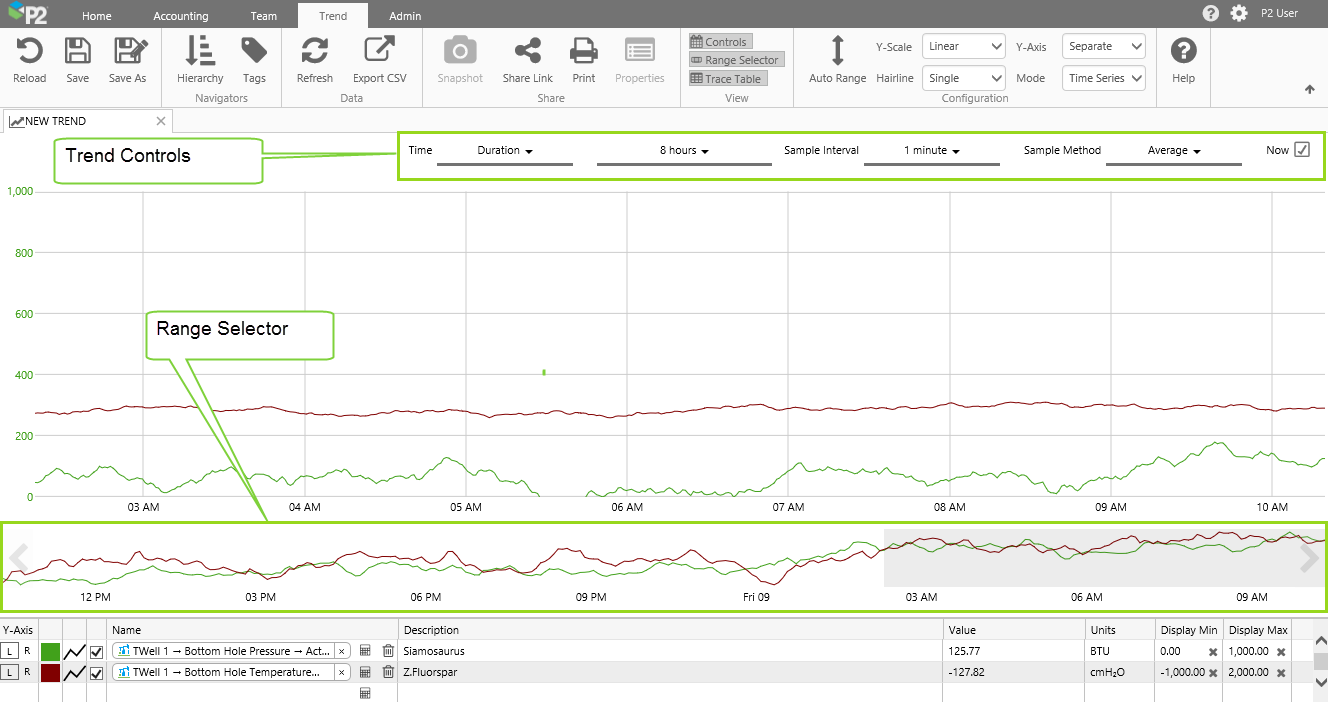
The selections you make on the Trend Controls affect the time range of the trend, as well as the data collection method and interval.
With 'Now' Selected
For a new trend, Now is pre-selected. This is how the controls look with Now selected:

| 1. | Time Setting | This is Duration where Now is selected. If you select Fixed, the Now check box is cleared. (The table below this one shows the controls where Now is cleared.) |
| 2. | Duration | This is the duration leading up to the current date and time (Now). To change the duration, select from the drop-down list (e.g. 8 hours, 3 days, 1 year). See Note below on sample method and duration, and how they work together. |
| 3. | Sample Interval | This is the sample interval (for example, 1 hour) that P2 Server uses to collect the trend data. See Note below for how the sample interval is calculated based on the trend's time range. |
| 4. | Sample Method | This is the sample method (for example, Average) that P2 Server uses to collect the trend data. See Note below on sample method and duration, and how they work together. |
| 5. | Now | When you select Now, the trend end time is the current time. This refreshes at the Sample Interval rate (with 30 seconds as the lowest refresh rate). You can also click the Refresh button on the ribbon for an immediate refresh. |
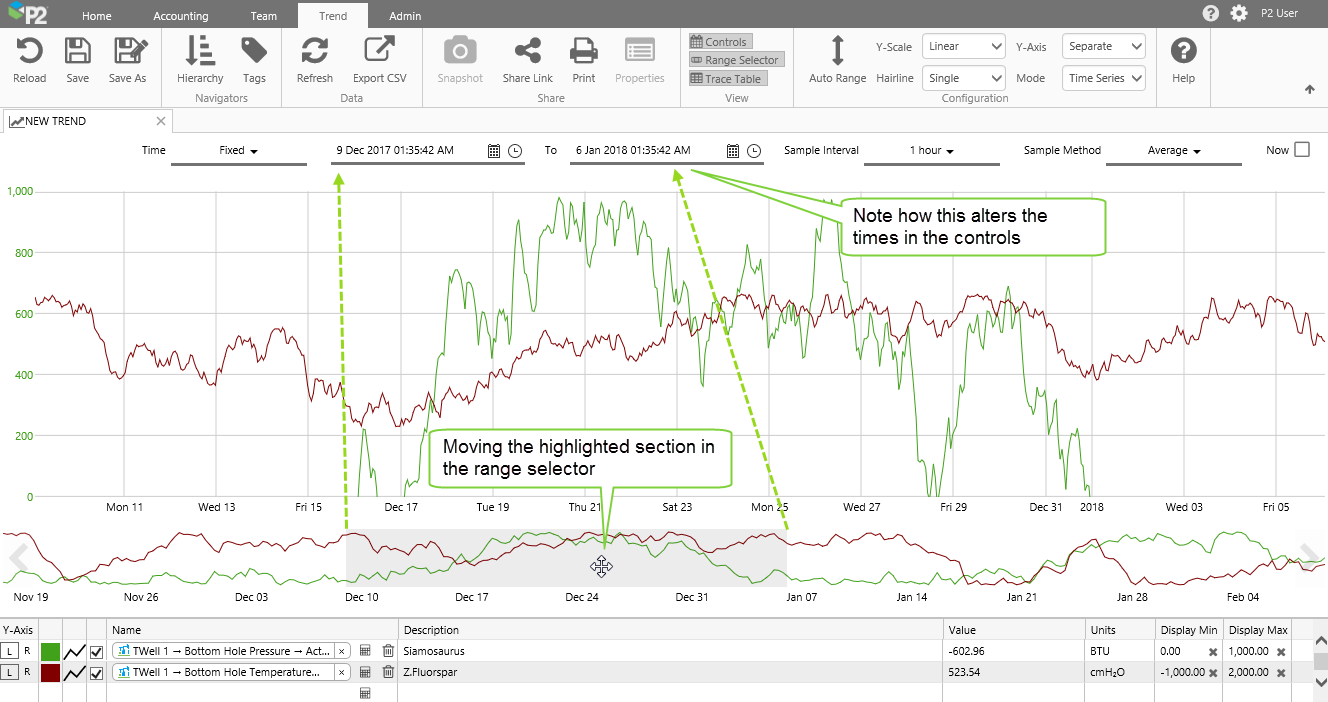
With 'Now' Unselected
If you clear Now, the time controls change so that there is also an end time (labelled To). This is how the controls look with Now cleared:

| 1. | Time Setting | Select Duration or Fixed. |
| 2. | Duration or Start Time |
If the time setting is Duration, then this is the duration leading up to the trend end time (To). To change the duration, select from the drop-down list (e.g. 8 hours, 3 days, 1 year). See Note below for how sample method and trend duration work together. If the time setting is Fixed, then select the range start date and time from the Date/Time Picker. |
| 3. | To |
This is the trend end time. To change the end time, select a date and time from the Date/Time Picker. |
| 4. | Sample Interval | This is the sample interval (for example, 1 hour) that P2 Server uses to collect the trend data. |
| 5. | Sample Method | This is the sample method (for example, Average) that P2 Server uses to collect the trend data. See Note below on sample method and duration, and how they work together. |
| 6. | Now | When you select Now, the trend end time is the current time. This refreshes at the Sample Interval rate (with 30 seconds as the lowest refresh rate). You can also click the Refresh button on the ribbon for an immediate refresh. (The table above this one shows the controls where Now is selected.) |
Notes on the Trend Controls
For performance reasons, the options available in the controls are interdependent.
If Raw is selected, the time setting becomes Duration and the duration is selected as 8 hours. The limit of 8 hours can be updated in Explorer's web.config file (MaximumRawDuration). You can choose a different duration from the available options, which also vary depending on the Sample Method.
The available Sample Intervals change depending on the trend's selected time range, or the selected Duration. The longer the trend's time range, the larger the available sample intervals are. This prevents too much data being requested (for example, you cannot request one year of data at a 20 seconds sample interval).
Changing your Time Selection with the Range Selector
The Range Selector, located below the Trace Window, works interchangeably with the Time trend controls to set your trend time range. The range selector has a highlighted section that matches the time range set by the date pickers, with double that time period shown before the selection if Now is selected (for example, for a new trend).
Resizing the highlighted section
1. Hover the mouse over the left or right edge of the highlighted section, until you see the mouse horizontal resize pointer ![]() .
.
2. Now click and drag to left or right. Note how the trend start and end time changes.
Moving the highlighted section
1. Hover the mouse over the central portion of the highlighted section, until you see the mouse move pointer ![]() .
.
2. Now click and drag the whole highlighted section to left (earlier) or right (later). Note how the trend start and end time changes.
Changing the Range Selector start and end dates
Click the left or right arrow to move the start and end date of the range selector.
Note that the dates on the highlighted section do not change; the highlighted section just moves across (to left or right) in relation to the changing start and end dates of the range selector.
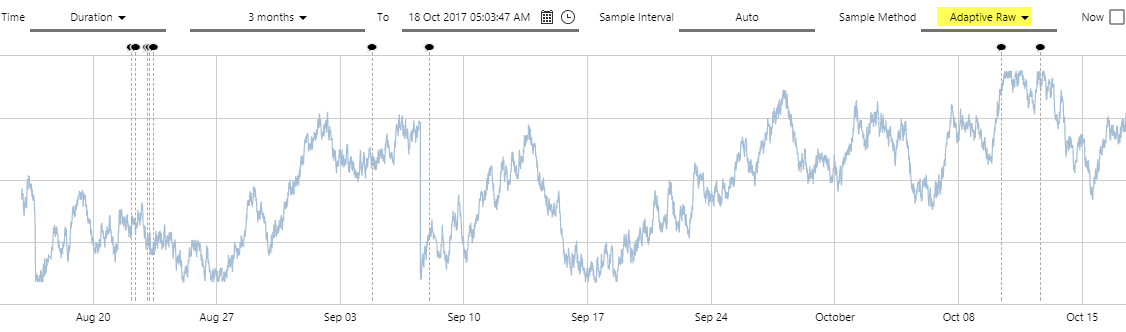
The Adaptive Raw Sample Method
The Adaptive Raw sample method works differently from the other sample methods.
Adaptive Raw fetches far fewer data points from P2 Server (a maximum of 2000 points), yet renders a trend that is virtually identical to that produced when using the ‘Raw’ sample method (you may need to adjust the Sample Interval for Raw, to notice this).
The Adaptive Raw method renders the trend much faster than the ‘Raw’ method does. The Sample Interval cannot be selected for this method; it is called ‘Auto’, and is determined automatically to deliver the optimal number of data points. Server fetches the raw data points from the Historian, then uses an algorithm within its calculation engine to reduce the number of points, before sending these on to Explorer for the trend. (Please note that when you export to CSV, these are the same points that are exported; not the raw points from the Historian.)
Using the Adaptive Raw method, you can now view granular trends over a much longer period than before (up to two years, rather than up to eight hours).
Release History
- Trend Controls 4.5.5 (this release)
- Trend Controls 4.5.4