This article applies to the Data Table in versions 4.4.2 of P2 Explorer. For the latest help, see Using Data Tables.
Overview
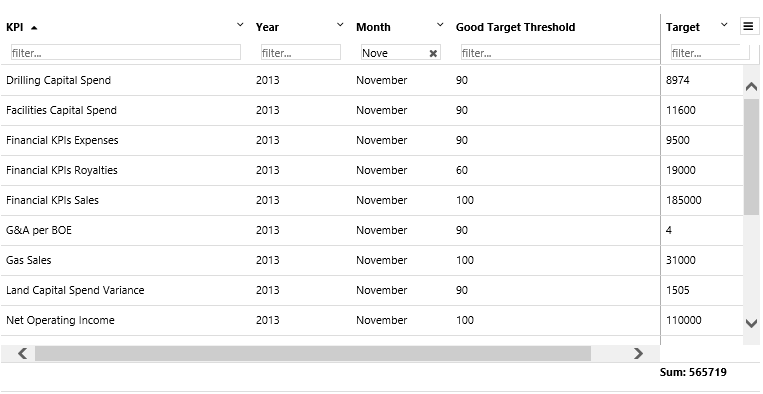
P2 Explorer Data Tables display your data in tabular format (rows and columns). Possible configuration options include grouping your data, setting group aggregates, filtering, sorting, hiding, resizing or pinning columns.
Your data table may also show totals such as average value, maximimum, count and so on (depending on how it has been pre-configured).
Data Table Features
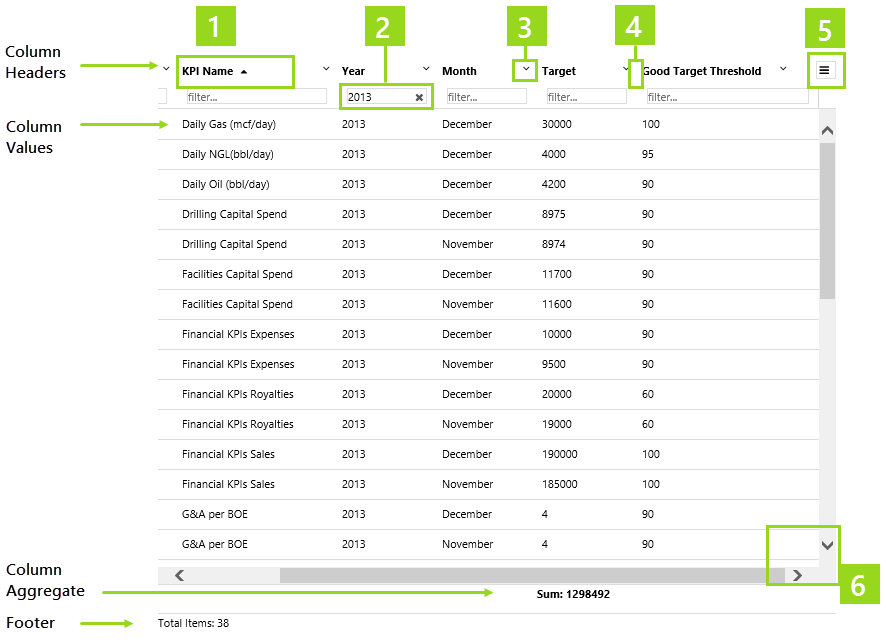
Data table features and functionality may vary, depending on how the table is configured.
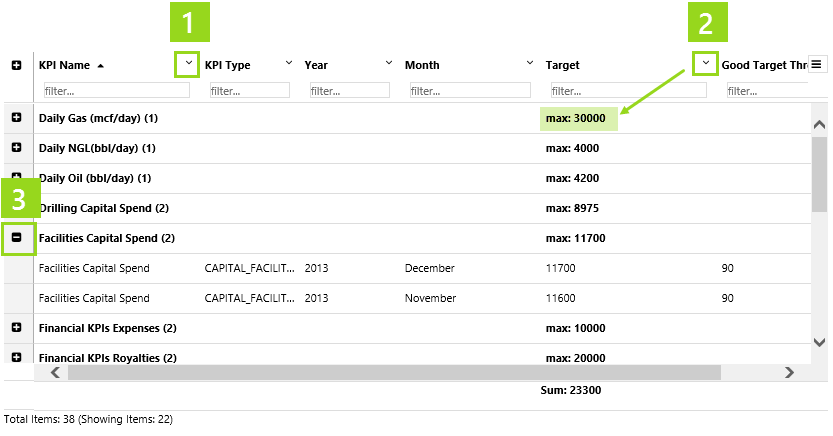
1. Sort:
Click a column header to sort in ascending (click once) or descending (click twice) order. Click a third time to unsort.
2. Filter:
Type text in the filter edit box below a column header. You can filter on more than one column.
3. Open column functions menu:
Click the down arrow to the right of the column header. Clear all filters, and hide some columns.
4. Resize column:
Hover between two column headers, until you see a resize pointer. Then drag to left or right.
5. Open grid menu:
Click the menu button on the top right of the table. This menu may include the option to group this column.
6. Scroll:
Scroll horizontally or vertically using the scrollbars.
Note: Your data table may have a footer, and it may include a column aggregate for various columns (average, minimum, sum, etc.), if so configured.
Column Functions Menu
Click the little arrow next to a column header, to open that column's function menu.
The Column Functions Menu lists various menu items for a column. These depend on how the column was configured in design time, as well as the selections you have already made for this column, or another.
For example, if you have grouped any column, you will find menu items for aggregating a column's data within the grouping.
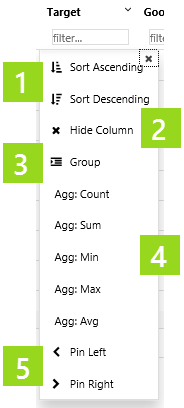
Here are some of the menu items from a column functions menu:
1. Sort:
Click to sort the column in ascending/descending order. (You can also click the column header to sort.)
2. Hide Column:
Click to hide the column from the dataset table.
3. Group:
Click to group the column. Equal values within the column are grouped together. (Note that you can ungroup a grouped column.)
4. Aggregates:
Click one of these items, to aggregate column values. Some of the options are: Agg: Count, Agg:Sum, Agg:Avg. Apart from Agg: Count, you should limit aggregation to numerical columns.
5. Pin:
Click Pin Left or Pin Right to pin a column to the left or right of a table, fixing it in position when you use the horizontal scrollbar.
Grid Menu
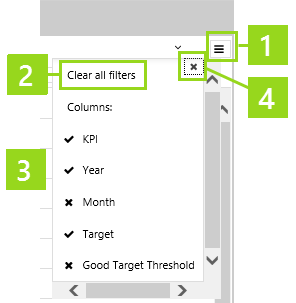
The Grid Menu allows you to hide columns from the data table (or show hidden columns), as well as clear all column filters; it is only available if your data table has been configured to show it.
1. Open grid menu:
Click the little button on the far right of the dataset table, to open the grid menu.
2. Clear all filters:
Any filters you have applied to columns will be cleared.
3. Show/Hide column:
Hover over a column header name in the list, then click to hide that column from the dataset table (a hidden column is preceded by a cross ). Click again to show the column again (a visible column is preceded by a tick/check ).
4. Close:
Click to close the Grid Menu.
Grouping in a Data Table
The data table may be configured to enable grouping.
1. Group by a Column:
Click the down arrow to the right of the column header to open the Column Functions Menu, then select the Group menu item. The grouped column moves to the leftmost side of the table.
Note: You can group more than one column.
2. Set a Group Aggregate:
Click the down arrow to the right of the column header to open the Column Functions Menu, then select the Agg: Avg menu item. An average value for this column is displayed in each grouping.
Note: To remove a group aggregate for a column, select a different group aggregate, or select the Agg: Remove menu item.
3. Expand/Collapse Grouping:
Click the plus button to the left of the grouping to expand that group, and click the minus button to collapse it again. The expanded group reveals the usual table rows, only for that group.
Note: You can expand more than one grouped row.
Footer: Your data table footer shows the total number of rows, as well as the number on display in their groupings.
Data Table Demo
Watch the video below to see how to manipulate a data table.