ON THIS PAGE:
This section describes some of the messages that may appear in the Monitor Status page, and how to resolve them.
Monitor Restart Warning Message
Problem: A message appears on the monitor status page.
Description: The message is: Monitor has been requested to run but it is already running. Please refer to the Sentinel documentation for more information.
Cause: The message appears when the monitor trigger attempts to start the next lot of monitor processing while the monitor is already processing tests.
Resolution: You can take any of the following actions to resolve this issue:
- Adjust the trigger so that the previous processing session always has enough time to complete.
- Reduce the number of monitor entities if there is too much processing in a single monitor test.
- Reduce the number of monitors throughout the installation if processing in general is too slow and is affecting system performance.
If you ignore the message, processing will continue. However, this will not necessarily occur at the expected trigger intervals and it is best to address the underlying cause.
No Entities for Processing Warning Message
Problem: A message appears on the monitor status page when a monitor test source does not return any entities for processing.
Description: The message is:
The source did not return any entities for processing. For further information please consult the Sentinel documentation.
Cause: When using Server this can be caused by either of the following two cases:
- One of the process inputs has been configured to Source Entity but none of the source entities have a data source in Explorer.
- The process inputs have been configured to a set of attributes or attribute values and the combination of these configurations results in no matches found in Explorer.
Resolution: Take the following steps to resolve this issue:
- Open the monitor that is causing the problem.
- Make the necessary adjustments in the test source and process inputs.
- Change the test source if this is causing the problem.
- Change process inputs if these are causing the problem.
Service Error Message
Problem: Sentinel User Interface is not connecting to the Sentinel Service.
Description: The following message appears in the Main panel when the Sentinel User Interface cannot connect to the Sentinel Service:
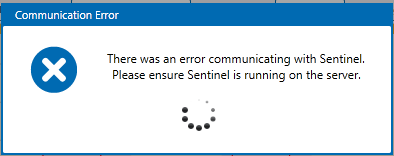
Cause: The most probable causes for this message are:
- The Sentinel Service has stopped.
- There is a network connection issue.
- A firewall is preventing the Sentinel User Interface from connecting to the Sentinel Configuration Service.
Resolution: The system administrator should check the Sentinel Service to see if it is running, and restart it if necessary. If the Sentinel Service is running, then the system administrator should check the network connection and resolve any network problems; this is possibly a firewall problem.
Note: If you hover the mouse over Show Exception, a more detailed message is displayed.
To restart the Sentinel Service:
- Go to Control Panel > Administration Tools > Services on the server that hosts the Sentinel Service.
- Locate ISS Sentinel Service in the list.
- If the status is stopped, right-click on ISS Sentinel Service, and select Start from the list.
If the Connection Problem is Caused by a Firewall:
If restarting the Sentinel Service does not resolve the problem, there may be a firewall preventing the Sentinel User Interface from connecting to the Sentinel Service.
You can take either of the following actions to resolve this issue:
- Disable any firewalls that may be preventing the connection between the Sentinel configuration service and the user interface.
- Set a rule to allow inbound traffic.
Missing Process Input Parameters
Problem: During processing, a monitor raises a warning about Missing Data.
Description: The message is:
Error fetching data for [ASSET NAME:ATTRIBUTE]: The entity name could not be properly resolved for one or more historization points. Check that the entity string is defined for the duration of the request date times.
Repeated warnings may ultimately cause the monitor to stop (as determined by the Sentinel configuration ShutdownMonitorOnWarnings and MaxWarningCount parameters).
Cause: Sometimes an asset that is being monitored is missing attributes or attribute values that should be defining process limits.
Example:
The temperature on a set of pumps is defined as an input in a particular Min Max process. The pump’s :MaxTemp attribute is defined as the Max limit for the process, and the pump’s :MinTemp attribute is defined as the Min limit for the process.
In this example, The :MinTemp attribute is missing for PUMP001 (it has not been configured in Explorer yet). Every time the test runs against the asset PUMP001, it fails to test against the missing MinTemp attribute, and a warning is raised.
Resolution: Configure the missing attributes or attribute values of assets, in Explorer, if these are available. The warning message identifies which asset has missing attributes (in respect to the process settings); use this information to find and configure the missing attributes/attribute values.
Alternative Resolution: You can create a new entity in Explorer that is of data type String and which has an expression that is equal to the UnconfiguredLimitString parameter in the Sentinel Configuration file (the default value is “unconfigured”. You can assign this asset to any known unconfigured attributes of entities that are used as limits in Sentinel processes.
During processing, Sentinel recognises that the missing attribute is a declared “unconfigured” attribute, and continues processing without raising any warnings.
Note: This alternative resolution applies to Min Max and Alarm processes only.