ON THIS PAGE:
The Trace Table contains the details about traces that are plotted on the Trend and is found at the bottom of the trend page.
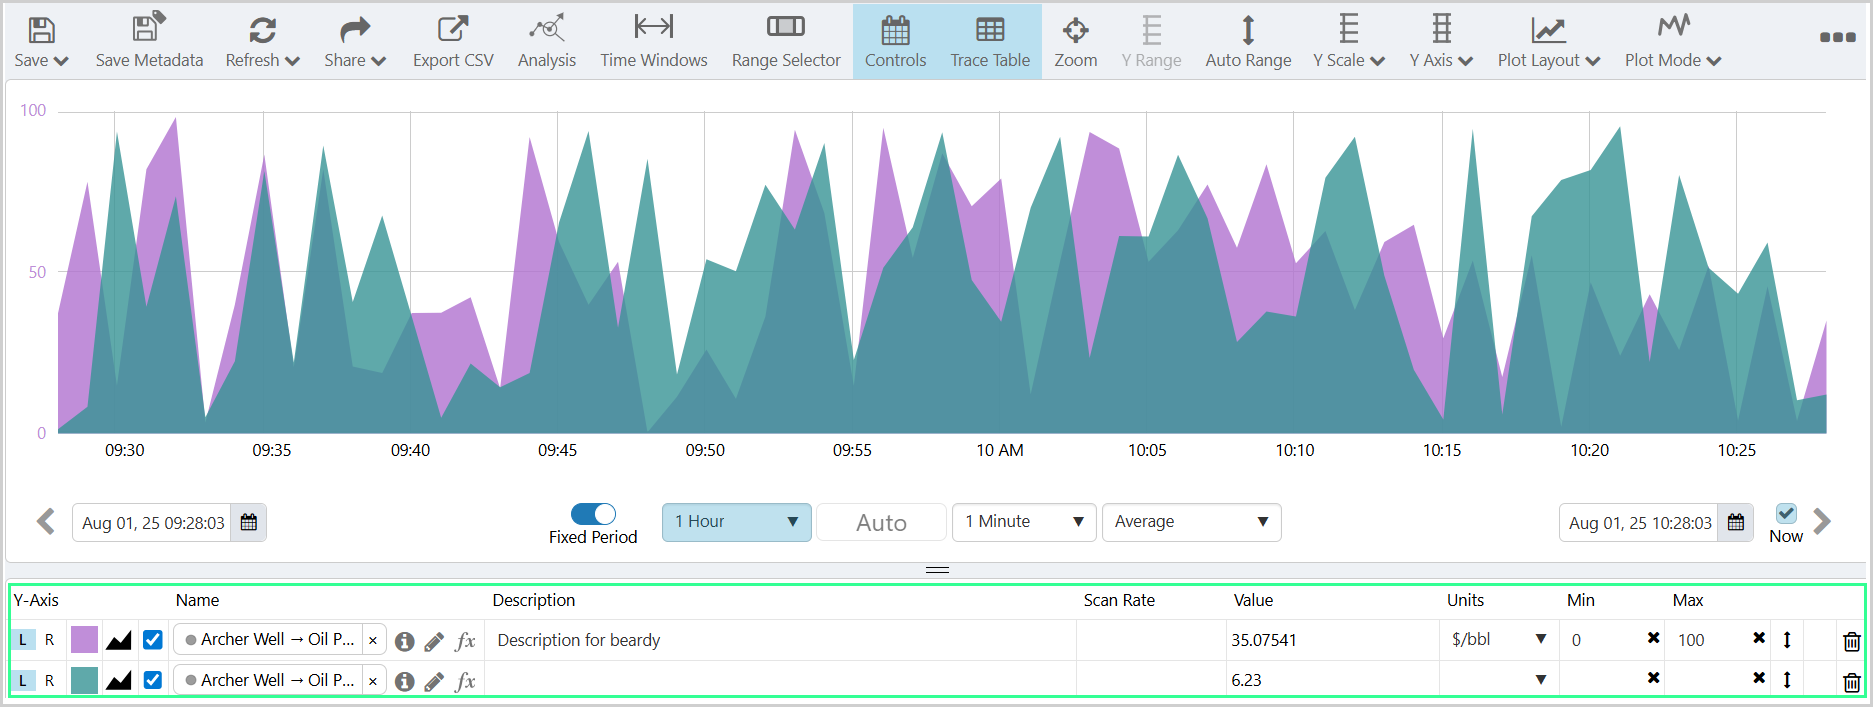
The Trace Table
Each tag, attribute or calculation that is a trace on the trend is listed in the table.
The trace table:
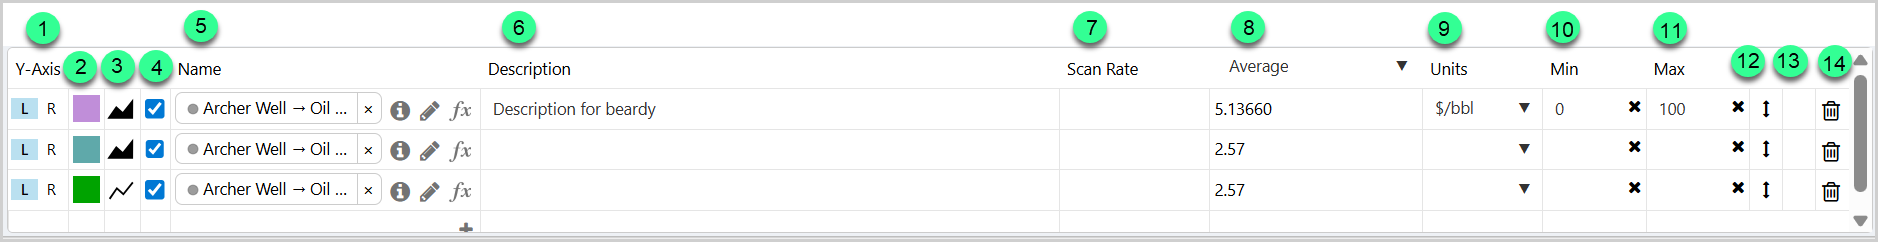
| 1. | Axis | Click L or R to change the y-axis for the trace to the left or right of the trace window. Traces have a left y-axis by default. | ||||||||||||||||||||||||||||||
| 2. | Colour |
Change the trace colour by clicking on the coloured square and:
|
||||||||||||||||||||||||||||||
| 3. | Style |
Click on the trace style to open the style options box and select from:
Note: This column only appears when the trend is in Time Series and Duration modes. |
||||||||||||||||||||||||||||||
| 4. | Show/Hide Trace | Select to show the trace or clear to hide the trace. | ||||||||||||||||||||||||||||||
| 5. | Name |
The trace Name is the full display name of the tag, attribute value or calculation. An attribute value may have an underlying value of a tag or a calculation. Add an item name to the trace table by:
Edit an item name by double clicking on the trace name and using auto complete. The Name field contains a:
|
||||||||||||||||||||||||||||||
| 6. | Description | The description from the underlying tag, or calculation. | ||||||||||||||||||||||||||||||
| 7. | Scan Rate | Shows the rate at which the source system stores raw data points; providing information as to why using certain tags may result in poor system performance. | ||||||||||||||||||||||||||||||
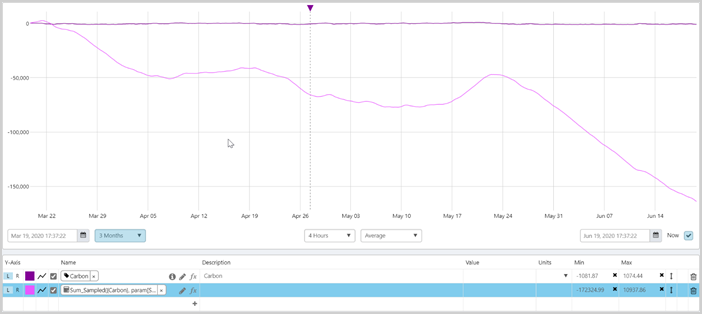
| 8. | Value | This shows the values for the respective items in the trace. If the trend has hairlines, then this is the current value from the latest hairline that was added or moved. | ||||||||||||||||||||||||||||||
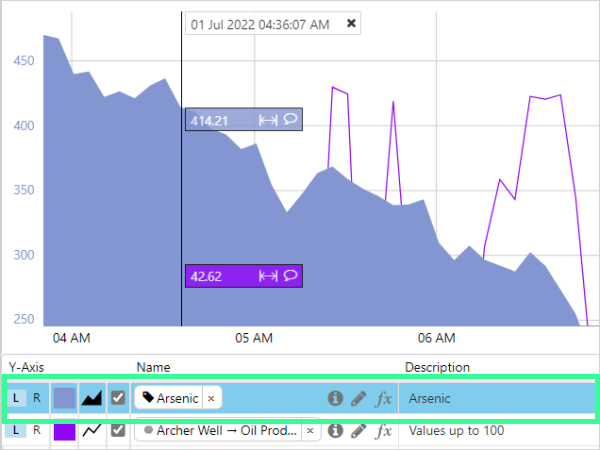
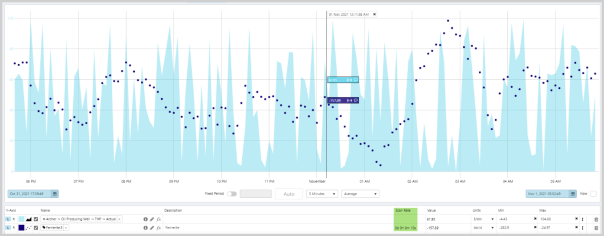
| Dual Hairline Statistics | The Value column changes to a drop-down list of Dual Hairline Statistics options, if the trend is in Dual hairline mode and if two hairlines are selected. Select from one of the following options: | |||||||||||||||||||||||||||||||
Note: The values and statistics in the trace table are calculated using the last known value before each hairline position, whereas the hairline information panel shows the interpolated value at the hairline position. This column only appears wen the trend is in Time Series mode. |
||||||||||||||||||||||||||||||||
| 9. | Units | The units from the underlying tag or calculation. | ||||||||||||||||||||||||||||||
| 10. | Min | The minimum value from the underlying tag or calculation's Display Range (on IFS OI Server). Click in the box to edit the value. To reset its minimum value as stored in IFS OI Server, click the |
||||||||||||||||||||||||||||||
| 11. | Max | The maximum value from the underlying tag or calculation's Display Range (on IFS OI Server). Click in the box to edit the value. To reset its maximum value as stored in IFS OI Server, click the |
||||||||||||||||||||||||||||||
| 12. | Align Range | Use to align the minimum and maximum to a specified tag. When you click on the vertical double arrow |
||||||||||||||||||||||||||||||
| 13. | Indicators | Any issues with the data or the data fetch are indicated by an error icon. Hover over the |
||||||||||||||||||||||||||||||
| 14. | Delete | To remove the trace from the trend, click the trash |
Additional Features
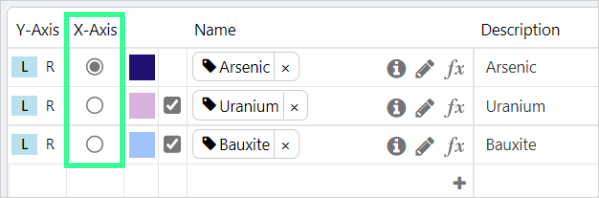
- If XY Mode is the selected Plot Mode in the toolbar, the X-Axis selector column is shown in the trace table. Click the radio button next to an item, to assign it to the X-Axis.
- The trace selected in the table is displayed at the front on the chart.
- To adjust the height of the Trace Table, click and drag its top border.
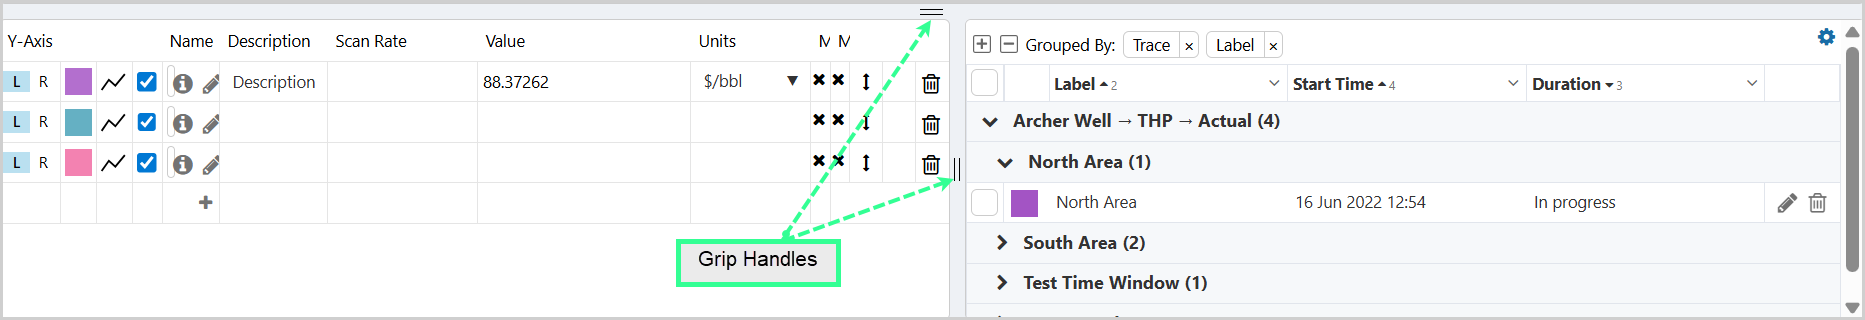
- The Trace Table and Time Windows Table can be resized both horizontally and vertically by using grip handles.
Keyboard Shortcuts
These keyboard shortcuts can be used in the trace table:
- Arrow Keys: Use the up and down arrows to select a new item in the trace table. If you are editing the Display Min or Display Max of a trace item, use the up and down arrows to increase/decrease by 1.
- Delete Key: Remove the selected trace from the trend.
- Esc Key: Cancel out of whatever you are editing.
- Spacebar: Toggle between showing and hiding the selected trace item.
Trace Name
The item’s Name in the trace table has the following features:
- The name is preceded by an icon that indicates what it is
- An information icon
 linking to the Point Details
 - A pencil icon
 linking to the Calculation Editor
 - There is a function icon
 linking to the Quick Functions
 - The Name edit box has Auto-Complete functionality for tags and attributes
- The name for an attribute value is displayed as: Entity -> Attribute -> Attribute value
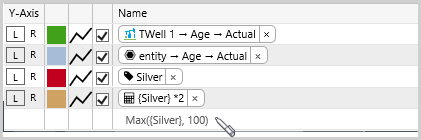
The following icons provide information regarding the trace item:
| Icon | Item | Icon | Item |
| Tag | An invalid definition, for example an incomplete attribute definition | ||
| Calculation | Templated attribute | ||
| Analysis | OR Attribute (where the entity’s primary template does not have an icon) | ||
| Attribute: This is the icon for the entity’s primary template, and can vary (e.g. |
Auto-Complete
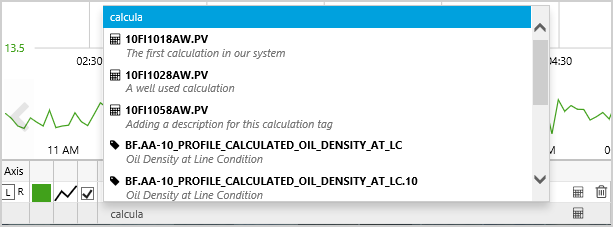
When you start typing a name directly into the Name column for a new item in the trace table, a list of tags, calculations and entities appears, where the name or description matches the search text.
The trace table allows wildcard filtering capabilities (using * and ?) for tags, entities, and calculations. This allows to search for patterns, as an alternative to the simple text match, reducing the time taken to find the required item for their trend.
- Use an asterisk (*) to search for patterns that contain one or more alpha-numeric values.
- Use one or more question mark characters (?), to limit replacement text to one alpha-numeric character per question mark symbol.
- Use a combination of asterisks and question marks.
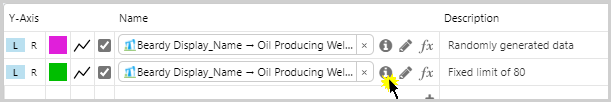
If you are adding an attribute value, you can do this using auto-complete, starting with the entity name, and qualifying until you have the attribute value, as follows:
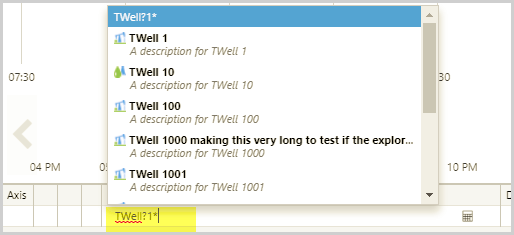
1. Type in part of the entity name, then select an entity (TWell 1) from the list of entities and tags.
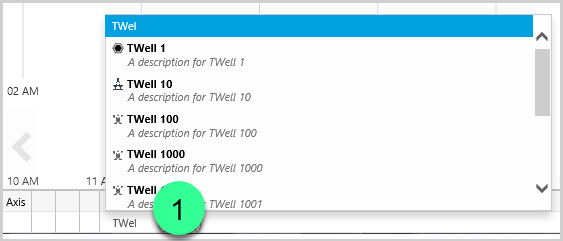
Note: You can also type in wildcard characters (* or ?) if you are searching for a pattern, such as in the screenshot below where we are searching for TWell?1* (all tags/tag descriptions or entities that start with TWell, followed by a character or space, followed by 1, followed by one or more characters). Read more about Searching with Wildcard Filtering.
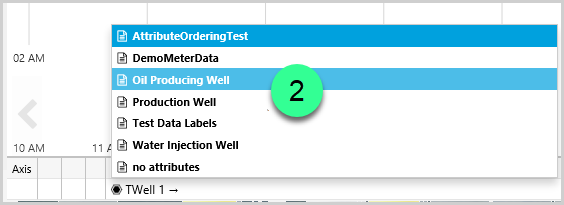
2. Select a template (Oil Producing Well) from the list of templates for that entity.
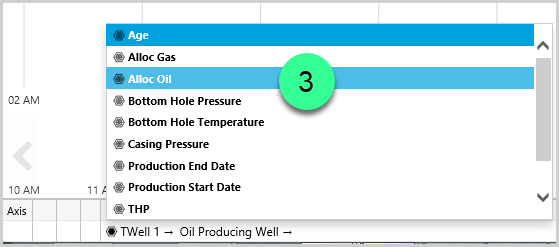
3. Select an attribute (Alloc Oil) from the selected template’s list of attributes.
4. Select an attribute value (Actual) from the selected attribute’s list of attribute values.
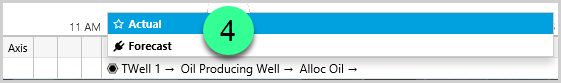
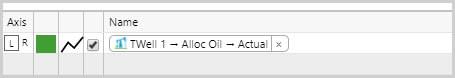
The fully qualified display name appears in the Name column of the trace table.
Calculation Editor
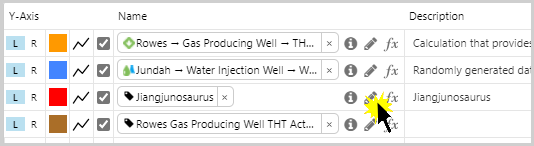
Each item in the trace table has a pencil icon ![]() in the Name column, linking to the Calculation Editor, so that you can add calculations to your trend. (The Calculation Editor can also be used to create a Templated Trend.)
in the Name column, linking to the Calculation Editor, so that you can add calculations to your trend. (The Calculation Editor can also be used to create a Templated Trend.)
To edit a calculation from the trend, or save to a new calculation, click the corresponding pencil icon in the trace table.
In the Calculation Editor add a new, or edit an existing, calculation. You can then save the calculation to a new name, to an existing name, or use it as an ad hoc calculation for this particular trend.
Note: You can also type a calculation directly into the Name column.
Quick Functions
You can open the Quick Functions, Cumulative (Sample Interval), Cumulative (Hour) or Cumulative (Day), for a tag or attribute value from a trend's trace table.
Hover over a row in the trace table, then click the quick function ![]() icon.
icon.
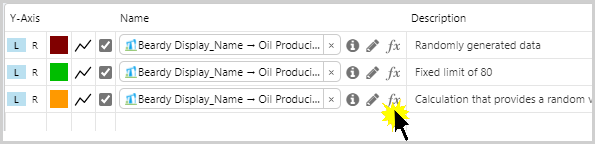
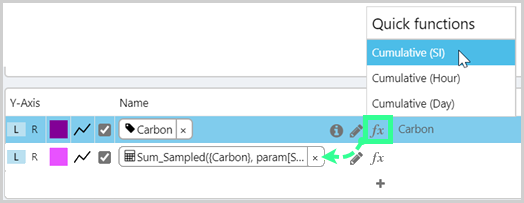
The function is added as a new ad hoc calculation trace.
Point Details
You can open Point Details for a tag or attribute value from a trend's trace table.
Hover over a row in the trace table, then click the information ![]() icon.
icon.
The Point Details for the tag or attribute value opens in a new Explorer tab.
Note: only tags and attribute values have an information icon.
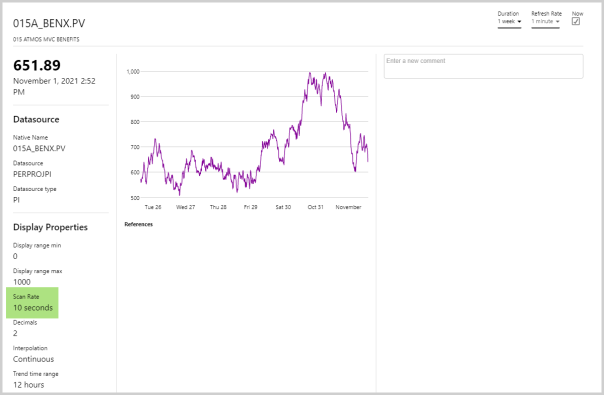
Scan Rate
A Scan Rate field is available in a tag’s point details and the trend trace table. The Scan Rate shows the rate at which the source system stores raw data points. For example, a ten second scan rate will return six data points per minute.
The scan rate can affect system performance, in that a low scan rate can cause the system to request very large volumes of data. Displaying the scan rate provides the end user with an understanding of why they may be experiencing poor performance when using certain tags.
The Scan Rate column in the trend tells us how often a new raw data point is available to the trend.
Scan Rate in the trend trace table:
Scan Rate in tag point details:
Trace Table Video
Several different steps are demonstrated in the video:
- Error message is viewed and dismissed.
- Error item is deleted from the trace table.
- Calculation item is viewed in the calculation editor.
- Various Min and Max values are manually updated and changed back to configured values.
- Colour and opacity are updated for a trace item.
- A trace item is given an area style, and another one is given a dot style.
- Right Y-Axis is chosen for some of the items.
- The XY Mode is chosen, from the Plot Mode on the toolbar, and we allocate the X-Axis to an item (note how the X-Axis column is added to the table).
- The Time Series Mode is chosen (note how the X-Axis is no longer shown in the table).
- Some of the trace items are hidden from the trace.
- A single hairline is added (note the Value column in the trace table).
- Dual hairlines are added, and the Value column changes to dual hairline statistics (note the various statistics that are selected in the trace table).
- Point Details are opened for a tag and for an attribute value.
Release History
- Trace Table 4.18
- Grip Handles
- Scan Rate Field
- Trace Table 4.17.1
- Added wildcard filtering to trace table Name field
- Trace Table 4.10
- Selected trace to front on chart
- Edit trace from trace name
- Scan rate
- Trace Table 4.9
- Trace Table 4.8
- Trace Table 4.6
- Trace Table 4.5.5
- Trace Table 4.5.4